Abstract
MicroRNAs are small noncoding RNAs that regulate cellular development by interfering with mRNA stability and translation. We examined global microRNA expression during the differentiation of murine hematopoietic progenitors into megakaryocytes. Of 435 miRNAs analyzed, 13 were up-regulated and 81 were down-regulated. Many of these changes are consistent with miRNA profiling studies of human megakaryocytes and platelets, although new patterns also emerged. Among 7 conserved miRNAs that were up-regulated most strongly in murine megakaryocytes, 6 were also induced in the related erythroid lineage. MiR-146a was strongly up-regulated during mouse and human megakaryopoiesis but not erythropoiesis. However, overexpression of miR-146a in mouse bone marrow hematopoietic progenitor populations produced no detectable alterations in megakaryocyte development or platelet production in vivo or in colony assays. Our findings extend the repertoire of differentially regulated miRNAs during murine megakaryopoiesis and provide a useful new dataset for hematopoiesis research. In addition, we show that enforced hematopoietic expression of miR-146a has minimal effects on megakaryopoiesis. These results are compatible with prior studies indicating that miR-146a inhibits megakaryocyte production indirectly by suppressing inflammatory cytokine production from innate immune cells, but cast doubt on a different study, which suggests that this miRNA inhibits megakaryopoiesis cell-autonomously.
Introduction
MicroRNAs (miRNAs) are small, noncoding RNAs that inhibit protein expression posttranscriptionally by binding specific target mRNAs via Watson-Crick base pairing to repress translation or induce nucleolytic cleavage (reviewed in1-5 ). MiRNAs are frequently conserved in evolution and play diverse roles in the development and function of many cell types, including hematopoietic tissues. Deregulation of miRNA expression is involved in numerous human diseases, including leukemias and other hematopoietic disorders.6-9
More than 500 human miRNAs have been identified, and roughly 1000 are estimated to exist. Numerous studies have examined the dynamics of miRNA expression during normal hematopoiesis and identified individual miRNAs that promote the development and/or function of specific lineages. For example, activation of miR-45110,11 and repression of miR-15a12 are required for erythropoiesis. MiR-223 regulates granulocyte proliferation and function13 and miR-155 regulates activities of the T-cell receptor.14 MiRNAs are also expressed in megakaryocytes and platelets where they are likely to regulate lineage development and function. Garzon et al showed that differentiation of human CD34+ cells into megakaryocytes is accompanied by down-regulation of numerous miRNAs, likely enhancing protein expression from target mRNAs that encode key megakaryocytic transcription factors.15 MiR-155 is down-regulated during megakaryocytic differentiation and targets mRNAs encoding transcription factors Ets-1 and Meis1, which activate megakaryocyte genes.16 Other miRNAs appear to positively regulate megakaryopoiesis and platelet formation. For example, thrombopoietin induces miR-150, which in turn directs megakaryocyte-erythroid progenitors (MEPs) toward megakaryocytic differentiation, at least in part by repressing expression of transcription factor c-myb.17,18 Mir-34a is reported to enhance megakaryocytic differentiation by repressing several target mRNAs, including c-myb and G1-phase cyclin-dependent kinases.19 In 5q- syndrome, haploinsufficiency of miR-146a and miR-145 stimulates megakaryopoiesis indirectly by activating innate immunity.9 Specifically, these miRNAs target mRNAs encoding Toll-interleukin-1 receptor-domain–containing adaptor protein (TIRAP) and tumor necrosis factor receptor–associated factor-6 (TRAF6), which activate Toll-like receptor (TLR) signaling via nuclear factor κΒ.20,21 This pathway is activated upon reduced dosage of miR-146a and miR-145, thereby stimulating the production of megakaryopoietic cytokines, such as interleukin-6 (IL-6). In addition, numerous miRNAs and their associated regulatory proteins including Dicer and Argonaut 2 are expressed abundantly in platelets, which lack nuclei but contain mRNAs undergoing translation.22 Thus, miRNAs are likely to regulate mature platelet functions both positively and negatively by modulating protein synthesis therein.
These previous studies begin to define how miRNAs regulate platelet production and function. Further investigation in this area should provide new insights into the basic biology of hematopoiesis and pathologic conditions associated with excess bleeding or thrombosis. We sought to define the kinetics of global miRNA expression during the differentiation of murine fetal liver hematopoietic progenitors into megakaryocytes. We utilized this approach for several reasons. First, earlier studies analyzing miRNA expression during normal megakaryopoiesis mainly examined human progenitors.15,17,22 We investigated this process in mice because interspecies comparison could provide useful information on the evolution of miRNA functions. Moreover, changes in megakaryocyte miRNA expression that are conserved between species may reflect biological significance. Murine systems represent an excellent model to study megakaryopoiesis because progenitors are amenable to genetic manipulation both in vivo and in vitro, and relatively pure cultures of murine megakaryocytes can be generated from fetal liver rapidly, within 3-5 days. We used microarrays to interrogate the expression of 435 miRNAs during murine megakaryopoiesis. Our results generally agree with prior human studies and identify new miRNAs that are differentially regulated. In addition, we show that miR-146a is strongly up-regulated during megakaryopoiesis, contrary to previously reported results.23 In bone marrow transplantation studies, overexpression of miR-146a in hematopoietic progenitors produced no detectable changes in megakaryocyte numbers, formation of platelets, or platelet function. Together, our findings extend the repertoire of miRNAs that potentially regulate platelet production, provide a useful dataset for future studies on this topic, and show that miR-146a, believed to inhibit platelet production indirectly by suppressing cytokine production,9 has minimal autonomous effects when overexpressed in hematopoietic cells.
Methods
Tissue culture
Use of animals for this study was approved by the Animal Care and Use Committee at The Children's Hospital of Philadelphia. Pregnant mice (CD-1 strain, 12.5-13.5 day) were obtained from Charles River Laboratory. Fetal livers were isolated from embryos, disrupted into single cell suspension, and purified by centrifugation on Ficoll-Hypaque (GE Healthcare Bio-Sciences). The mononuclear cell (MNC) layer was collected, washed with phosphate-buffered saline (PBS), and incubated with anti-Ter119 antibodies labeled with magnetic beads (Miltenyi Biotec) according to the manufacturer's protocol. The Ter119− cell fraction was collected with an autoMACS magnetic cell sorter (Miltenyi Biotec), and the purity, which was confirmed by flow cytometry, was greater than 90%. Purified Ter119− cells were differentiated into megakaryocytes in StemSpan serum-free expansion medium (SFEM) (StemCell Technologies) in the presence of murine thrombopoietin (Tpo; 50 ng/mL R&D Systems). After 3 days, cells were stained with R-phycoerythrin (PE)–labeled antibodies against CD41 (BD Biosciences) or CD42 (emfret) and analyzed by flow cytometry on a Becton Dickinson FACSCalibur. To assess morphology, cells were analyzed by cytocentrifugation and stained with May-Grunwald-Giemsa.
After 3 days of culture, megakaryocytes were further purified by a discontinuous bovine serum albumin (BSA) gradient (3%, 1.5%, and 0%), and the bottom fraction, containing the largest cells, was used for RNA isolation.24 RNA from mouse Ter119− cells and megakaryocytes was isolated using Trizol reagent (Invitrogen). The quality of RNA was confirmed by molecular weight analysis using an Agilent Bioanalyzer (Agilent Technologies).
MicroRNA array and statistical analysis
Microarray analysis was performed at the University of Pennsylvania Microarray Core Facility using Exiqon miRCURY LNA Arrays v10.0. Total RNA was assayed by Nanodrop spectrophotometry and Agilent Bioanalyzer RNA Pico and Small RNA LabChips; the samples ranged from 1.82 to 1.92 for A260/280 and from 8.9 to 9.9 for Bioanalyzer RNA Integrity Number (RIN) indicating high RNA purity and integrity. Each total RNA sample (0.5 μg per reaction) was labeled with Hy3 and Hy5 dyes using the Exiqon Power Labeling Kit, and automated microarray hybridizations and washes were performed on a Tecan HS4800 station with 20-hour hybridization at 56°C. Dye-swap pairs of 3 replicate experiments comparing Ter119− fetal liver cells versus BSA purified megakaryocytes were cohybridized to 6 arrays. Microarrays were scanned with an Axon GenePix 4000B instrument at 5-μm resolution. The GenePix Pro analysis package was used for local background correction, pixel averaging of each feature, and averaging of replicate array features.
Data processing and statistical analysis were performed using R/BioConductor.25 Raw data were normalized by the Loess method implemented in the Affymetrix software package (R/BioConductor Version 2.7), and the Hy3/Hy5 measurements of the same sample were averaged geometrically to obtain a single measurement of each miRNA in each sample. Differential expression of miRNAs between the sample groups was calculated by the “2 class paired” SAM (significance analysis of microarrays) method implemented in the Samr package. The raw microarray data were submitted to the public database, Gene Expression Omnibus (GEO), accession number GSE22480.
MicroRNA validation
Microarray results were validated for several differentially regulated miRNAs by real-time quantitative polymerase chain reaction (Q-PCR). Q-PCR primers were obtained from Applied Biosystems and used according to the manufacturer's instructions.
PCR for megakaryocyte markers
Two hundred nanograms of RNA was treated with DNAse I (Invitrogen) and in vitro transcribed into cDNA with Superscript III. Primers for Q-PCR were as follows: Pf4: F:caggcagtgaagataaaacg, R:gaggaaatgggtctagggctctt; F8: F:cttttatccaaattcgctcg, R:gtcccagtc ttcctcctcagc; Ppbp: F:cgttgttccctcctggctct, R:ggacgatgtaggtctgagtc; Pdgfa: F:tgggtcccatgccattaacc, R:ctcaatacttctcttcctgcg; GP1ba: F:cagtgagtggagatcctacg, R:cagcctcccatcccagttagat; VWF: F:cagaatccttaccagtgacg, R:gtatggctcagggtccaccag; Mpl: F:cttcagagacacacaaaccg, R:ccttgcacaaatctggtgtcct; Klf1: F:tacaaactttccaggttccg, R:agactcaggcggctcgaact; Fli1: F:catgagccagtccaccagtttg, R:ctcagaatcatggtataaaccg.
MicroRNA-expressing retroviruses
We cloned miR-146a and miR-195 shRNAs into XhoI/EcoRI sites of the retroviral vector MDH26 using the following primers: miR-146a: F:ccgctcgag-catgcccagcatgtttaatg, R:cggaattc-gacgagctgcttcaagttcc (product size 544 bp); miR-195 F: ccgctcgag-gggacaggagacagtggaaa, R: cggaattc-ccacctcgttcctgataacc (product size 377 bp).
Bone marrow transplantation (BMT) studies
Lineage negative (lin−) cells were isolated with Dynabeads (Invitrogen) from donor CD45.2 mice and cultured overnight in serum-free expansion media (StemCell Technologies) with IL-3, 20 ng/mL; IL-6, 20 ng/mL; and stem cell factor (SCF), 100 ng/mL. All cytokines were purchased at R&D Systems. On the next day, cells were collected and spin-infected twice at 3000 rpm for 90 minutes with MDH-GFP retrovirus (miR-146a or miR-195) and then cultured overnight with the same cytokines. On the third day, 106 lin− cells were washed with phosphate-buffered saline and injected into tail veins of lethally irradiated CD45.1 recipients.
Peripheral blood analysis was performed at 2, 4, 9, and 16 weeks after BMT. Platelet-function analysis was performed 9 weeks after BMT. At 16 weeks, mice were killed, bone marrow was flushed out, and spleens were disaggregated into single-cell suspensions. The cells were processed through a 45-μm filter. After erythrocyte lysis (lysis buffer, Sigma-Aldrich), mononuclear cells (MNCs) were stained with various antibodies and analyzed on a FACSCalibur flow cytometer using FlowJo software Version 8.7 (TreeStar). Anti-CD45.2 (allophycocyanin [APC]), Gr-1 (PE), Ter119 (allophycocyanin), CD71 (PE), Mac1 (PE), B220 (PE), and CD3 (PECy7) were from BD Biosciences. Anti- CD42 was from Emfret.
Megakaryocyte colony assays
Bone marrow–derived MNCs were sorted by flow cytometry according to green fluorescent protein (GFP) and c-kit expression. Isolated c-kit+/GFP+ and c-kit+/GFP− cells were plated at 1 × 10⁴ cells/mL in collagen-based semisolid medium (StemCell Technologies) with Tpo (50 ng/mL), IL-6 (10 ng/mL), and IL-3 (10 ng/mL). After 7-8 days, colonies were dehydrated, fixed, and stained according to manufacturer's protocol. Colonies were scored by light microscopy.
Platelet function tests
Platelet activation studies were performed at 9 weeks after BMT. Mice were anesthetized with 16 μg/g body weight tribromoethanol (Sigma-Aldrich), and 100 μL of whole blood was collected by retro-orbital bleeding with a heparinized capillary tube. Platelet-rich plasma was obtained by diluting whole blood 1:2 in Tyrode buffer (137mM NaCl, 1mM MgCl2, 2.7mM KCl, 3.3mM NaH2PO4, 1 g/L BSA, 5.6mM glucose, 20mM HEPES [N-2-hydroxyethylenepiperazine-N′-2-ethanesulfonic acid], pH 7.4) and centrifuging at 100g for 4 minutes. Platelet-rich plasma was diluted to 2.5 × 10⁷ platelets/mL in modified Tyrode buffer (137mM NaCl, 1mM MgCl2, 2.7mM KCl, 3.3mM NaH2PO4, 1 g/L BSA, 5.6mM glucose, 20mM HEPES, pH 7.4), and 2.5 × 10⁶ platelets were stimulated with platelet agonists at low and high concentrations: 2 or 20μM adenosine diphosphate (ADP; Sigma-Aldrich), 1 or 10nM convulxin (Enzo Life Sciences) and 5 or 50μM proteinase-activated receptor 4 (PAR4) peptide AYPGKF (University of Pennsylvania Protein Chemistry Laboratory) for 10 minutes in the presence of 100 μg/mL Alexa-Fluor 647–conjugated fibrinogen (Invitrogen) and 1mM CaCl2 and MgCl2. Fibrinogen binding in GFP+ and GFP− subsets of platelets was measured by flow cytometry on a FACSCalibur analyzer and analyzed using FlowJo software Version 8.7.
Macrophage activation studies
Macrophages were generated from bone marrow cells by culture in macrophage colony stimulating factor, as described.27 After 7-8 days of culture, the cells were scraped off the tissue culture dish and purified on a FACS Aria sorter (Becton Dickinson) into GFP+ and GFP− fractions. Subsequently, cells were plated at a density of 1 × 10⁵/well in 96-well plates in macrophage conditioning media and stimulated for 16 hours with lipopolysaccharide (LPS). Cells were harvested after 24 hours and RNA was isolated with TRIzol. Q-PCR was performed on cDNA, and the expression of pro-inflammatory cytokines was measured with the following primers: TNF alpha: F-cagcctcttctcattcctgcttg, R-aagttcaftagacagaagagcg; IFN beta: F-acgaacattcggaaatgtcagg, R-catagggatcttgaagtccg; and IL-1 beta: F-cagtatcactcattgtggctg, R-gtccacgggaaagacacaggta.
Results
Generation of murine megakaryocytes
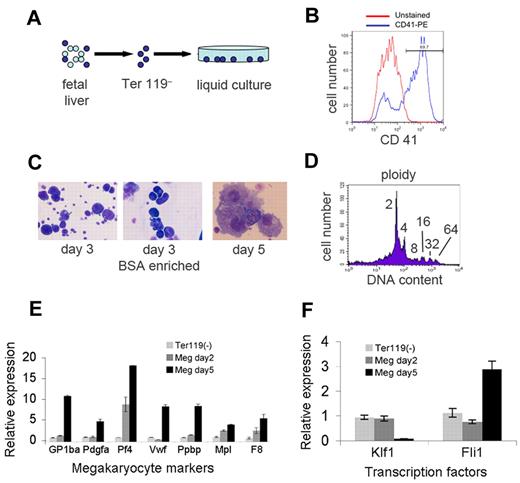
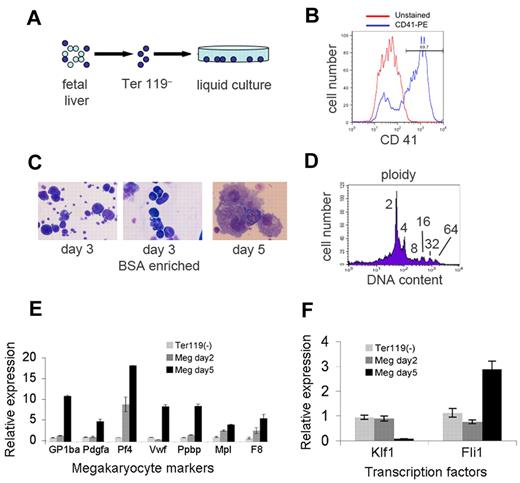
The protocol for generating megakaryocytes from murine fetal liver progenitors is shown in Figure 1 and described in “Methods.” Embryonic day 12.5-13.5 fetal livers were depleted of Ter119+-committed erythroid precursors using immunomagnetic beads (Figure 1A). The Ter119– fraction was cultured in defined serum-free medium with thrombopoietin. After 3-4 days, most cells expressed the megakaryocyte antigen CD41 (Figure 1B) and acquired typical megakaryocyte morphology, including large size, multilobed nuclei and granular cytoplasm (Figure 1C). Cells within the cultures exhibited increased DNA content, reflecting megakaryocyte endoreduplication (Figure 1D) and expressed lineage-specific genes (Figure 1E). Expression of the erythroid transcription factor gene Klf1 decreased, while that of Fli1, encoding a megakaryocyte transcription factor, increased (Figure 1F). Together, these findings confirm that the cultures contained abundant megakaryocytes. For miRNA profiling, we purified the largest, most mature megakaryocytes using a BSA gradient (Figure 1C).
Generation of mouse megakaryocytes. (A) Embryonic day 13.5 fetal liver was disaggregated, depleted of Ter119+-committed erythroblasts by immunomagnetic bead negative selection, and cultured in thrombopoietin for 3-5 days. (B) Surface staining for the megakaryocyte antigen CD41 after 5 days of culture (blue). The red line shows the unstained control. (C) Cytocentrifuge preparations stained with May-Grunwald-Giemsa showing large cells with megakaryocyte morphology. The left panel shows cells after 3 days of culture. The large megkaryocytes were enriched by sedimentation on a discontinuous bovine serum albumin (BSA) gradient (middle panel). The right panel shows megakaryocyte morphology after 5 days of culture. Original magnification of 200× (left and middle panels) and 400× (right panel). Photographs were obtained on a Carl Zeiss Axioskop 2 microscope equipped with a color digital camera (Axiocam, Carl Zeiss). (D) Ploidy, as measured by DNA content on day 3 megakaryocyte cultures. (E-F) Messenger RNA expression in megakaryocyte cultures as measured by quantitative reverse-transcription (Q-RT)–PCR. Values were normalized to Gapdh and are plotted relative to expression levels in the input Ter119– cells at day 0, which are assigned an arbitrary value of 1. Panel E shows induction of marker genes in megakaryocyte (MEG) cultures. Panel F shows down-regulation of Klf1 mRNA–encoding erythroid transcription factor erythroid Krüppel-like factor and induction of Fli1 mRNA, which encodes a megakaryocyte-enriched transcription factor.
Generation of mouse megakaryocytes. (A) Embryonic day 13.5 fetal liver was disaggregated, depleted of Ter119+-committed erythroblasts by immunomagnetic bead negative selection, and cultured in thrombopoietin for 3-5 days. (B) Surface staining for the megakaryocyte antigen CD41 after 5 days of culture (blue). The red line shows the unstained control. (C) Cytocentrifuge preparations stained with May-Grunwald-Giemsa showing large cells with megakaryocyte morphology. The left panel shows cells after 3 days of culture. The large megkaryocytes were enriched by sedimentation on a discontinuous bovine serum albumin (BSA) gradient (middle panel). The right panel shows megakaryocyte morphology after 5 days of culture. Original magnification of 200× (left and middle panels) and 400× (right panel). Photographs were obtained on a Carl Zeiss Axioskop 2 microscope equipped with a color digital camera (Axiocam, Carl Zeiss). (D) Ploidy, as measured by DNA content on day 3 megakaryocyte cultures. (E-F) Messenger RNA expression in megakaryocyte cultures as measured by quantitative reverse-transcription (Q-RT)–PCR. Values were normalized to Gapdh and are plotted relative to expression levels in the input Ter119– cells at day 0, which are assigned an arbitrary value of 1. Panel E shows induction of marker genes in megakaryocyte (MEG) cultures. Panel F shows down-regulation of Klf1 mRNA–encoding erythroid transcription factor erythroid Krüppel-like factor and induction of Fli1 mRNA, which encodes a megakaryocyte-enriched transcription factor.
MicroRNA microarray analysis of murine megakaryopoiesis
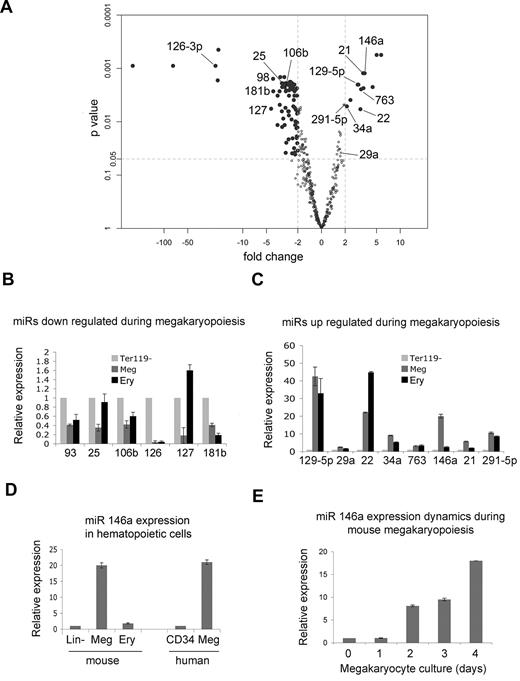
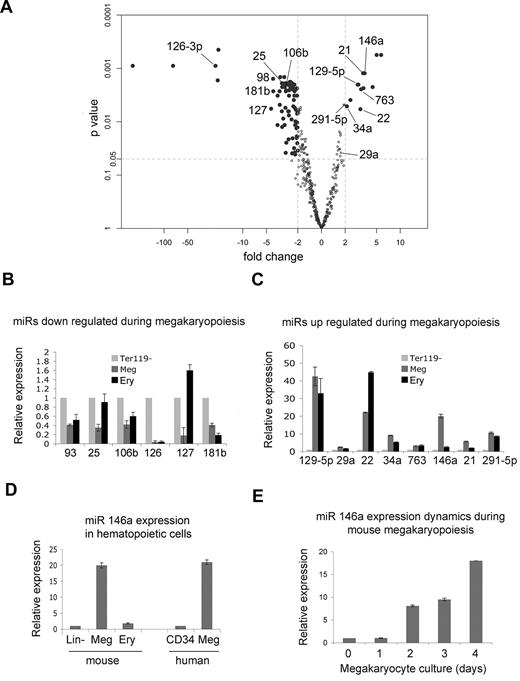
We compared miRNA expression in Ter119– fetal liver cells and BSA gradient–purified megakaryocytes generated after 3 days of culture. Biologic triplicate samples were analyzed using an Exiqon locked nucleic acid (LNA) chip (Version 10.0), which interrogates the expression of 435 mouse miRNAs. The microarray data are deposited at Gene Expression Omnibus, accession no. GSE22480. We identified 94 mouse microRNAs with at least 2-fold altered expression during megakaryocyte maturation and P values less than .05; 13 were up-regulated and 81 down-regulated (Figure 2A; Table 1).
Global changes in microRNA expression during megakaryopoiesis. (A) “Volcano plot” showing differential expression of microRNAs in Ter119– fetal liver hematopoietic progenitors versus megakaryocytes, prepared as described in Figure 1. The x-axis indicates the fold change in megakaryocytes relative to progenitors, and the y-axis is the P value calculated by the paired significance analysis of microarrays method, an alternative to the Student t test.35 Each dot represents 1 microRNA. MiRNAs that were investigated further in validation studies (panels B-E) are indicated by name. MicroRNAs with at least 2-fold change and P value less than .05 are shown as solid black circles and are described further in Table 1. (B) Real-time Q-PCR analyzing expression of selected miRNAs indicated in panel A that are repressed during megakaryopoiesis. MiRNA expression was compared in Ter 119– fetal liver hematopoietic progenitors (assigned a relative value of 1), megakaryocytes generated after 3 days of culture (Meg), and Ter119+ erythroblasts (Ery). MiRNA expression was normalized to U6 snRNA. (C) Q-PCR analysis of selected miRNAs found to be induced during megakaryopoiesis, performed as outlined for panel B. (D) Q-PCR analysis of miR-146a in lineage-depleted hematopoietic progenitors (lin–; assigned a relative value of 1), cultured megakaryocytes (Meg), and Ter119+ erythroblasts. The last 2 bars show miR-146a expression in human CD34+ progenitors (assigned a relative value of 1) and their megakaryocyte (Meg) progeny after 14 days of culture in the presence of thrombopoietin. MiRNA expression in all samples was normalized to U6 snRNA levels. (E) Q-PCR illustrating the kinetics of miR-146a induction in fetal liver megakaryocyte cultures.
Global changes in microRNA expression during megakaryopoiesis. (A) “Volcano plot” showing differential expression of microRNAs in Ter119– fetal liver hematopoietic progenitors versus megakaryocytes, prepared as described in Figure 1. The x-axis indicates the fold change in megakaryocytes relative to progenitors, and the y-axis is the P value calculated by the paired significance analysis of microarrays method, an alternative to the Student t test.35 Each dot represents 1 microRNA. MiRNAs that were investigated further in validation studies (panels B-E) are indicated by name. MicroRNAs with at least 2-fold change and P value less than .05 are shown as solid black circles and are described further in Table 1. (B) Real-time Q-PCR analyzing expression of selected miRNAs indicated in panel A that are repressed during megakaryopoiesis. MiRNA expression was compared in Ter 119– fetal liver hematopoietic progenitors (assigned a relative value of 1), megakaryocytes generated after 3 days of culture (Meg), and Ter119+ erythroblasts (Ery). MiRNA expression was normalized to U6 snRNA. (C) Q-PCR analysis of selected miRNAs found to be induced during megakaryopoiesis, performed as outlined for panel B. (D) Q-PCR analysis of miR-146a in lineage-depleted hematopoietic progenitors (lin–; assigned a relative value of 1), cultured megakaryocytes (Meg), and Ter119+ erythroblasts. The last 2 bars show miR-146a expression in human CD34+ progenitors (assigned a relative value of 1) and their megakaryocyte (Meg) progeny after 14 days of culture in the presence of thrombopoietin. MiRNA expression in all samples was normalized to U6 snRNA levels. (E) Q-PCR illustrating the kinetics of miR-146a induction in fetal liver megakaryocyte cultures.
To validate the array results we performed real-time Q-PCR analysis on selected miRNAs that were up- or down- regulated to the greatest extent and conserved among species (Figure 2B-C). The Q-PCR results were consistent with the microarray findings for all miRNAs analyzed.
We were particularly interested in miRNAs unique to megakaryocyte development and noticed in Q-PCR studies that miR-146a was induced approximately 20-fold in megakaryocytes but not in Ter119+ erythroblasts that derive from a common bipotential MEP (Figure 2). Of note, a previous study indicated that miR-146a is down-regulated during human megakaryopoiesis and that overexpression of this miRNA inhibited megakaryocytic development of human CD34+ cells.23 Because these prior results differ from the current findings, we investigated further the expression of miR-146a by Q-PCR. Compared with lineage-depleted murine fetal liver cells, miR-146a was up-regulated in cultured murine megakaryocytes but not in Ter119+ erythroblasts (Figure 2D). MiR-146a was also up-regulated during human megakaryocyte differentiation from purified CD34+ cells (Figure 2D). In murine fetal liver megakaryocytic differentiation cultures, miR-146a begins to increase at day 2, which coincides with the onset of megakaryocyte differentiation (Figure 2E). In Q-PCR analysis of purified platelet RNA, we noted early amplification of the miR-146a signal with cycle threshold (CT) values of appro-ximately 20-21, but we were unable to normalize levels to U6 ribosomal RNA, which we found to be virtually absent. This finding is consistent with the observation that miR-146a is present at a relatively high level in purified platelets.22 Together, these results indicate that our microarray data accurately reflect miRNA expression and that miR-146a is up-regulated during mouse and human megakaryopoiesis.
Overexpression of miR-146a during in vitro megakaryopoiesis
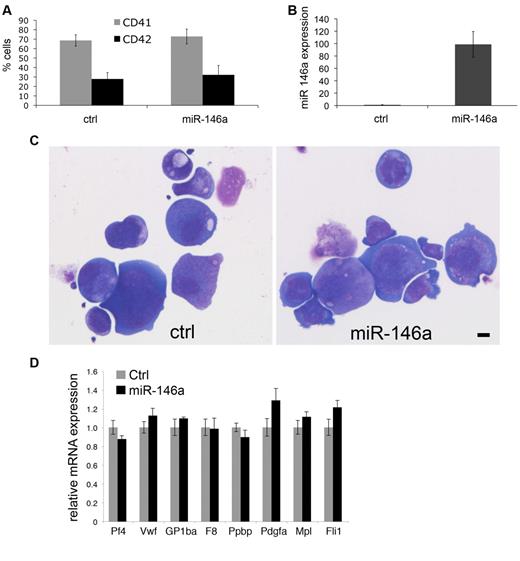
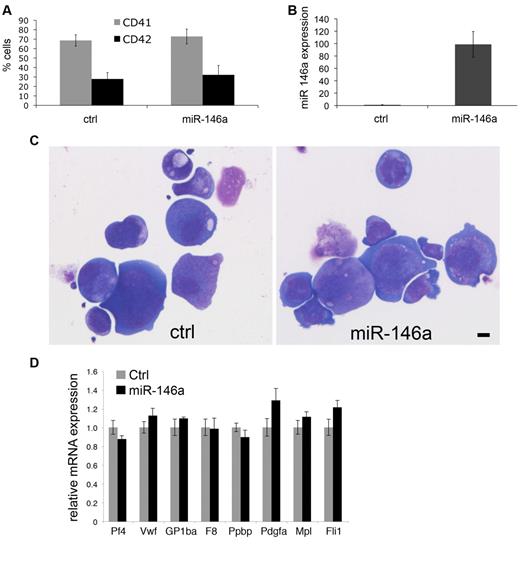
We next investigated whether enforced expression of miR-146a influences murine megakaryocyte differentiation or maturation in culture (Figure 3). We infected fetal liver Ter119– cells with retroviruses encoding miR-146 or empty vector. The vector also encodes genes for puromycin resistance and GFP. The infection rate was approximately 7%-8% for miR-146a virus and approximately 30% for control virus. Megakaryocytes were generated under puromycin selection. At culture day 4, both control and miR-146a–transduced cells similarly expressed megakaryocytic cell surface markers CD41 and CD42 (Figure 3A). Megakaryocytes overexpressing miR-146a by approximately 100-fold (Figure 3B) exhibited normal morphology (Figure 3C) and expression of megakaryocyte marker mRNAs (Figure 3D).
Enforced expression of miR-146a does not affect megakaryopoiesis in vitro. Fetal liver progenitors were infected with MSCV retroviruses encoding miR-146a or empty vector as control, then analyzed after 4 days of culture in thrombopoietin under puromycin selection. (A) CD41 and CD42 expression on cultured megakaryocytes. (B) Relative miR-146a expression analyzed by Q-PCR. (C) Megakaryocyte morphology. Cytospin preparation of megakaryocytes stained with May-Grunwald Giemsa. Scale bar = 10 μm. Photos were taken using a Leica DMLB microscope, Leica DFC420 digital camera, and Leica Application Suite software Version 2.7.1 R1. Original magnification 200×. Lens, Leica NPlan 20×, numerical aperture 0.40. (D) Relative expression of megakaryocyte marker genes determined by real-time RT-PCR. Control cells (transduced with empty vector) are assigned an arbitrary value of 1.
Enforced expression of miR-146a does not affect megakaryopoiesis in vitro. Fetal liver progenitors were infected with MSCV retroviruses encoding miR-146a or empty vector as control, then analyzed after 4 days of culture in thrombopoietin under puromycin selection. (A) CD41 and CD42 expression on cultured megakaryocytes. (B) Relative miR-146a expression analyzed by Q-PCR. (C) Megakaryocyte morphology. Cytospin preparation of megakaryocytes stained with May-Grunwald Giemsa. Scale bar = 10 μm. Photos were taken using a Leica DMLB microscope, Leica DFC420 digital camera, and Leica Application Suite software Version 2.7.1 R1. Original magnification 200×. Lens, Leica NPlan 20×, numerical aperture 0.40. (D) Relative expression of megakaryocyte marker genes determined by real-time RT-PCR. Control cells (transduced with empty vector) are assigned an arbitrary value of 1.
Overexpression of miR-146a during in vivo hematopoiesis
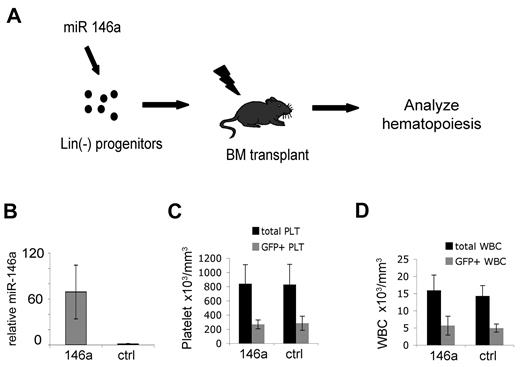
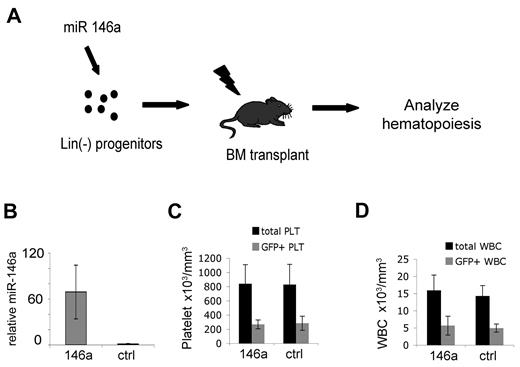
We analyzed whether viral transfer of miR-146a into hematopoietic stem/progenitor cells influences megakaryopoiesis and thrombopoiesis in vivo (Figure 4). Lin– bone marrow cells isolated from donor (CD45.2) mice were transduced with retrovirus coexpressing GFP and either miR-146a or miR-195 as a control (Figure 4A). MiR-195 overexpression is reported to exert minimal or no effect in hematopoietic cells.26 The transduction rate, as deter-mined by GFP expression, was approximately 35%-45%. Virally infected cells were injected intravenously into lethally irradiated congenic CD45.1 hosts. Peripheral blood analysis was performed at 2, 4, 9, and 16 weeks after transplantation.
In vivo–enforced expression of miR-146a in hematopoietic stem/progenitor cells does not alter circulating platelet or white blood cell counts. (A) Experimental approach. Lineage-depleted bone marrow cells were transduced with MDH-GFP retroviruses expressing miR-146a or an irrelevant microRNA (miR-195) as control and transplanted into lethally irradiated recipients. Hematopoietic reconstitution was analyzed 4-16 weeks after transplantation. (B) Q-PCR analysis of miR-146a expression in circulating mononuclear cells at 9 weeks after BMT; n = 5 mice from each group. Error bars represent SD of the mean. The control group was arbitrarily assigned the value 1. P = .0005. (C) Analysis of circulating platelets 9 weeks after bone marrow transplantation. Platelets were stained with anti-CD42 antibody and analyzed for GFP expression. GFP+ platelets were derived from retrovirus-infected donor hematopoietic cells. The GFP– portion of total platelets were derived from noninfected donor cells or residual host cells. Note that miR-146a-overexpressing mice and controls do not differ with respect to total platelet count (P = .43) or the proportion of GFP+ platelets (P = .40). There were n = 5 mice analyzed for each group. Similar results were obtained from the same mice at 4 and 12 weeks after transplantation. (D) Total and GFP+ white blood cells 9 weeks after transplantation, analyzed as described for panel C. White blood cells were identified by forward- and side-scatter analysis of whole blood. Similar results were obtained from the same mice at 4 and 12 weeks after transplantation.
In vivo–enforced expression of miR-146a in hematopoietic stem/progenitor cells does not alter circulating platelet or white blood cell counts. (A) Experimental approach. Lineage-depleted bone marrow cells were transduced with MDH-GFP retroviruses expressing miR-146a or an irrelevant microRNA (miR-195) as control and transplanted into lethally irradiated recipients. Hematopoietic reconstitution was analyzed 4-16 weeks after transplantation. (B) Q-PCR analysis of miR-146a expression in circulating mononuclear cells at 9 weeks after BMT; n = 5 mice from each group. Error bars represent SD of the mean. The control group was arbitrarily assigned the value 1. P = .0005. (C) Analysis of circulating platelets 9 weeks after bone marrow transplantation. Platelets were stained with anti-CD42 antibody and analyzed for GFP expression. GFP+ platelets were derived from retrovirus-infected donor hematopoietic cells. The GFP– portion of total platelets were derived from noninfected donor cells or residual host cells. Note that miR-146a-overexpressing mice and controls do not differ with respect to total platelet count (P = .43) or the proportion of GFP+ platelets (P = .40). There were n = 5 mice analyzed for each group. Similar results were obtained from the same mice at 4 and 12 weeks after transplantation. (D) Total and GFP+ white blood cells 9 weeks after transplantation, analyzed as described for panel C. White blood cells were identified by forward- and side-scatter analysis of whole blood. Similar results were obtained from the same mice at 4 and 12 weeks after transplantation.
By 4 weeks, donor hematopoietic reconstitution, as measured by CD45.2 expression, was approximately 90%. MiR-146a was overexpressed approximately 65-fold in circulating MNCs (Figure 4B). There were no differences in peripheral blood erythrocyte, white blood cell, or platelet levels in miR-146a–overexpressing mice compared with controls (Table 2). The proportion of GFP+ platelets compared with total platelet count, representing contribution from transduced progenitors, was similar in mice transplanted with miR-146a and control virus–transduced hematopoietic progenitors (Figure 4C). Also, for both groups of mice, the fraction of GFP+ cells was similar for circulating GR1+ granulocytes, CD3+ T cells, and B220+ B cells (Figure 3D and not shown). These data indicate that overexpression of miR-146a does not cause ex-pansion, accumulation, or diminution of any circulating blood lineages analyzed.
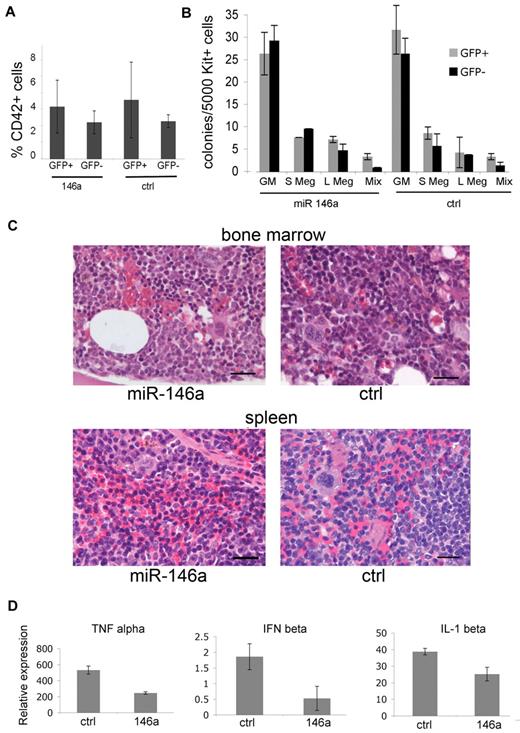
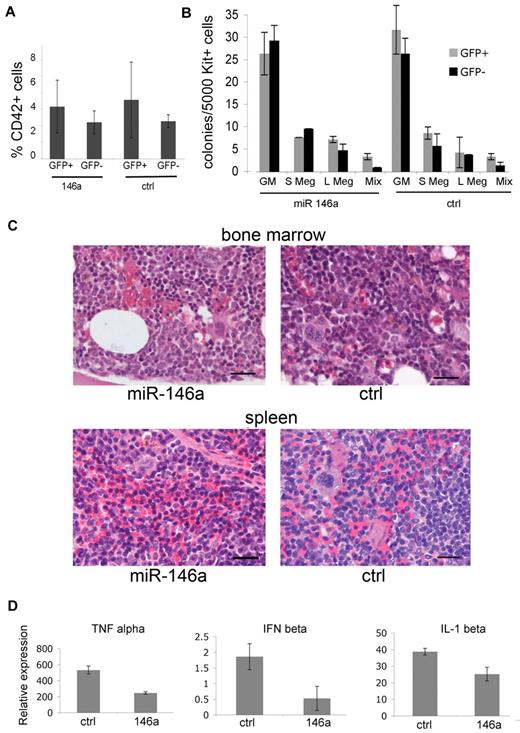
We humanely killed mice at 16 weeks after transplantation to assess the effects of miR-146a overexpression on megakaryopoiesis. MiR-146a–overexpressing megakaryocytes (GFP+/CD42+) were present at normal numbers in the bone marrow relative to megakaryocytes transduced with control miRNA (Figure 5A). We used flow cytometry to isolate c-kit+ megakaryocyte progenitors derived from nontransduced (GFP–) donor hematopoietic cells and those overexpressing miR-146a or control miRNA (GFP+). The purified cells were analyzed in collagen-based hematopoietic colony assays. Overexpression of miR-146a or control miRNA did not alter the sizes or numbers of megakaryocyte or granulocyte-macrophage (GM) colonies (Figure 5B). Megakaryocyte numbers and morphology were identical in histological sections of miR-146a or control miRNA–overexpressing mice (Figure 5C).
Overexpression of functional miR-146 does not alter megakaryopoiesis. (A) Quantification of megakaryocytes in the bone marrow of transplanted mice. Bone marrow suspensions were stained with anti-CD42 and analyzed by flow cytometry. Similar results were obtained from the spleen (data not shown). Differences between GFP+ (P = .12) and GFP− groups (P = .23) were not significant. There were n = 5 mice analyzed from each group at 16 weeks after transplantation. (B) Megakaryocyte colony assays. Bone marrow cells were isolated 16 weeks after transplantation, fractionated by flow cytometry into c-kit+/GFP+ and c-kit+/GFP− subsets representing microRNA virus–infected and –uninfected populations, respectively, and analyzed in hematopoietic colony assays containing Tpo, Il-3, and IL-6. Colonies were enumerated at 7-8 days. Megakaryocytes were identified by staining with acetylthiocholiniodide. GM indicates granulocyte-macrophage; S Meg indicates small megakaryocytic colonies (3-5 cells); L Meg indicates large megakaryocytic colonies (> 5 cells); Mix indicates mixed colonies. There were n = 4 mice analyzed from each group. P > .1 for all groups. (C) Histology of hematopoietic tissues. Bone marrow and spleen from transplanted mice stained with hematoxylin-eosin. Tissue architecture, megakaryocyte numbers, and megakaryocyte morphology were similar in miR-146a–overexpressing and control mice. The mice shown here contained approximately 35% GFP-positive cells in bone marrow and spleen. Five similar pairs of mice were analyzed, and representative results are shown. Scale bars represent 20 μm. (D) Overexpressed miR-146a inhibits innate immune response in cultured macrophage. At 16 weeks transplantation, c-kit+/GFP+ bone marrow cells were purified by flow cytometry and cultured in media containing macrophage colony stimulating factor (M-CSF). After 7-8 days, the cells remained GFP+ and > 90% expressed the macrophage marker Mac1. The cells were stimulated with LPS for 16 hours and 1 day later harvested for RNA extraction. The expression of cytokine-encoding mRNAs Tnf (TNFα), Infb1 (interferon β), and Il1b (IL-1β) were analyzed by Q-RT-PCR. mRNA levels are plotted relative to levels in unstimulated cells, which were assigned an arbitrary value of 1. P values were .0001, .0008, and .0048, respectively. Results indicate triplicate RT-PCR assessments performed in 2 mice from each group.
Overexpression of functional miR-146 does not alter megakaryopoiesis. (A) Quantification of megakaryocytes in the bone marrow of transplanted mice. Bone marrow suspensions were stained with anti-CD42 and analyzed by flow cytometry. Similar results were obtained from the spleen (data not shown). Differences between GFP+ (P = .12) and GFP− groups (P = .23) were not significant. There were n = 5 mice analyzed from each group at 16 weeks after transplantation. (B) Megakaryocyte colony assays. Bone marrow cells were isolated 16 weeks after transplantation, fractionated by flow cytometry into c-kit+/GFP+ and c-kit+/GFP− subsets representing microRNA virus–infected and –uninfected populations, respectively, and analyzed in hematopoietic colony assays containing Tpo, Il-3, and IL-6. Colonies were enumerated at 7-8 days. Megakaryocytes were identified by staining with acetylthiocholiniodide. GM indicates granulocyte-macrophage; S Meg indicates small megakaryocytic colonies (3-5 cells); L Meg indicates large megakaryocytic colonies (> 5 cells); Mix indicates mixed colonies. There were n = 4 mice analyzed from each group. P > .1 for all groups. (C) Histology of hematopoietic tissues. Bone marrow and spleen from transplanted mice stained with hematoxylin-eosin. Tissue architecture, megakaryocyte numbers, and megakaryocyte morphology were similar in miR-146a–overexpressing and control mice. The mice shown here contained approximately 35% GFP-positive cells in bone marrow and spleen. Five similar pairs of mice were analyzed, and representative results are shown. Scale bars represent 20 μm. (D) Overexpressed miR-146a inhibits innate immune response in cultured macrophage. At 16 weeks transplantation, c-kit+/GFP+ bone marrow cells were purified by flow cytometry and cultured in media containing macrophage colony stimulating factor (M-CSF). After 7-8 days, the cells remained GFP+ and > 90% expressed the macrophage marker Mac1. The cells were stimulated with LPS for 16 hours and 1 day later harvested for RNA extraction. The expression of cytokine-encoding mRNAs Tnf (TNFα), Infb1 (interferon β), and Il1b (IL-1β) were analyzed by Q-RT-PCR. mRNA levels are plotted relative to levels in unstimulated cells, which were assigned an arbitrary value of 1. P values were .0001, .0008, and .0048, respectively. Results indicate triplicate RT-PCR assessments performed in 2 mice from each group.
MiR-146a overexpression impairs innate immune response
Given that miR-146a overexpression produced no discernable effects on megakaryocyte or platelet development in vitro or in vivo, we sought to confirm that the virus used for our experiments was expressing functional miRNA. MiR-146a is present in monocytic cells and inhibits innate immune signaling through cytokine and TLRs as part of a negative feedback loop.20,21 Based on these previous studies, we anticipated that miR-146a–overexpressing macrophages should exhibit blunted innate immune responses. GFP+/c-kit+ cells from bone marrow of chimeric mice transplanted with miR-146a or control retrovirus–transduced hematopoietic progenitors were cultured under conditions to promote macrophage formation. By 8 days, > 90% of cells exhibited macrophage morphology and expressed the lineage marker Mac1 (not shown). We stimulated the macrophage with LPS for 16 hours and collected cells for RNA analysis at 24 hours. LPS-induced expression of mRNAs encoding the inflammatory markers interferon β, tumor necrosis factor, and interleukin 1 was blunted in miR-146a–overexpressing macrophage (Figure 5D). These results confirm prior studies on miR-146a actions and verify that the retro-virus used to overexpress this miRNA is functional and biologically active.
MiR-146a expression produces no detectable effects on platelet activation
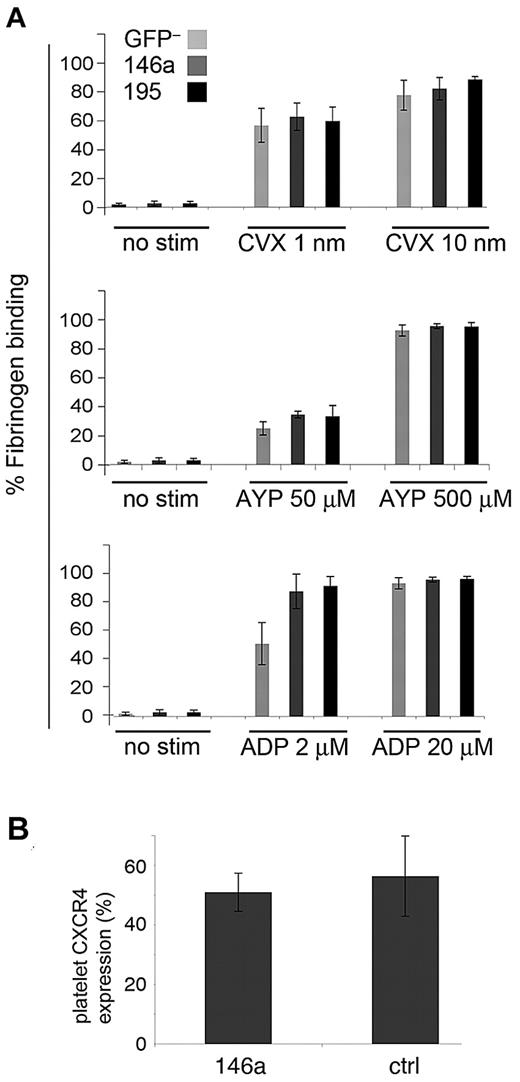
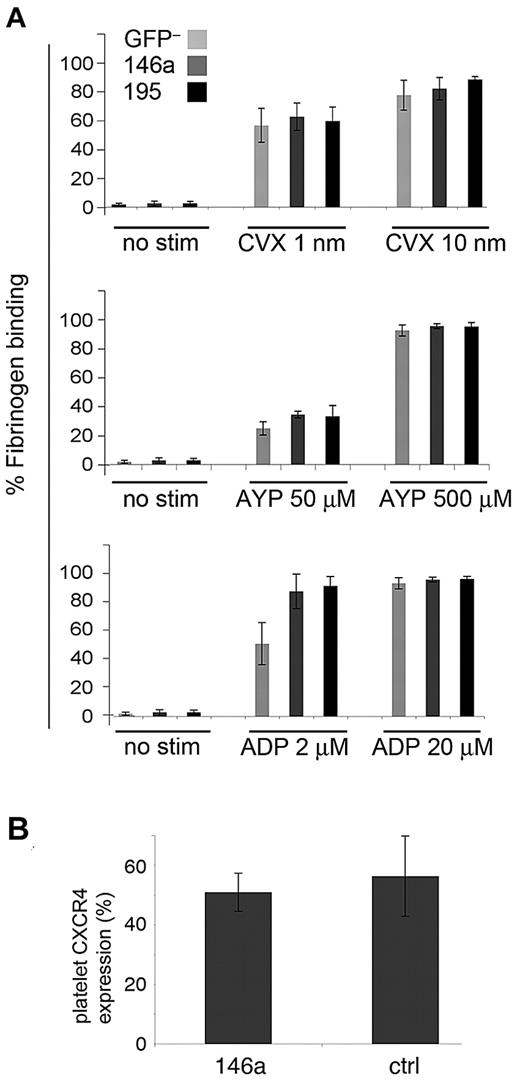
To investigate whether miR-146a overexpression alters platelet function in vivo, we performed platelet activation studies on mice at 9 weeks after BMT (Figure 6A). We used 3 different agonists that activate platelets through distinct receptors and signaling pathways: ADP, convulxin, and AYP-PAR4 peptide. Platelets were treated with agonist, and activation was measured by quantifying binding to fluorescent-labeled fibrinogen. Use of a flow cytometry–based assay allowed us to separately analyze GFP+ platelets, which derive from miRNA-overexpressing progenitors. Overexpression of miR-146a or control miRNA (GFP+ platelets) did not alter platelet activation properties, as determined by fibrinogen binding, compared with GFP– platelets, which derive from nontransduced donor hematopoietic progenitors. The CXCR4 chemokine receptor, reported to be repressed by miR-146a,23 was present at normal levels on platelets overexpressing this miRNA (Figure 6B).
Overexpressed miR-146a does not alter platelet activation. (A) Platelet-rich plasma was prepared from miR-146a–overexpressing and control mice. Binding of GFP+ and GFP– platelets to Alexa 647-fibrinogen was measured by flow cytometry before and after stimulation with low and high doses of agonists ADP, convulxin (CVX), and PAR4 agonist peptide (AYP). No stim indicates unstimulated platelets. (B) Expression of chemokine receptor CXCR4 on control and miR-146a–overexpressing platelets, as measured by flow cytometry.
Overexpressed miR-146a does not alter platelet activation. (A) Platelet-rich plasma was prepared from miR-146a–overexpressing and control mice. Binding of GFP+ and GFP– platelets to Alexa 647-fibrinogen was measured by flow cytometry before and after stimulation with low and high doses of agonists ADP, convulxin (CVX), and PAR4 agonist peptide (AYP). No stim indicates unstimulated platelets. (B) Expression of chemokine receptor CXCR4 on control and miR-146a–overexpressing platelets, as measured by flow cytometry.
Discussion
Prior studies have identified numerous miRNAs that augment or inhibit human megakaryocyte development either positively or negatively, although the full complement of miRNAs that regulate this process is not defined. It should be possible to gain new insights into the evolution and function of miRNAs during megakaryopoiesis through interspecies comparisons. To our knowledge, this is the first study to describe global miRNA expression during mouse megakaryocyte differentiation. In an experiment of somewhat similar design to ours, Garzon et al described miRNA expression during the differentiation of human CD34+ cells into megakaryocytes.15 Of 18 miRNAs reported to be down-regulated in that study, 13 (72%) were also down-regulated in the current study (Table 3). Down-regulation of miRNAs may de-repress expression of megakaryocyte lineage–promoting transcription factors.15 In addition, repression of miR-106, a positive regulator of cell cycle progression,28 may contribute to proliferation arrest during late stage megakaryopoiesis. No miRNAs were reported to be induced during human megakaryopoiesis in the previous study by Garzon et al.15,17 In general agreement, we found that the number of repressed miRNAs greatly exceeds the number of induced ones (13 versus 81; Figure 2A; Table 1), contrasting with the development of most other tissues, including hematopoietic tissues, where miRNAs tend to accumulate during terminal maturation.29 However, we did find several miRNAs to be induced during murine megakaryocyte formation. Of the 13 miRNAs induced more than 2-fold during murine megakaryocytic differentiation (Table 1), 7 are conserved in humans (miRs 21, 146a, 763, 22, 129-5p, 380-3p, and 34a). Among the latter group, 5 were detected in human platelets.22 Several possibilities could explain why these miRNAs were not found by Garzon et al to be up-regulated during human megakaryopoiesis.15 First, most of the miRNAs up-regulated in our study (except for miR-21, miR-146, miR-22, and miR-34) were not present on the earlier-version miRNA chip used for the study of human megakaryopoiesis.15 Second, miR-146 and miR-34, although clearly induced and validated by Q-PCR, produced relatively low signals on our microarray and may have been below the detection threshold in the prior study. Finally, our study compared miRNA expression in cultured murine megakaryocytes to Ter119– fetal liver cells, which are mainly early erythroid progenitors,30 while Garzon et al compared human megakaryocytes to human CD34+ cells, which represent a more diverse and primitive population of hematopoietic progenitors.
Numerous miRNAs induced during megakaryocytic differentiation were also up-regulated during erythropoiesis (Figure 2C). It is possible that these miRNAs facilitate cellular processes that are common to both lineages. For example, miR-22 inhibits cell cycle progression during terminal hematopoietic differentiation by targeting the Max protein to inhibit the Myc-Max transcriptional complex.31 Mir-34a represses expression of transcription factor c-myb and cyclin-dependent kinases during megakaryopoiesis19 and may exert similar effects in erythroid cells. Also, erythroid and megakaryocytic cells share numerous hematopoietic transcription factors including GATA-1, FOG-1 and SCL/TAL1. It is possible that miRNAs induced in both lineages augment the functions of these transcription factors.
We hypothesized that miRNAs specifically up-regulated in megakaryopoiesis may influence lineage determination or platelet functions. MiR-150, which promotes differentiation of MEPs into megakaryocytes,17 was not detected on our microarray. We examined miR-146a for several reasons. This miRNA is highly conserved among species and significantly up-regulated during mouse and human megakaryopoiesis but not erythropoiesis. MiR-146a is relatively abundant in mature platelets.22 This miRNA is also present in lympho-myeloid lineages and inhibits innate immune responses by targeting several cytoplasmic components of TLR signaling in a negative feedback pathway.20,21 In this capacity, miR-146a negatively regulates megakaryopoiesis indirectly by suppressing the production of positively acting cytokines, including IL-6. Through this mechanism, it is believed that haploinsufficiency of miR-146a contributes to the megakaryocyte expansion and thrombocytosis commonly observed in 5q− myelodysplastic syndrome.9 We found that panhematopoietic overexpression of miR-146a in vivo inhibited TLR signaling, consistent with prior studies. However, there were no detectable changes in megakaryocytes, circulating platelet counts, or platelet activation properties by several agonists.
Our results contrast with a previous report that miR-146a is suppressed during human megakaryopoiesis and that overexpression of this miRNA inhibits megakaryocyte proliferation and maturation during in vitro culture of CD34+ cells.23 This might be partially explained by interspecies differences in miR-146a actions because our studies were performed exclusively in a murine system. It is also possible that miR-146a overexpression in hematopoietic tissues exerts different effects in vivo compared with in vitro. In any case, our observation that miR-146a–overexpressing bone marrow cells generate normal numbers of normal-sized megakaryocyte colonies argues strongly against a cell-autonomous effect. Moreover, we found that miR-146a is up-regulated during both mouse and human megakaryocyte differentiation. Further studies are required to better define the role of miR-146a in megakaryocyte development and to resolve the discrepancies between our current study and that of Labbaye et al.23
From our own findings, we derive several conclusions. First, overexpression of miR-146a in lympho-myeloid cells does not inhibit megakaryopoiesis indirectly by suppressing innate immunity, in contrast to the megakaryocyte-enhancing effects of miR-146a haploinsufficiency. Thus, endogenous levels of this miRNA are sufficient to suppress megakaryocyte-stimulating cytokine production, at least under baseline conditions. It is possible that overexpressed miR-146a could suppress megakaryocytosis caused by inflammatory stress. Second, overexpressed miR-146a has minimal cell-autonomous effects on megakaryocyte differentiation, proliferation, or platelet function. This conclusion is supported by analysis of genetically manipulated megakaryocytes and platelets in resident tissues and by in vitro colony assays of megakaryocyte precursors. However, our data do not entirely preclude a cell-intrinsic role for miR-146a in megakaryopoiesis. For example, endogenous levels of miR-146a may be sufficient to achieve biological effects that are not enhanced by retroviral overexpression. This possibility can be investigated further by loss of function studies. It is also possible that miR-146a influences megakaryocyte/platelet development in ways that are not detected by the assays employed here. This is consistent with the current concept that many miRNAs exert subtle effects, often elicited by specific tissue stresses.32-34
The publication costs of this article were defrayed in part by page charge payment. Therefore, and solely to indicate this fact, this article is hereby marked “advertisement” in accordance with 18 USC section 1734.
Acknowledgments
We thank Mark Kahn for providing technical support on platelet activation. We thank Mark Boldin, Alan Gewirtz, and Ramiro Garzon for critical review and helpful suggestions.
This work was funded by a grant from the Roche Foundation for Anemia Research (M.J.W.) and National Institutes of Health training grant T32HL07439-30 (A.A.S.). M.J.W. is a Leukemia & Lymphoma Foundation Scholar.
National Institutes of Health
Authorship
Contribution: J.B.O., A.B., A.A.S., Y.Y., and J.D. designed, performed, and interpreted experiments; Z.Z. analyzed microarray data; J.C. performed pathologic analysis of tissues; M.J.W., and W.T. designed experiments and analyzed data; and J.O. and M.J.W. wrote the manuscript.
Conflict-of-interest disclosure: The authors declare no competing financial interests.
Correspondence: Mitchell J. Weiss, Division of Hematology, Abramson Research Center, 3615 Civic Center Blvd, Rm 316B, Philadelphia, PA 19104; e-mail: weissmi@email.chop.edu.

