Abstract
The molecular target(s) cooperating with proteasome inhibition in multiple myeloma (MM) remain unknown. We therefore measured proliferation in MM cells transfected with 13 984 small interfering RNAs in the absence or presence of increasing concentrations of bortezomib. We identified 37 genes, which when silenced, are not directly cytotoxic but do synergistically potentiate the growth inhibitory effects of bortezomib. To focus on bortezomib sensitizers, genes that also sensitized MM to melphalan were excluded. When suppressed, the strongest bortezomib sensitizers were the proteasome subunits PSMA5, PSMB2, PSMB3, and PSMB7 providing internal validation, but others included BAZ1B, CDK5, CDC42SE2, MDM4, NME7, RAB8B, TFE3, TNFAIP3, TNK1, TOP1, VAMP2, and YY1. The strongest hit CDK5 also featured prominently in pathway analysis of primary screen data. Cyclin-dependent kinase 5 (CDK5) is expressed at high levels in MM and neural tissues with relatively low expression in other organs. Viral shRNA knockdown of CDK5 consistently sensitized 5 genetically variable MM cell lines to proteasome inhibitors (bortezomib and carfilzomib). Small-molecule CDK5 inhibitors were demonstrated to synergize with bortezomib to induce cytotoxicity of primary myeloma cells and myeloma cell lines. CDK5 regulation of proteasome subunit PSMB5 was identified as a probable route to sensitization.
Introduction
Bortezomib is a potent and selective proteasome inhibitor used in the treatment of multiple myeloma (MM) and low-grade lymphoma patients. Bortezomib produces significant clinical responses in both newly diagnosed and advanced MM, but only 40% of patients respond to the single agent,1,2 and the majority of these patients become resistant over time. The mechanism of antimyeloma activity of bortezomib is therefore a subject of intense study with inhibition of the proteasome, autophagy, and activation of the unfolded protein stress response pathway apparently critical. A downstream consequence of proteasome inhibition relevant to MM is blockade of nuclear factor κB (NF-κB) activity, which may partly mediate bortezomib activity in MM because activating mutations in the NF-κB pathway were identified in at least 17% of MM patients and 41% of human myeloma cell lines and appear to mediate accelerated growth and survival of malignant plasma cells.3-5 However, the 35% to 50% response rate to bortezomib cannot be totally interpreted by NF-κB abnormality, suggesting that other specific molecular targets, resistance mechanisms, or perhaps unique pharmacokinetics are inherent in patients. Furthermore, resistance to bortezomib therapy often develops even in initially sensitive patients; and although certain mechanisms such as mutations in proteasome subunits have been postulated,6 the underlying mechanism defining this nonresponsiveness is largely unknown. Understanding the cooperating mechanisms of sensitivity to proteasome inhibition will not only allow more targeted use of proteasome inhibitors but should also make it possible to rationally design synergistic drug combinations and predict patient response to therapy.
To begin to address these issues, a druggable genome RNAi screen was used to identify modifiers of bortezomib sensitivity in human MM cells. Through this high-throughput screen, we identified a panel of genes whose loss of expression enhances bortezomib sensitivity (sensitizer). Using shRNA expression systems and a small-molecule inhibitor, we have further validated one of the most potent bortezomib sensitizer genes as cyclin-dependent kinase 5 (CDK5) in MM cells, highlighting its importance as a potential drug target.
Methods
Cell lines, compounds, siRNA, plasmids, and reagents
Myeloma cell lines and A549 cells were maintained in RPMI 1640 or Dulbecco modified Eagle medium, supplemented with 10% fetal calf serum and antibiotics. The Human Druggable Genome small interfering RNAs (siRNAs) Set V2 and all siRNA oligos for rescreens were purchased from QIAGEN. The CDK5 ON-TARGETplus Smartpool was obtained from Dharmacon RNA Technologies. Lentiviral shRNA clones targeting CDK5 and nontargeting (NT) control lentiviral constructs were from Sigma-Aldrich. Anti-CDK5 antibody was from Cell Signaling Technology and Anti-PSMB5 was from BIOMOL Research Laboratories. Lipofectamine 2000 and RNAiMAX were from Invitrogen. CellTire-Glo assay kit was from Promega. Annexin V apoptosis detection kit was from BD Biosciences. Bortezomib, roscovitine, and SCH727965 were obtained from Mayo Clinic Pharmacy, Sigma-Aldrich, and Schering-Plough, respectively.
siRNA transfection optimization and assay development
Transfection conditions for human myeloma or the A549 lung cancer cell lines were individually optimized using commercially available cationic lipids as described.7 The functional transfection efficiency was determined by comparing viability phenotype after transfecting: (1) a universally lethal positive-control siRNA directed against ubiquitin B (UBBs1) and (2) negative control siRNAs, including a nonsilencing scrambled siRNA or a siRNA directed against green fluorescent protein (GFP). Viability was determined at 96 hours by CellTiter-Glo luminescence. The best transfection conditions were those that produced the least reduction in cell viability with negative controls and greatest reduction with lethal UBBs1 siRNA. Optimized high-efficiency transfection conditions were separately derived for KMS11 and A549 cells (supplemental Figure 1, available on the Blood Web site; see the Supplemental Materials link at the top of the online article).
To study the genes affecting bortezomib or melphalan response, a drug dosage response curve was measured under screening conditions. Briefly, the cells exposed to transfection reagent (mock) and negative control siRNA were studied with and without multiple doses of bortezomib or melphalan. Bortezomib or melphalan was added at 24 hours after transfection and was incubated with cells for 3 days before the cell viability was assayed. The 10% inhibitory concentration (IC10) to IC80 values at 72 hours of exposure time were determined using GraphPad Prism, Version 4 software (supplemental Figure 1). This assay was further performed on our laboratory's robotic platform and proved effective and reproducible with control siRNAs.
High-throughput siRNA screening
siRNAs (2 siRNA oligos per gene) were preprinted on 384-well plates alongside staggered negative and positive control siRNAs. The primary screening experiment was conducted on KMS11 cells in the presence of 0, 1.5nM (IC10), 2nM (IC30), 2.5nM (IC60), and 3nM (IC80) bortezomib. Briefly, the frozen plates preloaded with siRNA thawed at room temperature. A total of 20 μL of diluted Lipofectamine2000 solution was added to each well. After 30 minutes, 1500 cells in 20 μL of medium were added per well and then cultured at 37°C. A total of 10 μL of medium containing bortezomib or vehicle was added after 24 hours, and cell viability was determined at 96 hours (72 hours after bortezomib) by CellTiter-Glo luminescence assay read on an Analyst GT plate reader (Molecular Devices).
Hit selection and secondary screening
The raw luminescence values collected from the primary high-throughput siRNA screens were processed and a curve-fitting method was used for hit selection. Briefly, 5-dose point raw data for each siRNA were generated and normalized to internal reference samples on each plate. After excluding siRNAs that were independently cytotoxic (at dose 0, the cell viability decreased > 50% compared with control), the data from remaining siRNAs were imported for quadratic curve fitting. The 50% effective concentration (EC50) for each siRNA was calculated and compared with the EC50 of controls. The 20% of hits that had most lowered the EC50 compared with control oligos were selected. After further removing hits resulting from screen-related quality errors, 320 bortezomib sensitizer hits (genetic targets, which after knockdown by siRNAs, enhanced cytotoxicity of bortezomib) were selected for secondary screening.
Secondary screens were run twice, retesting both the original 2 siRNA oligos per gene plus 2 additional siRNA oligos for each gene, in the absence or presence of 5 concentrations of bortezomib. Thus, 4 siRNA per gene were screened, in duplicate, with each siRNA tested under 5 different conditions. Genes examined in secondary screening were ranked using curve-fitting and EC50 shift. Bortezomib sensitizer hits were then defined as genes targeted by at least 2 distinct siRNAs that decrease EC50 by 2 SDs from the EC50 of cells treated with control siRNAs. To further verify the modulating activity of each siRNA oligos, Bliss independence8 score (effect size), a statistic model for evaluating drug interaction, was also used to calculate the combination effects of each siRNA, x, and bortezomib concentration, n, using following equation:
E = log2 ((Vx,n/VC,0)/((VC,n/VC,0)*(VX,0/VC,0)))
VX,0 = viability of X siRNA (or X drug) at 0nM bortezomib
VC,n = viability of control siRNA (or vehicle) at any dose of bortezomib
VC,0 = viability of control siRNA (or vehicle) at 0nM of bortezomib
VX,n = viability of X siRNA (or X drug) at any dose of bortezomib
An siRNA whose effect of cell viability is independent from that of bortezomib has E equal to 0. An E less than 0 indicates synergism, a loss of viability from the combination of siRNA and bortezomib that is more than that predicted from the product of effects of the agents acting independently. An E more than 0 indicates loss of viability from the combination of siRNA and bortezomib that is less than that predicted by the product of effects of the agents acting independently.
Screens for selectivity of sensitizing genes
To assess the specificity of identified bortezomib sensitizers from KMS11 myeloma cells, a conventional antimyeloma drug, melphalan and a nonmyeloma cell line, A549, were tested, respectively, with the short-listed siRNAs. Four siRNA oligos against each gene were loaded on 384-well plates. For melphalan, the screen was performed twice on KMS11 cells using the same methods described in “High-throughput siRNA screening” except that titrated doses of melphalan were applied instead of bortezomib at 24 hours after transfection. For A549, a preoptimized transfection condition and bortezomib doses were used in 2 runs (supplemental Data). Hit selection was performed as described in “Hit selection and secondary screening” using curve fitting and calculation of EC50 shift.
MTT assay to measure drug sensitivity after introduction of CDK5 shRNA and dominant negative CDK5 cDNA
We subcloned each CDK5 shRNA expression cassette from the lentiviral constructs (Sigma-Aldrich) into an adenovirus expression vector, as described previously.3 A total of 2 × 10⁸ purified virus particles from control and for each shRNA expression construct was used to infect 1 × 10⁶ myeloma cells. The infection efficiency was measured by FACScan analysis of GFP expression. Cell proliferation assay was set up at 48 hours after infection in the absence or presence of different dose of bortezomib and measured by 3-(4,5-dimethylthiazol-2-yl)-2,5-dimethyltetrazolium bromide (MTT) assay at 72 hours after treatment. Cells were also harvested at 72 hours after infection for Western blot analysis.
For assessment of bortezomib sensitivity after exogenous CDK5 expression, KMS11 cells were infected with lentivirus expressing wild-type human CDK5 (CDK5 wt) and dominant negative CDK5 (D144N, CDK5 dn).9 After selecting infected cells and confirming CDK5 expression by immunoblotting, cell viability with and without bortezomib or other drug treatment for 72 hours was measured by MTT assay.
IPA
To assess possible interactions between sensitizers after bortezomib treatment, the pathway/network analysis was performed using Ingenuity Pathway Analysis (IPA). The genes were overlaid onto a preliminary global molecular network developed from information contained in the Ingenuity Pathways Knowledge Base. All interactions are supported by at least one reference from the literature, from a textbook, or from canonical information stored in the Ingenuity Pathways Knowledge Base. Human, mouse, and rat orthologs of a gene are stored as separate objects in the Ingenuity Pathways Knowledge Base but are represented as a single node in the network. The score obtained from IPA was used to rank networks according to how relevant they are to the genes in the input dataset. The score is based on a P value calculation, which calculates the likelihood that the Network Eligible Molecules that are part of a network are found therein by random chance alone.
Small-molecule CDK5 inhibitor studies
To assess whether the CDK5 inhibitors roscovitine and SCH727965 synergize with bortezomib to induce cytotoxicity of myeloma cells, both myeloma cell lines and primary myeloma cells from patients were tested. For myeloma cell lines, cells were treated with different combination of both drugs for 72 hours, followed by MTT assay. For patient' samples, CD138+ cells were isolated, treated with various dose of drugs for 48 to 72 hours, and induction of apoptosis was assessed using annexin V reagent and 7-amino-actinomycin D or propidium iodide according to the manufacturer's instructions.
Gene expression profile analysis
A series of public and internally generated gene expression datasets were used to interrogate the expression of CDK5 in MM and the effect of knocking down CDK5. In all cases, the gene expression profiles were generated from total RNA labeled using the Affymetrix OneStep IVT labeling procedure and hybridized to the Affymetrix U133Plus2.0 genechip. All labeling, hybridization, washing, and scanning steps were performed following the manufacturer's recommended protocol. To compare the expression of CDK5 between different tissues, we used the following publically available datasets: GSE7307 (normal tissues, curated into neural and other subsets), GSE5900 (normal PC, MGUS), plus the MMRC Reference Collection (SUHRR, MM) and Mayo Clinic Cell Line datasets, which are available on the Myeloma Genomics Portal (www.broadinstitute.org/mmgp/home). Gene expression values were extracted from the raw data files using the MAS5.0 transformation algorithm and the resulting values were log2 transformed for analysis.
To assess the gene expression changes after CDK5 knockdown, 4 samples, including parental KMS11 cells, KMS11 cells transfected, respectively, with NT, CDK5_4, and CDK5_10 siRNAs for 48 hours were harvested and processed for gene expression analysis. The CEL files were processed and normalized by MAPP application with the following default settings (BG Correction: gcrma Normalization: fastlo PM Correction: affinities_only Summarization: medianpolish computeCalls: TRUE). Probe sets with absent call (“A” call) across all samples were removed and pair-wise fold change for each gene in all samples was presented.
Bortezomib rescue using RNA interference resistant CDK5
To assess whether enhanced sensitivity to bortezomib by knockdown of CDK5 could be reversed by overexpression of exogenous CDK5, a wild-type human CDK5 (CDK5 wt) was overexpressed in KMS11 cells. After it was shown that CDK5 siRNAs also knock down exogenous CDK5 efficiently, a mutant CDK5 was prepared. Mutation was based on the sequence of CDK5_4 siRNA where silent mutations were introduced into the correlated sequence of cDNA of CDK5 wt (from AAAGGGCTGGGATTCTGTCATAGC to AAGGGATTAGGTTTTTGCCACTCA). These mutations do not cause amino acid changes in protein, but they are assumed to cause inactivation of siRNA because of changes in DNA sequence. The nucleotide containing these mutations was inserted to substitute the original sequence in cDNA of wild-type CDK5, and the final construct was confirmed by DNA sequencing. The lentiviruses from both wild-type and mutated CDK5 expression constructs were used to infect KMS11 cells. Infection efficiency was analyzed by FACScan analysis of GFP expression at day 3 after infection. Cells were subsequently transfected with NT and CDK5_4 siRNA. At 24 hours after transfection, cells were treated with different dose of bortezomib and cell viability was assessed after 72 hours of treatment.
Results
Identification of bortezomib response modulating genes from high-throughput RNAi screening
Primary screening was performed by reverse transfecting KMS11 human MM cells with 13 984 synthetic siRNA against each of 6992 druggable targets (one siRNA per well) using conditions that resulted in 90% successful transfection and less than 5% background cytotoxicity, measured 96 hours after infection. Figure 1 illustrates a heat map of the raw data from all 276 384-well plates in the primary screen and demonstrates the successful titration of cytotoxic response to increasing doses of bortezomib. The first column in each plate was left untreated, serving as a reference to evaluate plate-to-plate variation in the screen. The positive control for transfection is a UBB siRNA that is universally lethal and was represented on each plate to monitor transfection efficiency as a positive control for transfection. The resulting data from primary screening were evaluated for multiple quality control metrics and found to exceed all expected performance parameters with more than 90% global transfection efficiency, less than 0.25 coefficient of variation values across the dataset with minimal plate-to-plate and set-to-set variation observed.
Druggable genome siRNA screen to identify genes that affect bortezomib sensitivity. (A) Heat map of raw data of all 384-well plates in primary HTS. KMS11 cells were reversely transfected with 2 siRNAs per gene from druggable genome siRNA library alongside staggered negative and positive control siRNAs. After 24-hour transfection, various doses of bortezomib were added and cell viability was determined at 96 hours (72 hours after bortezomib) by CellTiter-Glo luminescence assay read. The collected data were imported to generate this heat map to overview screen results and to evaluate screen quality. (B) The representative curve-fitting result from secondary screening. Dose-response curves fitted to the data of siRNAs from 2 groups. Red represents control siRNAs + bortezomib; and gray one siRNA + bortezomib. (C) Histogram of EC50 values derived from the dose-response curves of all siRNAs from secondary screen. Black, blue, and red lines indicate 1, 2, and 3 SDs from the control mean, respectively.
Druggable genome siRNA screen to identify genes that affect bortezomib sensitivity. (A) Heat map of raw data of all 384-well plates in primary HTS. KMS11 cells were reversely transfected with 2 siRNAs per gene from druggable genome siRNA library alongside staggered negative and positive control siRNAs. After 24-hour transfection, various doses of bortezomib were added and cell viability was determined at 96 hours (72 hours after bortezomib) by CellTiter-Glo luminescence assay read. The collected data were imported to generate this heat map to overview screen results and to evaluate screen quality. (B) The representative curve-fitting result from secondary screening. Dose-response curves fitted to the data of siRNAs from 2 groups. Red represents control siRNAs + bortezomib; and gray one siRNA + bortezomib. (C) Histogram of EC50 values derived from the dose-response curves of all siRNAs from secondary screen. Black, blue, and red lines indicate 1, 2, and 3 SDs from the control mean, respectively.
Curve-fitting and EC50 ranking methods were used for hit selection, whereas siRNAs that were independently cytotoxic (> 50% lethality in the absence of drug) were excluded from subsequent analysis. To eliminate weak and false positive sensitizer hits from further validation, only the strongest hits were selected for secondary screening. Secondary screening was performed with both the 2 original and 2 newly designed siRNA oligos (4 siRNAs per gene) against each of primary screen identified genetic targets in the presence of bortezomib. The representative curve-fitting results and EC50 histogram of all siRNAs in the secondary screen are shown in Figure 1B and C. The sensitizers were defined thereafter as genes targeted by at least 2 of the 4 distinct siRNA species that decrease EC50 by at least 2 SDs from cells treated with control siRNAs. Using these criteria, and by further cross-referencing gene expression profile data of KMS11 for plausible expression of the intended target, 37 genes were identified as not directly cytotoxic, most sensitizing to bortezomib and plausibly expressed (Table 1). The modulating activity of each siRNA oligo against the genes on this list was also then verified by Bliss independence score (supplemental Data).
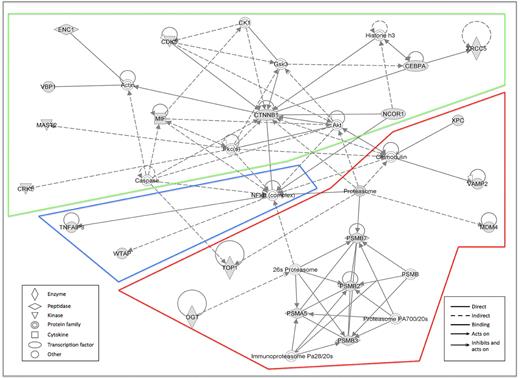
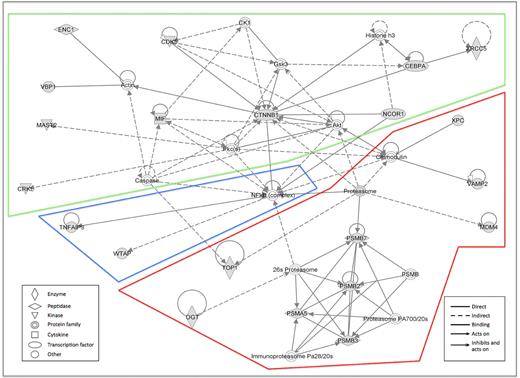
To assess possible interactions between these 37 sensitizers, pathway/network analysis was again performed using IPA. The network with the highest score included 22 of 37 genes and was mostly centered on the NF-κB/proteasome complex and the CDK5/β-catenin/Akt pathway (Figure 2). Two other networks were generated; but with significantly lower significance than network 1, they were centered on (1) histones and ERK or (2) TP53 and KRAS, respectively (data not shown).
Networks generated from the analysis of identified sensitizers using IPA. The network with the highest score was mostly centered on the NF-κB/proteasome complex and the CDK5/β-catenin/Akt pathway, including 22 of 37 genes under analysis. Gray represents the queried genes.
Networks generated from the analysis of identified sensitizers using IPA. The network with the highest score was mostly centered on the NF-κB/proteasome complex and the CDK5/β-catenin/Akt pathway, including 22 of 37 genes under analysis. Gray represents the queried genes.
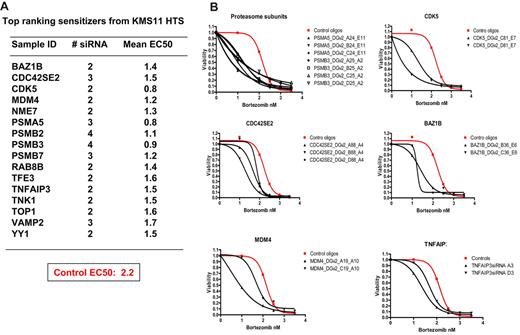
Figure 3A displays the top 15 ranking bortezomib sensitizers after RNAi target suppression in myeloma cells (0.02% of genes studied), including the proteasome subunits PSMA5, PSMB2, PSMB3, and PSMB7, providing internal validation for the screen and hit selection process. Note that other proteasome subunits were often directly cytotoxic and were thus excluded from sensitizing analysis (supplemental Figure 2). Twelve other genes were also identified as strong sensitizers and included BAZ1B, CDK5, CDC42SE2, MDM4, NME7, RAB8B, TFE3, TNFAIP3, TNK1, TOP1, VAMP2, and YY1. Compared with NT control oligos, silencing the genes on this list caused a substantial shift of the dose-responsive curves as a result of reduction of EC50 (Figure 3B). Note that only genes that were silenced (ie, successful transfection and knockdown occurred under screening conditions) and not directly cytotoxic could be included and that false negatives are highly probable; thus, the list of sensitizers is not comprehensive.
Top ranking bortezomib sensitizers identified from druggable genome screens. (A) A list of the strongest sensitizer hits, which were defined as genes targeted by at least 2 distinct siRNA species that decrease EC50 by 3 SDs from cells treated with control siRNAs. (B) Dose-response curves fitted to the data of 6 top ranking hits in rescreen.
Top ranking bortezomib sensitizers identified from druggable genome screens. (A) A list of the strongest sensitizer hits, which were defined as genes targeted by at least 2 distinct siRNA species that decrease EC50 by 3 SDs from cells treated with control siRNAs. (B) Dose-response curves fitted to the data of 6 top ranking hits in rescreen.
Selectivity of the sensitizer hits identified from myeloma cells
To examine whether the sensitizers identified from KMS11 screening are bortezomib specific or myeloma cell line specific, we then performed screens in KMS11 cells in the presence of melphalan as well as in a nonmyeloma lung cancer cell line, A549, in the presence of bortezomib. For each cell line, screens were run twice with 4 siRNA oligos against each of the 37 identified bortezomib sensitizers from KMS11. As shown in supplemental Table 1, 2 runs in KMS11 with melphalan only reproducibly identified 3 hits to enhance melphalan-induced cytotoxicity, including CEBPA, CHD4, and MIF. However, 2 runs in A549 with bortezomib demonstrated that 50% of the sensitizer hits identified from KMS11 cells also function as bortezomib sensitizers in this lung cancer cell line (supplemental Table 1). These results suggest that most of the bortezomib sensitizers identified from KMS11 screen are probably specific to bortezomib, but many of the identified gene targets are not myeloma specific; thus, our results are probably relevant to other bortezomib sensitive malignancies.
CDK5 silencing sensitizes myeloma cells to proteasome inhibitors
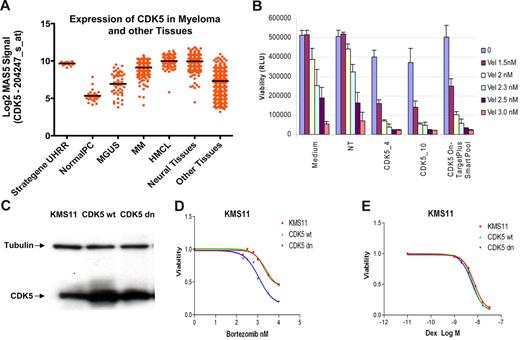
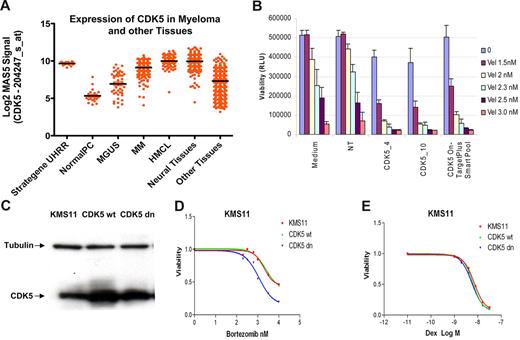
Of the top ranking bortezomib modulators, CDK5 was identified as the most potent sensitizer hit in addition to proteasome subunits (Figure 3; supplemental Figure 2). Analysis of gene expression profile indicated that myeloma cells have a high-level CDK5 expression that is similar to neuronal tissues but much higher than somatic tissue, indicating the potential for a high therapeutic index (Figure 4A). The required CDK5 activator CDK5R1/P35 was also expressed in more than 50% of human myeloma cell lines (data not shown). In our primary screens, 2 distinct CDK5 siRNAs were shown to enhance the sensitivity of myeloma cells to bortezomib. In the same screen, other members of the CDK family (CDKs), including CDK1–4, 7, 9, 10, and CDKL1–3, 5 were shown to have effects on bortezomib response below our cut-off for successful sensitization, suggesting that this is not a class effect for cyclin-dependent kinases or a nonspecific block on proliferation (supplemental Figure 3). CDK5R2 (p39), which is a specific activator of CDK5, was directly lethal in this DG2 primary screen and therefore not considered in sensitization analysis. This is consistent with our prior work in which CDK5R2 was identified as a vulnerable kinase target.
Validation of CDK5 as a sensitizer hit. (A) CDK5 expression in myeloma cells. The expression of CDK5 on the Affymetrix U133A chip across the different samples in MMRC database is represented. The samples are grouped according to their diagnosis. (B) Confirming sensitizing activity using multiple CDK5 siRNAs. Control siRNA, CDK5_4, CDK5_10, and CDK5 On-TargetPlus smart pool were loaded on a 384-well plate at the final concentration of 13nM. After adding lipofectamine 2000 and KMS11 cells, the plate was incubated at 37°C for 24 hours. The vehicle and bortezomib at the indicated doses were added. The cell viability was determined at 96 hours by CellTitre-Glo luminescence. The data at each point represent the mean values of 6 wells (mean ± SD). (C-E) CDK5 kinase activity is required for bortezomib sensitization. KMS11 cell were infected with lentiviruses expressing either wild-type CDK5 or “kinase dead” dominant negative CDK5. The expression of exogenous both CDK5 proteins (C) and cell responses to bortezomib and dexamethasone were assessed and presented (D-E).
Validation of CDK5 as a sensitizer hit. (A) CDK5 expression in myeloma cells. The expression of CDK5 on the Affymetrix U133A chip across the different samples in MMRC database is represented. The samples are grouped according to their diagnosis. (B) Confirming sensitizing activity using multiple CDK5 siRNAs. Control siRNA, CDK5_4, CDK5_10, and CDK5 On-TargetPlus smart pool were loaded on a 384-well plate at the final concentration of 13nM. After adding lipofectamine 2000 and KMS11 cells, the plate was incubated at 37°C for 24 hours. The vehicle and bortezomib at the indicated doses were added. The cell viability was determined at 96 hours by CellTitre-Glo luminescence. The data at each point represent the mean values of 6 wells (mean ± SD). (C-E) CDK5 kinase activity is required for bortezomib sensitization. KMS11 cell were infected with lentiviruses expressing either wild-type CDK5 or “kinase dead” dominant negative CDK5. The expression of exogenous both CDK5 proteins (C) and cell responses to bortezomib and dexamethasone were assessed and presented (D-E).
To further validate our high-throughput result and exclude activities from off-target effects, a CDK5 ONTARGETplus smart pool was obtained. As shown in Figure 4B, this CDK5 siRNA smart pool also significantly enhanced sensitivity of KMS11 to bortezomib. To exclude an off-target effect of all the siRNA used a wild-type and a dominant-negative, kinase-dead D145N CDK5 mutants were overexpressed in KMS11 cells (Figure 4C), followed by viability assay in the presence of various doses of bortezomib. As shown in Figure 4D, expression of dominant-negative CDK5 rather than wild-type CDK5 sensitized cells to bortezomib, confirming our earlier findings were on target and also suggesting CDK5 kinase activity is involved in modulating bortezomib sensitivity. In the same experiment, expression of either wild-type or dominant-negative CDK5 did not affect dexamethasone sensitivity, confirming specificity (Figure 4E).
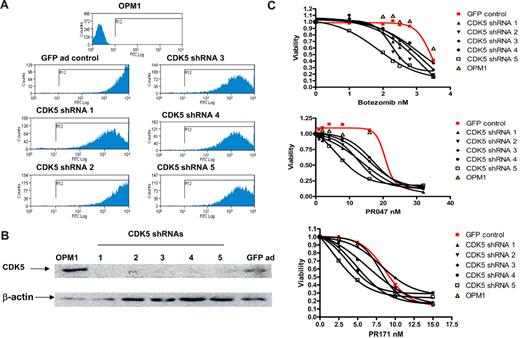
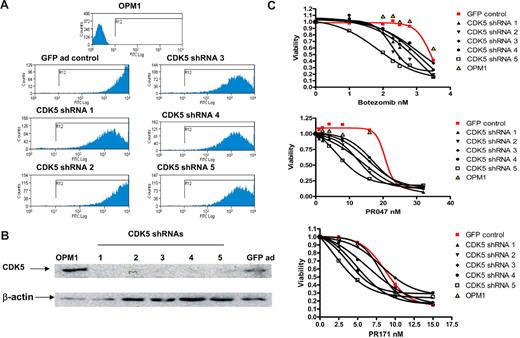
To examine the portability of the effects observed in high throughout screening and validate the effects of knockdown CDK5 in different myeloma cell lines (thus addressing the difficulties in generalizing findings from a single-cell line), 5 distinct CDK5 shRNA lentiviral expression constructs were next obtained. Because infection efficiencies by lentivirus were found to be relatively low in many of the MM cell lines, we subsequently subcloned each of the CDK5 shRNA expression cassettes into an adenoviral expression system. The adenoviruses generated from those constructs have a modified capsid protein, carry GFP expression sequences, and were shown to infect most MM cell lines with high infection efficiency. For example, as shown in Figure 5A, more than 90% of OPM1 cells became GFP+ at 48 hours after infection. At 72 hours after infection, knockdown of endogenous CDK5 was detected by Western blotting from the cells infected by all CDK5 shRNA-expressing adenoviruses compared with empty vector controls (Figure 5B). Consistent with the previous observation, silencing of CDK5 after adenoviral infection enhances the sensitivity of all tested MM cell lines to bortezomib. Furthermore, we demonstrated that the sensitization effect is also retained when the alternate proteasome inhibitors (PR047 and PR171, carfilzomib) were used (Figure 5C).
Sensitization to proteasome inhibitors after introducing CDK5 shRNAs in OPM1 cells. OPM1 cells were infected with control virus and 5 different CDK5 shRNA-expressing viruses. At day 2 and day 3 after infection, expression of GFP was detected by FACScan analysis and expression of CDK5 was assayed by Western blot (A-B). MTT assay was set for each shRNA-infected cell sample at day 3 after transfection. Three proteasome inhibitors were added at the indicated concentration. Cell viability was measured at day 3 after exposure, and the dose-responsive curve was made for each control and CDK5 shRNA-infected cells (C).
Sensitization to proteasome inhibitors after introducing CDK5 shRNAs in OPM1 cells. OPM1 cells were infected with control virus and 5 different CDK5 shRNA-expressing viruses. At day 2 and day 3 after infection, expression of GFP was detected by FACScan analysis and expression of CDK5 was assayed by Western blot (A-B). MTT assay was set for each shRNA-infected cell sample at day 3 after transfection. Three proteasome inhibitors were added at the indicated concentration. Cell viability was measured at day 3 after exposure, and the dose-responsive curve was made for each control and CDK5 shRNA-infected cells (C).
Five genetically diverse human MM cell lines were studied. In addition to KMS11 and OPM1, an enhanced sensitivity to bortezomib by silencing CDK5 was also found in 8226, JJN3, and U266 (supplemental Figure 4).
CDK5 small-molecule inhibitors synergize with bortezomib to induce cytotoxicity of myeloma cells
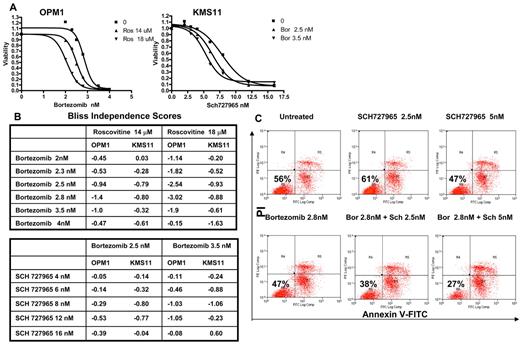
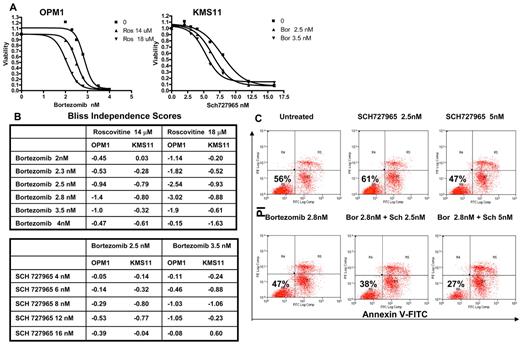
In our hands, reproducible siRNA transfection of primary patient-derived MM cells for analysis proved unreliable either by oligo- or viral-based approaches. Therefore, to further investigate CDK5 as a modulator of bortezomib sensitivity and to validate it as a therapeutic target, we next studied the effect of small-molecule CDK5 inhibitors in combination with bortezomib on primary myeloma cell growth. SCH727965 is a potent CDK5 inhibitor but also inhibits CDK1, CDK2, and CDK9. Roscovitine is another well-known CDK5 inhibitor10-12 but also inhibits a number of other CDKs, including CDK1, CDK2, CDK7, and CDK9. Nevertheless, introduction of siRNAs against CDK1, 2, 7, and 9 did not change bortezomib sensitivity in our screen (supplemental Figure 3) and a combination of the potent, selective CDK2, 7, and 9 inhibitor, SNS032, with bortezomib did not display any synergism in MM cell lines in vitro (data not shown). We conclude that any detected synergism between either of these 2 drugs and bortezomib was most reflective of inhibition of CDK5. As shown in Figure 6A and B, both roscovitine and SCH727965 demonstrated a synergetic effect with bortezomib to induce cytotoxicity in OPM1 and KMS11.
Effects of combination of CDK5 inhibitor roscovitine, SCH727965, and bortezomib on myeloma cells. (A) KMS11 and OPM1 cells were seeded in 96-well plates and incubated with roscovitine (Ros), SCH727965, and bortezomib alone and either of both drugs in combination with bortezomib at the indicated concentrations. After 72-hour incubation, cell viability was determined using MTT assay and the dose-response curves were generated. (B) Bliss independence score for each combination of 2 compounds on both cell lines was calculated to verify the synergistic, independent, and antagonistic cytotoxic effects at a broad range of concentrations. Negative value suggests synergism between 2 compounds. (C) The bone marrow from myeloma patients was collected, and CD138+ cells were isolated and cultured with vehicle, bortezomib (Bor), SCH727965 (Sch) alone, and 2 drugs (Sch + Bor) together for 72 hours. The cells were then harvested and stained with annexin V-fluorescein isothiocyanate and propidium iodide, followed by FACScan analysis.
Effects of combination of CDK5 inhibitor roscovitine, SCH727965, and bortezomib on myeloma cells. (A) KMS11 and OPM1 cells were seeded in 96-well plates and incubated with roscovitine (Ros), SCH727965, and bortezomib alone and either of both drugs in combination with bortezomib at the indicated concentrations. After 72-hour incubation, cell viability was determined using MTT assay and the dose-response curves were generated. (B) Bliss independence score for each combination of 2 compounds on both cell lines was calculated to verify the synergistic, independent, and antagonistic cytotoxic effects at a broad range of concentrations. Negative value suggests synergism between 2 compounds. (C) The bone marrow from myeloma patients was collected, and CD138+ cells were isolated and cultured with vehicle, bortezomib (Bor), SCH727965 (Sch) alone, and 2 drugs (Sch + Bor) together for 72 hours. The cells were then harvested and stained with annexin V-fluorescein isothiocyanate and propidium iodide, followed by FACScan analysis.
We next examined the combination effects of bortezomib and SCH727965 or roscovitine on primary myeloma cells in vitro. In this study, bone marrow from myeloma patients was collected and CD138+ cells were isolated and cultured with vehicle, each drug alone and 2 drugs (kinase inhibitor and bortezomib) together for 48 or 72 hours. The cells were then harvested and stained with annexin V-fluorescein isothiocyanate and 7-amino-actinomycin D or propidium iodide, followed by FACScan analysis. As shown in Figure 6C and supplemental Table 2, samples treated with bortezomib and SCH727965 or roscovitine were demonstrated to have synergistic effect in inducing myeloma cell apoptosis.
Mechanism of modulation of bortezomib sensitivity by CDK5
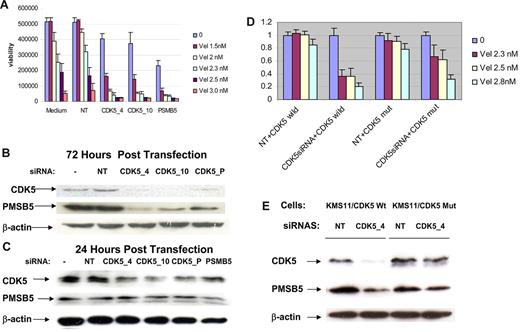
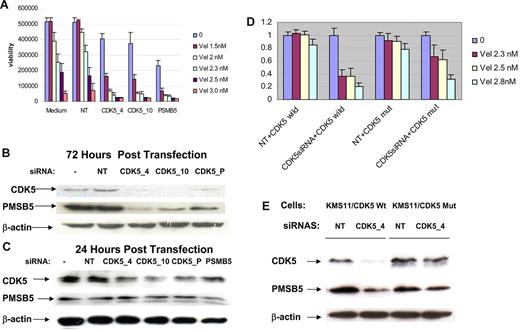
To better understand the mechanism by which CDK5 knockdown sensitizes MM cells to proteasome inhibitors, we conducted gene expression analysis of KMS11 cells transfected with 2 distinct CDK5 siRNAs for 48 hours. As expected, and confirming an on target effect, the gene most affected by the siRNAs was CDK5 itself. Other genes down-regulated at least 2-fold in both of the CDK5 siRNA-transfected cell lines are listed in Table 2. One notable gene secondarily down-regulated in KMS11 cells was the proteasome subunit PSMB5. PSMB5 is a key proteasome subunit influencing bortezomib sensitivity. Overexpression of wild-type or mutant PSMB5 was demonstrated as an important mechanism for bortezomib resistance in both myeloma cells and Jurkat cell lines.6,13,14 Therefore, this seemed a probable candidate to explain proteasome inhibitor sensitization after CDK5 silencing. PSMB5 expression decreased 3-fold in gene expression analysis of both of the cell lines 48 hours after CDK5 siRNA transfection. To validate these data and demonstrate that down-regulation of PMSB5 was a route to enhance the sensitivity to bortezomib, further experiments were performed. As shown in Figure 7A, as with CDK5 siRNAs, transduction of a validated PMSB5 siRNA into KMS11 cells also resulted in an increased sensitivity to bortezomib; but unlike CDK5 silencing, knockdown of PMSB5 directly induced more cytotoxicity. Immunoblotting indicated that, compared with control cells, PMSB5 protein levels decreased substantially in all samples transfected with different CDK5 siRNA species for 72 hours (Figure 7B). At 24 hours after transfection (Figure 7C), only CDK5 was down-regulated, demonstrating that reduction of CDK5 occurred before down-regulation of PMSB5. To further demonstrate that CDK5 knockdown was responsible for down-regulation of PMSB5, and the bortezomib sensitizing effect, a rescue experiment was performed by constructing and overexpressing a mutant CDK5, which is RNAi resistant. As shown in Figure 7D, compared with the cells overexpressing wild-type CDK5, the mutant CDK5 overexpressed cells became more resistant to bortezomib after introducing CDK5 siRNA, although the RNAi resistant mutant is not able to completely restore resistance to the effects of CDK5 knockdown. PMSB5 was less down-regulated by CDK5 siRNA in mutant CDK5-expressing cells than in wild-type CDK5-overexpressing cells (7E).
PMSB5 as a possible mediator to enhance bortezomib sensitivity after CDK5 silencing. (A) Viability assay was performed with a validated PMSB5 siRNA and 2 CDK5 siRNAs transfected-KMS11 cells in the presence of various doses of bortezomib. (B) Immunoblotting analysis confirmed that PMSB5 protein level decreased substantially at 72 hours after transfection of KMS11 cells with different CDK5 siRNA species. (C) At 24 hours after transfection, only CDK5 expression was down-regulated. (D) Overexpression of an siRNA-resistant CDK5 mutant in KMS11 cells impaired cdk5 siRNA-induced bortezomib sensitization. KMS11 cells were infected with the lentiviruses expressing either wild-type or mutated CDK5. After confirming expression of exogenous CDK5, both infected cells were subsequently transfected with NT and CDK5_4 siRNA. At 24 hours after transfection, cells were treated with various doses of bortezomib, and cell viability was assessed after 72 hours of treatment. The data at each point represent the mean values of 6 wells (mean ± SD). (E) Western blot analysis of CDK5 and PSMB5 expression in KMS11 cells that overexpress wild-type CDK5 and mutant CDK5 at day 3 after introduction of control oligos (NT) and CDK5_4 siRNA.
PMSB5 as a possible mediator to enhance bortezomib sensitivity after CDK5 silencing. (A) Viability assay was performed with a validated PMSB5 siRNA and 2 CDK5 siRNAs transfected-KMS11 cells in the presence of various doses of bortezomib. (B) Immunoblotting analysis confirmed that PMSB5 protein level decreased substantially at 72 hours after transfection of KMS11 cells with different CDK5 siRNA species. (C) At 24 hours after transfection, only CDK5 expression was down-regulated. (D) Overexpression of an siRNA-resistant CDK5 mutant in KMS11 cells impaired cdk5 siRNA-induced bortezomib sensitization. KMS11 cells were infected with the lentiviruses expressing either wild-type or mutated CDK5. After confirming expression of exogenous CDK5, both infected cells were subsequently transfected with NT and CDK5_4 siRNA. At 24 hours after transfection, cells were treated with various doses of bortezomib, and cell viability was assessed after 72 hours of treatment. The data at each point represent the mean values of 6 wells (mean ± SD). (E) Western blot analysis of CDK5 and PSMB5 expression in KMS11 cells that overexpress wild-type CDK5 and mutant CDK5 at day 3 after introduction of control oligos (NT) and CDK5_4 siRNA.
Discussion
Using high-throughput RNAi screens of human myeloma cells, we identified a panel of genes whose suppression enhanced bortezomib sensitivity. Here we report on the top 37 of these bortezomib sensitizers. In interpreting this screen, we accepted the limitations of extrapolating from a large primary screen in a single-cell line and tried to offset this by exploring lead hits in multiple lines and primary samples where possible. We also acknowledged the likelihood of a false-negative rate resulting from potential poor transfection or ineffective silencing by one or both of the siRNAs. However, it was not the intent of this work to be comprehensive (find all possible bortezomib sensitizers) but rather to identify with confidence some true validated positives.
Using pathway/network analysis, we note that many of these validated sensitizer hits associate in an NF-κB/proteasome network. This result is consistent with a previous finding and indicates that NF-κB and the proteasome are major targets of bortezomib. The strongest hits identified in the screen were proteasome subunits: logical bortezomib targets, which also prove internal validation of the screening process. We also noticed in our screens that targeting other proteasome subunits by siRNAs alone directly induced more than 50% MM cytotoxicity (supplemental Figure 2). Our data open the possibility that the combination of bortezomib and other proteasome inhibitor drugs with various specificities may induce a synergistic effect in killing myeloma cells. An alternate thesis is that these results may just reflect that maximal proteasome inhibition is the goal.
In myeloma cells, several inactivating mutations were recently detected in the genes encoding the negative regulators of the NF-κB pathway, such as TRAF3.3,4 Inactivation of TRAF3 strongly associated with bortezomib response. In the screen, we demonstrate that silencing the tumor necrosis factor-induced NF-κB activation inhibitor, TNFAIP3, a zinc finger protein that has been shown to inhibit NF-κ B activation as well as tumor necrosis factor-mediated apoptosis,15,16 resulted in an enhanced sensitivity of KMS11 cells to bortezomib.
Our pathway analysis identified several sensitizer hits connected with p53.17 MDM4, which has been shown to stabilize p53 and its regulator MDM2,18-20 is among the top sensitizer hits. Other hits, such as ENC1,21 a substrate-specific adapter of an E3 ubiquitin-protein ligase complex,22 is a p53 inducible protein. These results suggest a role of p53 signaling in bortezomib sensitivity. Our top sensitizer hits also consist of several transcription factors. One such hit is the transcription factor YY1. The overexpression and/or activation of YY1 has been previously implicated in unchecked cellular proliferation, resistance to apoptotic stimuli, tumorigenesis, metastatic potential, and tumor cell resistance to chemotherapeutics.23
We focused here on the strongest kinase sensitizer hit, CDK5. CDK5 is a unique CDK that is primarily active in postmitotic neurons.24 Unlike other CDK members, activation of CDK5 must associate with its activator CDK5R1/P35 or CDK5R2/P39.25 Although activity of CDK5 is most evident in neuronal tissues, CDK5 is also active in some non-neuronal tissues26,27 and survival and metastasis of several tumor cells, including breast, prostate, thyroid, and colon cancer cells.11,28-30 Up-regulation of CDK5 was recently identified as one of genetic changes related to oxaliplatin resistance acquisition in colorectal cancer cells.31 A recent RNAi screening study demonstrated that silencing CDK5 enhanced the sensitivity to a PARP inhibitor in a breast cancer cell line.32
Our gene expression profile analysis indicated that both CDK5 and CDK5 activators are expressed in myeloma cells. Interestingly, CDK5 expression level increased from MGUS to myeloma. CDK5 is a mediator of neuronal cell death and survival.33 CDK5 was also previously shown to enhance tumor cell proliferation and invasion.28-30,34 CDK5's targets include several important proteins for cell growth and death, such as STAT3, AKT, BCL-2, p53, and RB.29,34-37
By testing multiple CDK5 siRNAs and shRNAs, we confirmed that CDK5 knockdown sensitizes genetically variable myeloma cell lines to bortezomib and other proteasome inhibitors. This finding and its clinical relevance were further explored by the use of CDK5 inhibitors, roscovitine and SCH727965, which were demonstrated to synergize with bortezomib to induce cytotoxicity of both MM cell lines and primary MM samples. Silencing CDK5 sensitizes breast cancer cells to DNA-damaging agents and the underlying mechanisms include involvement of CDK5 in DNA-damage checkpoint activation.32 In our study, silencing CDK5 enhanced the sensitivity to bortezomib but did not affect the sensitivity to an alkylating agent, melphalan, implying that the sensitizing activity of CDK5 is probably more than merely a DNA damage response inhibition. A panel of genes down-regulated after CDK5 silencing was identified; and among target genes of interest, we identified HGF, API5, and PMSB5. The proteasome subunit PMSB5 appeared as the most probable downstream candidate to lead to bortezomib sensitization.
In conclusion, inhibition of the existing proteasome, either directly by suppression of proteasome subunits or indirectly by suppression of modulators such as CDK5, appears to confer the greatest sensitization effect, suggesting that combinations of bortezomib with other unique proteasome inhibitor drugs or combinations with inhibitors of CDK5 are a logical avenue for clinical exploration.
The online version of this article contains a data supplement.
The publication costs of this article were defrayed in part by page charge payment. Therefore, and solely to indicate this fact, this article is hereby marked “advertisement” in accordance with 18 USC section 1734.
Acknowledgments
This work was supported by the Mayo Clinic (A.K.S.), National Institutes of Health (grants RO1CA129009-03, RO1CA133115-02, 5P5OCA100707-08, and SPORE in Myeloma), Multiple Myeloma Research Foundation fellowship (R.T.), American Society of Hematology Scholar Award Multiple Myeloma Research Foundation (senior research grant; A.K.S.), Leukemia & Lymphoma Society (Translational Research Program Award; A.K.S.), and Multiple Myeloma Research Consortium Genomics Initiative (S.M.).
National Institutes of Health
Authorship
Contribution: Y.X.Z., J.J.K., E.B., and A.K.S. wrote the paper; and Y.X.Z., R.T., C.-X.S., H.Y., J.E.S., L.A.B., J.J.K., E.B., C.S., and S.M. collected and analyzed data.
Conflict-of-interest disclosure: The authors declare no competing financial interests.
Correspondence: A. Keith Stewart, Mayo Clinic, 13400 E. Shea Blvd, MCCRB3-008, Scottsdale, AZ 85259; e-mail: stewart.keith@mayo.edu.


