Abstract
Although low-density culture provides an efficient method for rapid expansion of human mesenchymal stem cells (MSCs), MSCs enriched by this method undergo senescence and lose their stem cell properties, which could be preserved by combining low-density and hypoxic culture. The mechanism was mediated through direct down-regulation of E2A-p21 by the hypoxia-inducible factor–1α (HIF-1α)–TWIST axis. Expansion under normoxia induced E2A and p21 expression, which were abrogated by overexpression of TWIST, whereas siRNA against TWIST up-regulated E2A and p21 in hypoxic cells. Furthermore, siRNA against p21 in normoxic cells enhanced proliferation and increased differentiation potential, whereas overexpression of p21 in hypoxic cells induced a decrease in proliferation and a loss of differentiation capacity. More importantly, MSCs expanded under hypoxic conditions by up to 100 population doublings, exhibited telomerase activity with maintained telomere length, normal karyotyping, and intact genetic integrity, and did not form tumors. These results support low-density hypoxic culture as a method for efficiently expanding MSCs without losing stem cell properties or increasing tumorigenicity.
Introduction
Human multipotent stromal cells or mesenchymal stem cells (MSCs), capable of self-renewal and differentiating into various mesenchymal tissues,1 have emerged as a promising tool for clinical applications in, for example, cell-based therapy for osteogenesis imperfecta2 and tissue engineering in cartilage and bone.3 MSCs are also applied in cardiac therapeutics because they prevent deleterious remodeling and improve recovery.4 However, variations in the isolation techniques, growth media, and culture conditions used cause a remarkable difference in their proliferation and differentiation capacity.5 Furthermore, many studies have consistently noticed a senescent tendency of MSCs upon expansion.6,7 Thus, the difference in stem cell properties and the senescence encountered during expansion hinder the clinical applications of MSCs.
Hypoxia has been known to regulate several cellular processes and signal transductions via the expression of hypoxia inducible factor-1 (HIF-1), a heterodimer consisting of the constitutively expressed aryl hydrocarbon receptor nuclear translocator (ARNT) and the hypoxic response factor HIF-1α. HIF-1α is regulated by the cellular O2 concentration and determines the transcriptional activity of HIF-1.8 Most of the effects of HIF-1α were investigated on cancer cells. HIF-1α, induced during ischemia that occurred in the course of tumor progression or after treatment, stimulates proliferation9 and induces vascular endothelial growth factor expression and angiogenesis.9
Hypoxia has also been reported to enhance proliferation, survival, and dopaminergic differentiation of central nervous system (CNS) precursors.10 In parallel, hypoxia also determines the cell fate of neural crest stem cells.11 These findings suggest neural stem cells may exhibit a conserved response to reduced oxygen levels. Because human and mouse cells differ in oxygen sensitivity for acquiring replicative senescence,12 it is not clear whether the benefits of hypoxic culture on mouse neural stem cells could be observed in neural or other stem cells of human origin.
TWIST, a basic helix-loop-helix (bHLH) transcription factor, promotes tumor metastasis by inducing epithelial-mesenchymal transition (EMT).13 TWIST cooperates with v-myc myelocytomatosis viral related oncogene (Mycn) to induce tumorigenic transformation.14 TWIST and snail, another inducer of EMT, were proved to increase cells with cancer stem cell properties when overexpressed in breast cancer cells.15 Further, TWIST can overcome oncogene-induced senescence to complete oncogenic transformation.16 Recently, the HIF-TWIST axis has been demonstrated in head and neck cancer and is involved in tumor metastasis.17 Stem cells and cancer cells share a lot of similarities in gene expression, cellular processes and signal transductions, but there are few, if any, studies researching the effects of HIF-TWIST on normal stem cells.
The bHLH transcription factor E2A is essential for the differentiation of B-lymphoid lineage by inducing p21 expression18 ; p21 is also induced by p53 and acts as a suppressor in cell-cycle progression.19 After p21 activation, cells undergo senescence and induce apoptosis. Although p21 expression and senescence have been reported to impair the efficiency of somatic cell reprogramming,20 the roles of p21 in regulating pluripotency and stem cell properties of stem cells have not been elucidated.
Because bone marrow, the original environment of MSCs, is hypoxic, with the oxygen tension approximately 1% to 7%,21 we hypothesized that hypoxic culture provides more benefits than normoxic culture. Our results provide evidence for proposing a general protocol for rapid and efficient expansion of MSCs by combining low-density culture with hypoxic culture. We found that hypoxic culture not only prevented the senescence noted in expanded MSCs, but also increased differentiation efficiency. The underlying mechanism mediating the increase in stem cell properties by hypoxic culture is through down-regulation of E2A-p21 by the HIF-TWIST pathway.
Methods
Cells and preparation of hypoxic cultures
Primary MSCs from 3 healthy human volunteers were obtained from the Tulane Center for Distribution of Adult Stem Cells (wolfe@tulane.edu) and were prepared as described previously.22 The cells were seeded at 50 to 4 × 10³ cells per cm2 and grown in complete culture medium (CCM) composed of α-MEM (α-minimal essential medium (Gibco-BRL), supplemented with 16.6% fetal bovine serum (FBS), 100 units/mL penicillin, 100 μg/mL streptomycin, and 2mM l-glutamine, with medium change twice per week. For hypoxic culture, cells were cultured in a gas mixture composed of 94% N2, 5% CO2, and 1% O2. For maintenance of the hypoxic gas mixture, an incubator with 2 air sensors, one for CO2 and the other for O2, was used; the O2 concentration was achieved and maintained using delivery of nitrogen gas (N2) generated from a liquid nitrogen tank or a tank containing pure N2. If O2 percentage rose above the desired level, N2 gas was automatically injected into the system to displace the excess O2.
In vitro and in vivo differentiation
For in vitro differentiation into osteoblasts, adipocytes, and chondrocytes, cells were induced with osteogenic induction medium (OIM), composed of α-MEM supplemented with 16.6% FBS, 50 μg/mL ascorbate-2 phosphate, 10−8M dexamethasone, and 10mM β-glycerophosphate; adipogenic induction medium (AIM), composed of α-MEM supplemented with 16.6% FBS, 50 μg/mL ascorbate-2 phosphate, 10−7M dexamethasone, 50μM indomethacin, 0.45mM 3-isobutyl-1-methyl-xanthine and 10 μg/mL insulin; and chondrogenic induction medium (CIM), composed of cell pellets in serum-free α-MEM supplemented with ITS+ (GIBCO) and 10 ng/mL TGF-β1 (PeproTech), respectively. After the appearance of morphologic features of differentiation, cells were treated with OIM and AIM, and then stained with Alizarin Red S (ARS) and Oil Red O, respectively. Cells induced with CIM were prepared for Alcian Blue staining and immunohistochemistry. For immunohistochemistry, paraffin sections were initially incubated with blocking serum, probed with a monoclonal antibody against human type II collagen (Millipore), then made to react with an alkaline phosphatase (AP)–conjugated goat anti–mouse IgG antibody, and finally processed for AP-Vector Red staining (Vector Laboratories). For in vivo osteogenic differentiation, 106 cells delivered in ceramic cube were induced with OIM. One week after induction, the cell-containing constructs were transplanted subcutaneously into the immunodeficient mice by surgical procedures. The specimens were analyzed by Mallory trichrome staining 4 weeks later. For in vivo chondrocyte differentiation, cells were encapsulated with alginate as described before23 and then induced with CIM for 1 week. One week after induction, the alginate-encapsulated cells were transplanted subcutaneously into the immunodeficient mice by surgical procedures. The specimens were analyzed by Alcian Blue and Type II collagen immunohistochemistry staining 4 weeks later. The images were saved and analyzed with Image-Pro Plus 4.5 software (Media Cybernetics) using histogram-based quantification.24 For in vivo adipocyte differentiation, 1 μg/mL basic fibroblast growth factor (bFGF) in 100 μL of matrigel (BD Biosciences), was mixed with or without (control) 1 × 10⁶ cells and injected immediately into the subcutaneous layer of immunodeficient mice. The specimens were analyzed by Sudan IV staining of frozen sections 3 weeks later.
β-Galactosidase staining
Cells were washed with phosphate-buffered saline (PBS) and fixed with 2% formaldehyde/0.2% glutaraldehyde for 5 minutes at room temperature. After washing, the cells were incubated at 37°C for an appropriate time with fresh senescence-associated β-Gal (SA-β-Gal) chromogenic substrate solution (1 mg/mL 5-bromo-4-chloro-3-indolyl-β-galactoside [X-Gal, Cell Signaling Technology], 40mM citric acid (pH 6.0), 5mM potassium ferrocyanide, 5mM potassium ferricyanide, 150mM NaCl, and 2mM MgCl2). The experiment was repeated 3 times and the mean percentage of cells expressing β-galactosidase was calculated.
Reverse-transcriptase PCR and real-time PCR
Total RNA was extracted using TRIzol kit (Invitrogen). RNA was reverse transcribed in a final volume of 20 μL using 0.5 μg of oligo dT and 200 U Superscript III RT (Invitrogen) for 30 minutes at 50°C, followed by 2 minutes at 94°C to inactivate the reverse transcriptase. Polymerase chain reaction (PCR) amplification of the resulting cDNAs was performed under the following conditions: 35 cycles of 94°C for 30 seconds, 58°C for 45 seconds, and 68°C for 45 seconds, in which the 68°C step was increased by 5 seconds every cycle after 10 cycles. The reaction products were resolved by electrophoresis on a 1.5% agarose gel and visualized with ethidium bromide. For real-time PCR, the amplification was carried out in a total volume of 25 μL containing 0.5μM of each primer, 4mM MgCl2, 12.5 μL of LightCycler. FastStart DNA Master SYBR green I (Roche Molecular Systems) and 10 μL of 1:20-diluted cDNA. PCR reactions were prepared in duplicate and heated to 95°C for 10 minutes followed by 40 cycles of denaturation at 95°C for 15 seconds, annealing at 60°C for 1 minute, and extension at 72°C for 20 seconds. Standard curves (cycle threshold values versus template concentration) were prepared for each target gene and for the endogenous reference (glyceraldehyde 3-phosphate dehydrogenase [GAPDH]) in each sample. The quantification of the unknown samples was performed using the LightCycler Relative Quantification Software version 3.3 (Roche). The sequences of primers are listed in supplemental Table 2 (available on the Blood Web site; see the Supplemental Materials link at the top of the inline article).
Western blotting
Cell extracts were prepared with M-PER (Pierce Protein Research Products) plus protease inhibitor cocktail (Halt; Pierce) and protein concentrations were determined using the BCA assay (Pierce). Aliquots of protein lysates were separated on sodium dodecyl sulfate (SDS)–10% polyacrylamide gels, transferred onto polyvinylidene fluoride (PVDF) membranes, blocked with 5% blotting grade milk (Bio-Rad) in Tris-buffered saline with Tween (TBST; 20mM Tris-HCl [pH 7.6], 137mM NaCl, 1% Tween 20), probed with the indicated primary antibodies, then made to react with corresponding secondary antibodies, and detected using a chemiluminescence assay (Millipore). Membranes were exposed to X-ray film (Amersham Pharmacia Biotech) for visualization.
ChIP assay
To demonstrate the binding of TWIST protein to the E2- and E5-box of E2A promoter, the chromatin immunoprecipitation (ChIP) assay was performed using a commercial kit (Upstate Biotechnology) according to the manufacturer's protocol with minor adjustments. The MSCs and 293T transfected with pFLAG-TWIST were grown to confluence, treated with 1% formaldehyde for 20 minutes at 37°C, washed in ice-cold PBS containing protease inhibitors, then lysed on ice for 10 minutes in lysis buffer (10mM Tris HCl, pH 8.0, 1% SDS) containing phosphatase and protease inhibitors. DNA-protein complexes were sonicated to 200 and 600 base pairs (bp). One aliquot of the soluble chromatin was stored at −20°C for use as input DNA, and the remainder was diluted 10 times in immunoprecipitation (IP) buffer (10mM Tris HCl, pH 8.0, 0.1% SDS, 1% Triton X-100, 1mM EDTA, and 150mM NaCl) containing phosphatase and protease inhibitors, and incubated overnight (4°C) with anti-human TWIST polyclonal antibody (H-81, sc-15 393; Santa Cruz Biotechnology). DNA–protein complexes were isolated on salmon sperm DNA/ protein A agarose beads and then eluted with 1% SDS with 0.1M NaHCO3. Cross-linking was reversed by incubation at 65°C for 5 hours. Proteins were removed with proteinase K, and DNA was extracted with phenol/chloroform, redissolved, and PCR-amplified with specific primer for E box on E2A promoter. All resulting precipitated DNA samples were also quantified with quantitative RT-PCR. Data were expressed as the percentage of input DNA.
Calvarial defect animal models
The animal research protocol was reviewed and approved by the animal center committee of National Ying-Ming University. The calvarial defects were created in 8-week-old nonobese diabetic/severe combined immunodeficient (NOD-SCID) mice under general anesthesia using xylazine and ketamine. Full-thickness skin flaps were raised and the left and right parietal bones were exposed. Defect diameter of 4 mm in the center of parietal bones was generated using a hand drill trephine burr with constant saline irrigation. Collagen scaffold seeded with 1 × 10⁵ cells was implanted into the defect. The skin was resealed. The procedure was performed under sterile conditions. Animals were killed at 6 weeks after implantation for radiographic and histologic analyses.
Micro-CT measurements
Microfocal computed tomography (micro-CT) images were acquired using a cone-beam micro-CT imaging system. The scanner generates a cone beam at 110-μm spot size and operates at 50 keV. A region of 404 slices was imaged at 65-μm isotropic resolution and reconstructed in the size of 540 × 540 pixel. Reconstructed images were analyzed by threshold selection method.
Dual energy X-ray absorptiometry (DEXA)
The bone mineral density (BMD) of specimen was measured by Norland Dual Energy X-ray Absorptiometry (pDEXA; Norland Medical System, Inc). The instrument was calibrated with a phantom of known mineral content. Each scan was performed at a speed of 5 mm s−1 and scanning resolution was 0.1 × 0.1 mm. DEXA measurement was analyzed by pDEXA host software Version 3.9.4, and the region of interest for each sample was 0.1 × 0.1 cm.
Results
Hypoxic culture increases expansion efficiency and decreases senescence
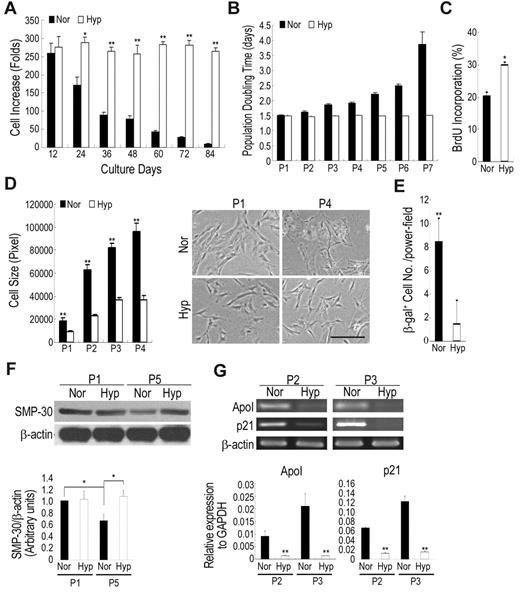
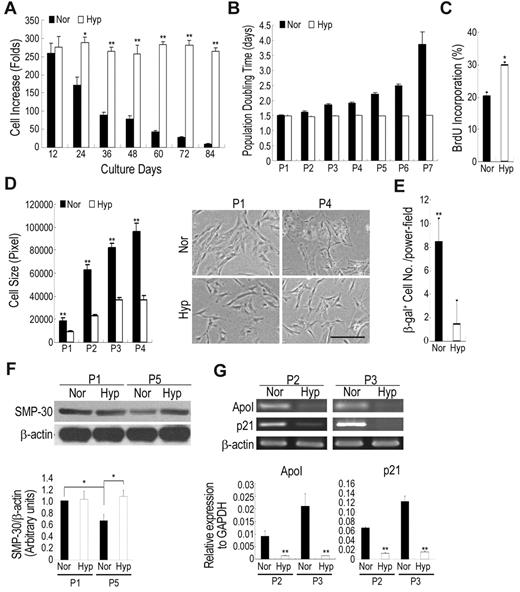
For the rapid expansion of MSCs with maintained properties, the expansion efficiency at a variety of seeding densities was first analyzed. The increase in seeding density caused a decrease in expansion efficiency (supplemental Table 1). Increase in cell number by up to 170- to 250-fold for each passage was seen for low-density (approximately 50 cells/cm2) culture, whereas high-density (approximately 1000-4000 cells/cm2) culture showed a fivefold increase for each week. However, we observed a decrease in expansion efficiency when cells were continuously expanded at low density (supplemental Table 1). Accumulatively, low-density culture increased cell number by more than 1010-fold within 60 days, according to a 1000-fold of the increase in high-density culture. We then examined whether hypoxic culture (1% O2, if not indicated otherwise) could prevent low-density culture-induced decrease in expansion efficiency. The expansion rate was the same for both normoxic (21% O2) and hypoxic culture at the earliest passages, but was significantly less under normoxic conditions than hypoxic conditions after passage 2 with up to 10-fold difference at passage 6 or 7 (Figure 1A). The population doubling time (PDT) increased by up to twofold with the increase in passage number at passage 6 or 7 under normoxic conditions, but under hypoxic conditions, the PDT remained the same as the earliest passages (Figure 1B). To elucidate the factors causing the dramatic difference under normoxic and hypoxic conditions, the proliferation capacity and the expression of senescence markers were evaluated. The 5-bromo-2′-deoxyuridine (BrdU) incorporation rate was significantly higher in hypoxic cells compared with normoxic cells (Figure 1C). Increased cell growth was noted in O2 concentrations between 1% and 7% (supplemental Figure 1). Further, the decrease in cellular proliferation of normoxic cells was also associated with an increase in cell size with broader morphology (Figure 1D), a representative picture for cellular senescence in MSCs.22 In addition, senescence as assayed by the expression of senescence-associated β-galactosidase (β-gal) revealed a significant increase in normoxic cells (Figure 1E). Western blotting of cells in late-passage MSCs under normoxic conditions also revealed a decrease in senescence marker protein-30 (SMP-30), which was down-regulated with senescence and aging (Figure 1F),25 suggesting hypoxic culture prevented MSCs from replication-induced senescence and aging. Reverse transcriptase PCR showed a higher expression of ApoI and p21, markers of senescence, in normoxic cells than in hypoxic cells (Figure 1G). Cells under normoxic conditions began to cease proliferation and were difficult to subculture after passage 6 to 7, whereas cells under hypoxic conditions could be further expanded without significant loss of proliferation capacity. Similar results were also demonstrated with MSCs derived from 2 other donors. Taken together, these data suggest low-density culture expanded MSC with a decrease in proliferation capacity and an increase in senescence, but combining low-density and hypoxic culture expanded MSCs with preserved proliferation capacity without inducing senescence.
Hypoxic culture increases expansion efficiency and decreases in senescence. Cells were seeded at 50 cells/cm2 and cultured under normoxic and hypoxic conditions. After 12 days of culture, the cells were recovered and reseeded at 50 cells/cm2 and cultured under the same conditions. Cell expansion rate (A) and population doubling time (B) for each passage were calculated. Normoxic culture decreases in cell expansion rate and increases in population doubling time as the increase of passage number (Pn: Passage No). (C) Normoxic and hypoxic cells were incorporated with BrdU for 18 hours and then detected by flow cytometry. Hypoxic cells increase in BrdU incorporation rate compared with normoxic cells. (D) Photomicrographs (original magnifications, 10×/0.25 NA dry objective) of normoxic and hypoxic cells were captured using an Olympus IX70 inverted phase contrast/fluorescence microscope equipped with an Olympus DP70 digital camera (Olympus Japan) and analyzed with the Zeiss AxioVision 4.4 software. Hypoxic cells increase in cell size and become large and flat after expansion compared with hypoxic cells. (E) Cells expanded under normoxic and hypoxic conditions were stained with β-galactosidase (β-gal). Normoxic cells increase in the percentage of β-gal expression compared with hypoxic cells. (F) Western blotting and quantification for senescence marker protein-30 (SMP-30). After expansion, normoxic cells decrease in SMP-30 level, while hypoxic cells increase the expression. (G) Real time-PCR (top panel) and quantitative real time-PCR (bottom panel) analysis for markers of senescence. After expansion, the expression of senescence-related genes significantly increases under normoxic conditions compared with hypoxic conditions. Values are mean + SD; *P < .05 and **P < .01 indicate significant variance (independent t test) between normoxia (Nor) and hypoxia (Hyp). Bar = 50 μm.
Hypoxic culture increases expansion efficiency and decreases in senescence. Cells were seeded at 50 cells/cm2 and cultured under normoxic and hypoxic conditions. After 12 days of culture, the cells were recovered and reseeded at 50 cells/cm2 and cultured under the same conditions. Cell expansion rate (A) and population doubling time (B) for each passage were calculated. Normoxic culture decreases in cell expansion rate and increases in population doubling time as the increase of passage number (Pn: Passage No). (C) Normoxic and hypoxic cells were incorporated with BrdU for 18 hours and then detected by flow cytometry. Hypoxic cells increase in BrdU incorporation rate compared with normoxic cells. (D) Photomicrographs (original magnifications, 10×/0.25 NA dry objective) of normoxic and hypoxic cells were captured using an Olympus IX70 inverted phase contrast/fluorescence microscope equipped with an Olympus DP70 digital camera (Olympus Japan) and analyzed with the Zeiss AxioVision 4.4 software. Hypoxic cells increase in cell size and become large and flat after expansion compared with hypoxic cells. (E) Cells expanded under normoxic and hypoxic conditions were stained with β-galactosidase (β-gal). Normoxic cells increase in the percentage of β-gal expression compared with hypoxic cells. (F) Western blotting and quantification for senescence marker protein-30 (SMP-30). After expansion, normoxic cells decrease in SMP-30 level, while hypoxic cells increase the expression. (G) Real time-PCR (top panel) and quantitative real time-PCR (bottom panel) analysis for markers of senescence. After expansion, the expression of senescence-related genes significantly increases under normoxic conditions compared with hypoxic conditions. Values are mean + SD; *P < .05 and **P < .01 indicate significant variance (independent t test) between normoxia (Nor) and hypoxia (Hyp). Bar = 50 μm.
Hypoxic culture maintains mesenchymal stem cell properties
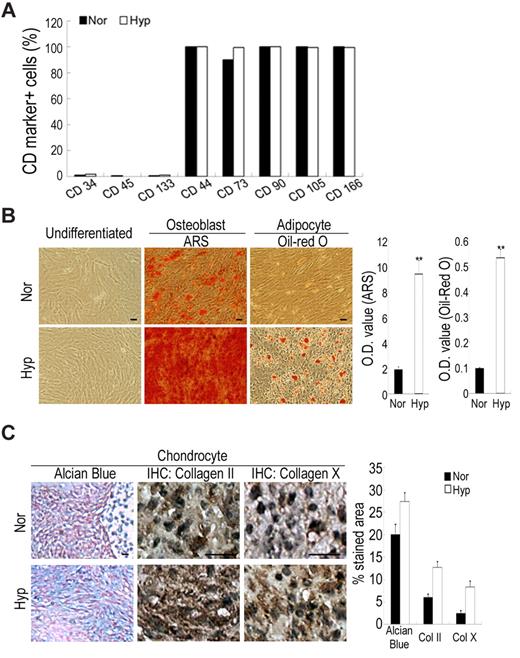
We then examined the expansion insults on the stem cell properties of MSCs under normoxic and hypoxic conditions. Cells grown under both conditions had the same surface CD marker profiles; they were consistently positive for CD44, CD73, CD90, 105 and CD166, putative markers of MSCs, but negative for CD34 and CD133, the markers of hematopoietic stem cells, and CD45, the marker of hematopoietic cells (Figure 2A). Stem cell properties of MSCs could be assayed by the potential to differentiate along the osteogenic, adipogenic and chondrogenic lineages. Interestingly, MSCs expanded at a low density under normoxic conditions showed declining differentiation potential especially at late passage, while cells under hypoxic conditions preserved the same potential for versatile differentiation as the earliest passage cells (Figure 2B-C). Taken together, MSCs cultured at low density lost their differentiation potential, and hypoxic culture increased MSC properties compared with normoxic culture.
Hypoxic culture increases in stem cell properties. Cells were seeded at 50 cells/cm2 and expanded under normoxic and hypoxic conditions. (A) Flow cytometry for detecting surface CD markers. Cells under normoxic and hypoxic conditions have the same profile of surface CD markers. (B-C) Hypoxic cells increase in differentiation potential into osteoblasts, adipocytes and chondrocytes. (B) Normoxic and hypoxic cells at passage 6 were induced to differentiate to osteoblasts and adipocytes for 3 weeks, and stained by ARS and Oil Red O, respectively. Stained dye was extracted and OD values were measured. (C) Normoxic and hypoxic cells at passage 6 were induced to differentiate to chondrocytes for 3 weeks, and Alcian Blue staining and immunohistochemical study for collagen II and X were performed. Quantitative data performed by the computerized image analysis show hypoxic cells increase in Alcian Blue staining and IHC for collagen II and X. Values are mean + SD; *P < .05 and **P < .01 indicate significant variance (independent t test) between normoxic and hypoxic groups. Bar = 20 μm.
Hypoxic culture increases in stem cell properties. Cells were seeded at 50 cells/cm2 and expanded under normoxic and hypoxic conditions. (A) Flow cytometry for detecting surface CD markers. Cells under normoxic and hypoxic conditions have the same profile of surface CD markers. (B-C) Hypoxic cells increase in differentiation potential into osteoblasts, adipocytes and chondrocytes. (B) Normoxic and hypoxic cells at passage 6 were induced to differentiate to osteoblasts and adipocytes for 3 weeks, and stained by ARS and Oil Red O, respectively. Stained dye was extracted and OD values were measured. (C) Normoxic and hypoxic cells at passage 6 were induced to differentiate to chondrocytes for 3 weeks, and Alcian Blue staining and immunohistochemical study for collagen II and X were performed. Quantitative data performed by the computerized image analysis show hypoxic cells increase in Alcian Blue staining and IHC for collagen II and X. Values are mean + SD; *P < .05 and **P < .01 indicate significant variance (independent t test) between normoxic and hypoxic groups. Bar = 20 μm.
Hypoxic culture bypasses senescence by increasing cells in the S phase and suppressing p21 expression
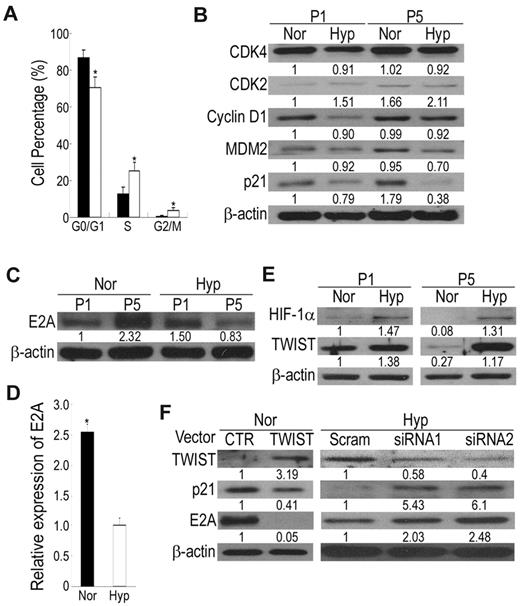
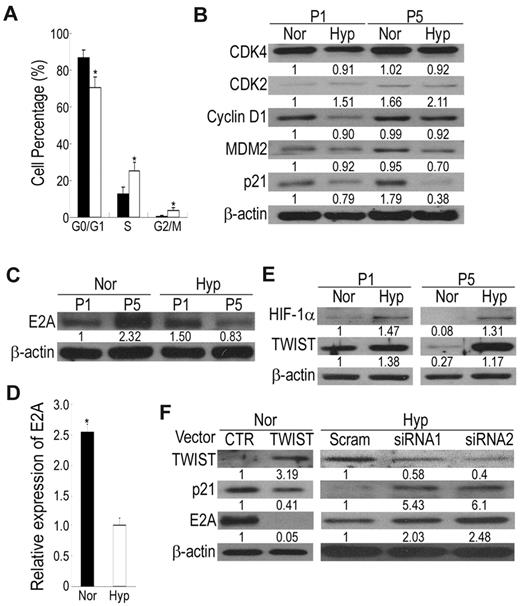
To clarify the anti-senescence effects of hypoxic culture, we compared the proliferation and apoptosis of MSCs grown in normoxia and hypoxia by analyzing the cell-cycle phase distribution. Flow cytometry analysis of hypoxic cells revealed a marked reduction of cells in the G0/G1 phase and a compensatory increase of cells in S and G2/M phases compared with normoxic cells (Figure 3A), suggesting hypoxic culture increased cell proliferation. Because cell-cycle regulatory proteins and their inhibitors are involved in cellular senescence of human fibroblasts, we therefore examined their involvement in the replicative senescence of MSCs. The expression level of p53 was not detectable under both hypoxic and normoxic conditions (data not shown). No obvious difference in CDK4 and CDK2 between hypoxic and normoxic culture was observed at passage 2 and 5 (Figure 3B). In addition, the expression levels of cyclin D1 and MDM2 were slightly decreased in hypoxic culture compared with normoxic culture. Interestingly, the p21 protein level was induced at the late passage compared with the early passage of normoxic culture, while its expression was slightly down-regulated at late passage of hypoxic culture (Figure 3B). The p21 protein is highly expressed in senescent cells, and its disruption in normal human fibroblasts can bypass senescence.26 Thus, these data suggest that replicative senescence in MSCs under normoxic conditions and the bypass of replicative senescence in hypoxic culture may be mediated by regulating the p21 protein.
HIF-TWIST inhibits p21 expression via suppressing E2A protein level and activity. (A) Analysis for cell-cycle distribution in normoxic and hypoxic cells by propidium iodide (PI) staining followed by flow cytometric analysis. G0/G1 phase is reduced but S and G2/M phases are increased in hypoxic cells compared with normoxic cells. (B) Western blotting for cell-cycle-related proteins. Hypoxic cells decrease in p21 protein level compared with normoxic cells. (C) Western blotting and (D) quantitative RT-PCR for E2A expression. After expansion, normoxic cells increase in E2A protein and mRNA levels compared with hypoxic cells. (E) Western blotting for HIF-1α and TWIST. Expression of HIF-1 and TWIST are decreased in normoxic cells compared with hypoxic cells. (F) Cell lysates were detected by Western blotting. Compared with control vectors, overexpression of TWIST in normoxic cells inhibits the expression of p21 and E2A, and siRNAs against TWIST in hypoxic cells induces p21 and E2A expression. The results shown here are representative of 3 independent experiments. Values are mean + SD; *P < .05 and **P < .01 indicate significant variance (independent t test) between normoxic and hypoxic groups.
HIF-TWIST inhibits p21 expression via suppressing E2A protein level and activity. (A) Analysis for cell-cycle distribution in normoxic and hypoxic cells by propidium iodide (PI) staining followed by flow cytometric analysis. G0/G1 phase is reduced but S and G2/M phases are increased in hypoxic cells compared with normoxic cells. (B) Western blotting for cell-cycle-related proteins. Hypoxic cells decrease in p21 protein level compared with normoxic cells. (C) Western blotting and (D) quantitative RT-PCR for E2A expression. After expansion, normoxic cells increase in E2A protein and mRNA levels compared with hypoxic cells. (E) Western blotting for HIF-1α and TWIST. Expression of HIF-1 and TWIST are decreased in normoxic cells compared with hypoxic cells. (F) Cell lysates were detected by Western blotting. Compared with control vectors, overexpression of TWIST in normoxic cells inhibits the expression of p21 and E2A, and siRNAs against TWIST in hypoxic cells induces p21 and E2A expression. The results shown here are representative of 3 independent experiments. Values are mean + SD; *P < .05 and **P < .01 indicate significant variance (independent t test) between normoxic and hypoxic groups.
HIF-TWIST inhibits p21 expression by down-regulation of E2A
The transcription factor E2A plays important roles in suppressing cell growth by transcriptionally activating the p21 gene.18 Interestingly, MSCs expanded under normoxic conditions exhibited a marked increase in E2A protein level, whereas E2A level was slightly down-regulated under hypoxic conditions (Figure 3C). Likewise, the E2A mRNA level was increased in normoxic cells compared with hypoxic cells (Figure 3D). Therefore, p21-induced senescence in normoxic cells is mediated by up-regulating E2A expression and activity.
HIF-2α, one of the regulators of cellular response to hypoxia, induces OCT-4 expression and transcriptional activity in embryonic stem cells.27 To elucidate the upstream signaling of hypoxia-mediated E2A inhibition and MSC properties maintenance, we first examined whether HIF-2α was up-regulated in MSCs under hypoxic conditions. HIF-2α expression level was the same in both normoxic and hypoxic MSCs (data not shown), suggesting HIF-2α was not involved in hypoxia-mediated effects. We then analyzed the expression of HIF-1α, the master regulator induced by hypoxia, and TWIST, which is up-regulated by HIF-1α17 and generates cells with stem cell properties by EMT.15 Interestingly, normoxic cells expressed a very low level of HIF-1α, a basal level of TWIST, and down-regulation of TWIST was noted after expansion, whereas hypoxic cells exhibited increased HIF-1 and TWIST expression and expansion under hypoxia did not induce a loss of TWIST expression (Figure 3E). An increase in HIF-1 and TWIST expression was observed at O2 levels between 1% and 7% (data not shown). We then examined whether TWIST plays a negative role in the regulation of E2A expression. Ectopic expression of TWIST under normoxia inhibited the expression of E2A and p21 (Figure 3F), and siRNA against TWIST under hypoxia induced E2A and p21 expression (Figure 3F). Together, these data all suggest HIF-TWIST inhibited E2A and p21 expression.
TWIST directly inhibits E2A transcription by binding to the E-box motif in E2A promoter
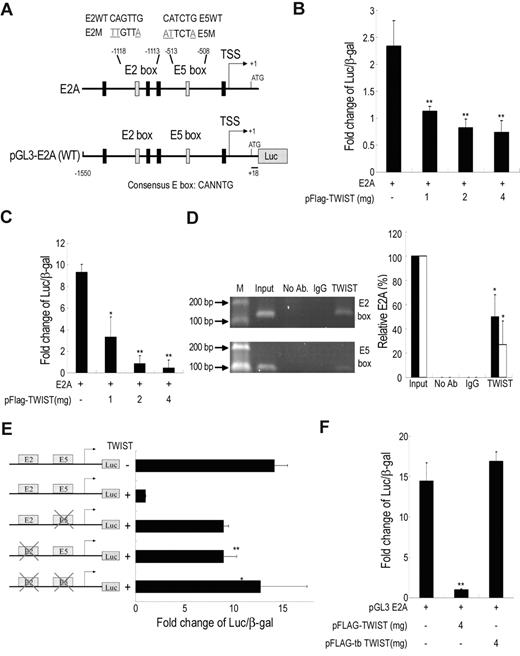
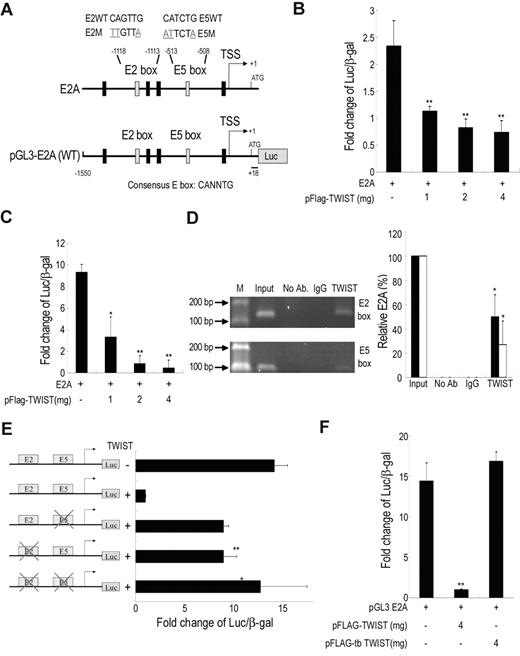
To determine whether E2A was directly regulated by TWIST, the human E2A promoter activity was measured by luciferase reporter assay (Figure 4A). TWIST inhibited E2A promoter activity in a dose-dependent manner both in immortalized MSCs (Figure 4B) and 293T cells (Figure 4C). To investigate whether TWIST is directly associated with the E2A promoter via binding to the putative TWIST binding sites, E-boxes (CANNTG), ChIP was performed. PCR amplification (Figure 4D left panel) and real-time PCR (Figure 4D right panel) showed that the fragments containing the second (E2, −1118 ∼ −1112) and fifth (E5, −513 ∼ −507) boxes (Figure 4D), but not other E-boxes (supplemental Figure 2A), were immunoprecipitated with TWIST antibody in the immortalized MSCs overexpressing TWIST. Similar results were obtained in primary MSCs cultured under hypoxia for 12 days (supplemental Figure 2B). To further confirm the functional significance of the TWIST/E-box binding site, E2A promoter constructs with mutated E2-, E5-, or E2E5 box were cotransfected with the TWIST vector into 293T cells. Consistent with the ChIP results, the mutant E2A promoter reporter constructs did not show significant promoter repression in TWIST expressing cells (Figure 4E), indicating that both binding sites are required for maximal repression of E2A by TWIST. To determine the E-boxes' binding domain in TWIST, a construct with 316-492 amino acid bHLH-truncated, pFLAG-tbTWIST was transfected into 293T cells. Truncation of the bHLH domain abrogated the inhibition of E2A promoter activity by TWIST (Figure 4F). Therefore, TWIST down-regulated E2A promoter activity by direct binding through the bHLH domain to the distal E2- and E5-boxes in the E2A promoter.
TWIST directly inhibits E2A transcription by binding to E-box motif in E2A promoter. (A) Genomic organization of the region flanking the promoter region of human E2A (top panel) and the schematic representation of the pGL3-E2A reporter construct. Transcription start site, TSS. Reporter assays showing, in immortalized MSCs (B) or 293T (C), TWIST represses the E2A promoter in a dose dependent manner (n = 3). β-galactosidase was used as a control of transfection efficiency. (D) ChIP analysis of immortalized MSCs after transfection of pFLAG-TWIST. The chromatin was incubated either without antibodies, with an anti-TWIST antibody or with an isotype IgG antibody. Fragments of the E2-(147bp) and E5-(115bp) box in the E2A promoter were amplified by PCR (left panel) and were also quantified with quantitative RT-PCR (right panel). Input, 2% of total input lysate. Results are shown as the mean ± SD values (black bar for E2 box; white bar for E5 box). (E) Mutational analysis of E2-box and E5-box sites in the E2A promoter in 293T cells. Reporter constructs containing wild-type E2A (WT), E2-box (E2M) or E5-box (E5M) mutations, or double mutations (E2E5M) were generated and used to analyze the importance of these sites in mediating repression by TWIST (n = 3). (F) Truncation of the bHLH domain (tbTWIST) inhibits TWIST repression of E2A promoter (n = 3). Each ratio was normalized to the control (pGL3 basic vector), and significance was determined by Student t test. *P < .05, **P < .01 vs control.
TWIST directly inhibits E2A transcription by binding to E-box motif in E2A promoter. (A) Genomic organization of the region flanking the promoter region of human E2A (top panel) and the schematic representation of the pGL3-E2A reporter construct. Transcription start site, TSS. Reporter assays showing, in immortalized MSCs (B) or 293T (C), TWIST represses the E2A promoter in a dose dependent manner (n = 3). β-galactosidase was used as a control of transfection efficiency. (D) ChIP analysis of immortalized MSCs after transfection of pFLAG-TWIST. The chromatin was incubated either without antibodies, with an anti-TWIST antibody or with an isotype IgG antibody. Fragments of the E2-(147bp) and E5-(115bp) box in the E2A promoter were amplified by PCR (left panel) and were also quantified with quantitative RT-PCR (right panel). Input, 2% of total input lysate. Results are shown as the mean ± SD values (black bar for E2 box; white bar for E5 box). (E) Mutational analysis of E2-box and E5-box sites in the E2A promoter in 293T cells. Reporter constructs containing wild-type E2A (WT), E2-box (E2M) or E5-box (E5M) mutations, or double mutations (E2E5M) were generated and used to analyze the importance of these sites in mediating repression by TWIST (n = 3). (F) Truncation of the bHLH domain (tbTWIST) inhibits TWIST repression of E2A promoter (n = 3). Each ratio was normalized to the control (pGL3 basic vector), and significance was determined by Student t test. *P < .05, **P < .01 vs control.
Hypoxia or HIF-TWIST increases mesenchymal stem cell properties through suppressing E2A and p21
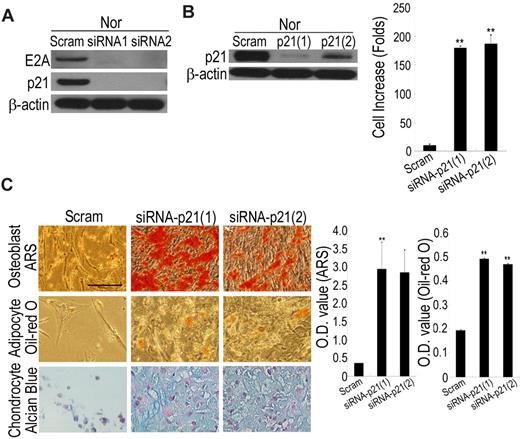
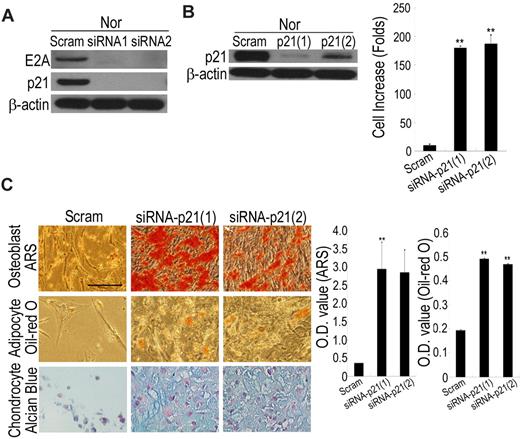
Because HIF-TWIST inhibits E2A-induced p21 expression, we examined whether hypoxia enhanced expression of these factors through suppressing E2A and p21. siRNA against E2A in normoxic cells suppressed the expression of p21 (Figure 5A), and siRNA against p21 in normoxic cells not only stimulated cell growth (Figure 5B) but also increased differentiation potential to osteoblasts, adipocytes, and chondrocytes (Figure 5C). Conversely, overexpression of p21 induced a decrease in proliferation capacity, loss of differentiation capacity, and premature cell growth arrest in hypoxic cells (data not shown). These data suggest hypoxia or HIF-TWIST increases MSC properties through suppressing E2A and p21.
Hypoxia or HIF-TWIST increases stem cell properties via suppressing p21. (A) siRNA against E2A in normoxic cells decreases the expression of p21. (B) siRNA against p21 in normoxic cells increases cell growth. Normoxic cells were cultured 12 days after p21 knockdown in low-density culture and cell numbers were counted. (C) Normoxic cells at passage 6 were stably transfected with scrambled or p21 siRNA, followed by differentiation into osteoblasts, adipocytes and chondrocytes for 3 weeks, and achievements of differentiation were analyzed by staining with ARS, Oil Red O and Alcian Blue, respectively. OD values of ARS and Oil Red O were analyzed for quantifying osteoblast and adipocyte differentiation, respectively. Knockdown of p21 increases the differentiation potential to osteoblasts, adipocytes and chondrocytes. Bar = 50 μm.
Hypoxia or HIF-TWIST increases stem cell properties via suppressing p21. (A) siRNA against E2A in normoxic cells decreases the expression of p21. (B) siRNA against p21 in normoxic cells increases cell growth. Normoxic cells were cultured 12 days after p21 knockdown in low-density culture and cell numbers were counted. (C) Normoxic cells at passage 6 were stably transfected with scrambled or p21 siRNA, followed by differentiation into osteoblasts, adipocytes and chondrocytes for 3 weeks, and achievements of differentiation were analyzed by staining with ARS, Oil Red O and Alcian Blue, respectively. OD values of ARS and Oil Red O were analyzed for quantifying osteoblast and adipocyte differentiation, respectively. Knockdown of p21 increases the differentiation potential to osteoblasts, adipocytes and chondrocytes. Bar = 50 μm.
Hypoxic cells have a normal karyotype and an untransformed phenotype
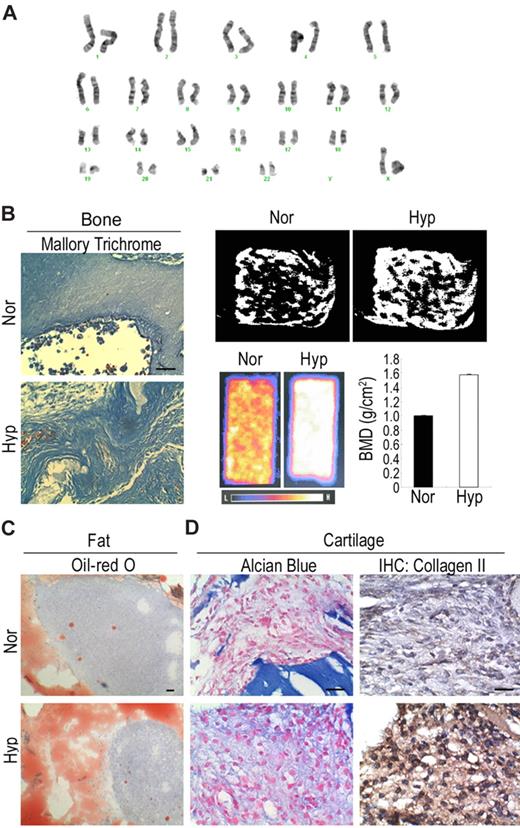
MSCs from 3 people that were expanded under hypoxic conditions for more than 70-100 population doublings still proliferated well and could be expanded with low-density culture. In addition, hypoxically expanded MSCs had a greater telomere length (supplemental Figure 3A) and telomerase activity (supplemental Figure 3B) than normoxically expanded MSCs. Similarly, knockdown of p21 in normoxic MSCs also induced an increase in telomere length (supplemental Figure 3A) and telomerase activity (supplemental Figure 3B). To prove the safety of expanding MSCs under hypoxic conditions, MSCs from 3 people were analyzed by karyotyping (Figure 6A) and comparative genomic hybridization (supplemental Figure 4C). All of the MSCs had normal chromosome (Figure 6A) and intact genetic integrity (supplemental Figure 3C), and, more importantly, no tumor was observed 3 months after transplantation into NOD-SCID mice (data not shown). These data demonstrate the safety of expanding MSCs under low-density and hypoxic conditions.
Safety and efficiency of hypoxic culture. (A) Karyotyping analysis shows hypoxic MSCs have normal karyotype. (B) For in vivo bone formation, cells were delivered in ceramic cube and induced in osteogenic medium for one week followed by transplantation under beneath the dorsal skin of NOD-SCID mice for 4 weeks. Mallory trichrome staining (left panel) shows hypoxic cells increase in collagen synthesis. Micro-CT (right top panel) shows hypoxic cells increase in trabecular formation. DEXA (right bottom panel) shows hypoxic cells increase in bone mineral density. (C) For in vivo fat formation, cells were mixed with basic FGF and transplanted in NOD-SCID mice for 4 weeks. Oil Red O staining shows hypoxic cells increase in the accumulation of fat droplets. (D) For in vivo cartilage formation, cells were encapsulated in alginate beads and induced in chondrogenic medium for one week followed by transplantation into NOD-SCID mice for 4 weeks. Alcian Blue staining and immunohistochemistry for type II collagen demonstrate hypoxic cells increase in the synthesis of proteoglycan and type II collagen. Bar = 50 μm.
Safety and efficiency of hypoxic culture. (A) Karyotyping analysis shows hypoxic MSCs have normal karyotype. (B) For in vivo bone formation, cells were delivered in ceramic cube and induced in osteogenic medium for one week followed by transplantation under beneath the dorsal skin of NOD-SCID mice for 4 weeks. Mallory trichrome staining (left panel) shows hypoxic cells increase in collagen synthesis. Micro-CT (right top panel) shows hypoxic cells increase in trabecular formation. DEXA (right bottom panel) shows hypoxic cells increase in bone mineral density. (C) For in vivo fat formation, cells were mixed with basic FGF and transplanted in NOD-SCID mice for 4 weeks. Oil Red O staining shows hypoxic cells increase in the accumulation of fat droplets. (D) For in vivo cartilage formation, cells were encapsulated in alginate beads and induced in chondrogenic medium for one week followed by transplantation into NOD-SCID mice for 4 weeks. Alcian Blue staining and immunohistochemistry for type II collagen demonstrate hypoxic cells increase in the synthesis of proteoglycan and type II collagen. Bar = 50 μm.
Hypoxic cells increase the differentiation potential in vivo
Because MSCs have been used for clinical therapy of skeleton diseases such as osteoarthritis, we investigated the potential of transplanted MSCs to differentiate into bone, fat and cartilage in vivo. Mallory's trichrome staining for collagen revealed that the ceramic cube delivered with hypoxic MSCs after osteogenic induction was darkly stained in multiple layers and increased in collagen deposition compared with that delivered with normoxic MSCs after osteogenic induction (Figure 6B left panel). Micro-CT analysis (Figure 6B right top panel) and DEXA measurement (Figure 6B right bottom panel) also revealed that the specimen delivered with hypoxic MSCs increased in trabecular formation and bone mineral density compared with that delivered with normoxic MSCs. Hypoxic cells also exhibited increase in Oil Red O staining when mixed with basic FGF and transplanted in immunodeficient mice (Figure 6C). Hypoxic cells that were encapsulated in alginate beads and induced in chondrogenic medium showed increase in Alcian Blue staining and immunohistochemistry for type II collagen after transplantation into immunodeficient mice (Figure 6D).These data demonstrate the superior efficiency of hypoxic MSCs for skeleton tissue regeneration.
Hypoxic cells increase the bone repairing capacity in vivo
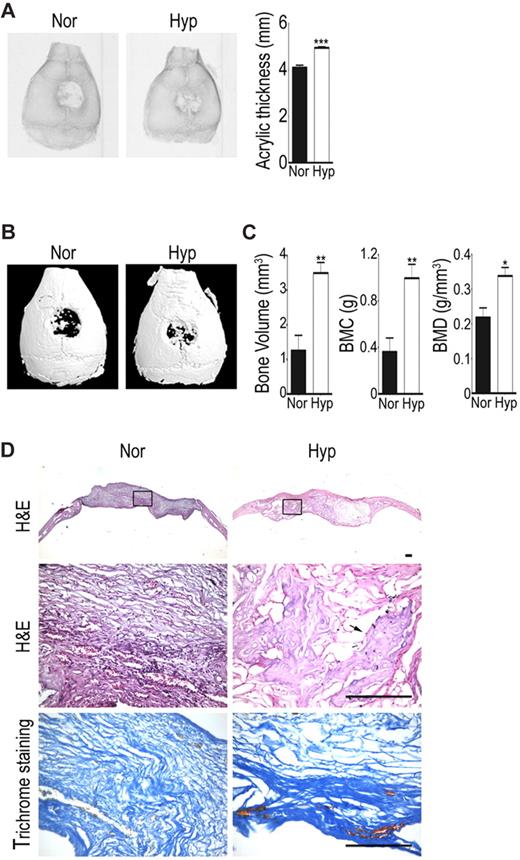
To examine whether hypoxic cells increase bone repairing capacity in vivo, an immunocompromised mice model of a calvarial defect was created to receive a collagen scaffold with normoxic or hypoxic cells. Through quantification of the radiographs of the new bone into acrylic thickness with ImagQuant software, bone formation was found to be increased in the hypoxic cell group at 6 weeks after transplantation compared with the normoxic cell group (Figure 7A). Micro-CT imaging further showed a large amount of newly formed mineralized tissue filling in the defects of hypoxic cell group, while only a small amount of new bone was seen in the defects of the normoxic cell group (Figure 7B). Quantification of newly formed bones showed that the hypoxic cell group had more newly formed bone volume and had greater bone mineral content (BMC) and density (BMD) compared with the normoxic cell group (Figure 7C). Hematoxylin-eosin and Mallory trichrome staining of the calvarial sections at 6 weeks also showed marked bone and collagen formation within sample with hypoxic cells implanted (Figure 7D). These results suggest hypoxic cells increase bone repairing capacity when transplanted in bony defects.
Hypoxic cells increase in vivo bone repairing ability. Calvarial defects were implanted with hypoxic (Hyp) or normoxic cells (Nor). (A) Radiographic images and densitometric analysis were performed at 6 weeks. (B) Micro-CT 3D reconstruction imaging and (C) quantitation for bone volume, bone mineral content (BMC), and bone mineral density (BMD) of newly formed tissues were performed at 6 weeks. The data are expressed as mean ± SEM. Asterisks indicate significant differences: *P < .05, **P < .01, ***P < .005. (D) Samples were harvested for histologic analysis 6 weeks later. Hematoxylin and eosin staining (H&E) for morphologic evaluation (the rectal angle area in the top panel is magnified in the middle panel) and Mallory trichrome staining for collagen deposition in hypoxic and normoxic groups. Photomicrographs were captured using an Olympus AX80 microscope equipped with a Qimaging QiCam digital camera (Qimaging). Original magnifications, 2×/0.13 NA dry objective (top), 20×/0.7 NA dry objective (middle and bottom). Arrow indicates bone area. Bar = 100 μm.
Hypoxic cells increase in vivo bone repairing ability. Calvarial defects were implanted with hypoxic (Hyp) or normoxic cells (Nor). (A) Radiographic images and densitometric analysis were performed at 6 weeks. (B) Micro-CT 3D reconstruction imaging and (C) quantitation for bone volume, bone mineral content (BMC), and bone mineral density (BMD) of newly formed tissues were performed at 6 weeks. The data are expressed as mean ± SEM. Asterisks indicate significant differences: *P < .05, **P < .01, ***P < .005. (D) Samples were harvested for histologic analysis 6 weeks later. Hematoxylin and eosin staining (H&E) for morphologic evaluation (the rectal angle area in the top panel is magnified in the middle panel) and Mallory trichrome staining for collagen deposition in hypoxic and normoxic groups. Photomicrographs were captured using an Olympus AX80 microscope equipped with a Qimaging QiCam digital camera (Qimaging). Original magnifications, 2×/0.13 NA dry objective (top), 20×/0.7 NA dry objective (middle and bottom). Arrow indicates bone area. Bar = 100 μm.
Discussion
Expansion of many cells preserving their self-renewal capacity and the differentiation potential is essential for the successful use of stem cells in clinical practices. Although the low-density culture of MSCs efficiently increases cell numbers at each passage, based on the current data, changes in proliferation capacity, senescence markers, gene expression profile, and differentiation potential were even noted in very early passages. Although MSCs seeded at a density of approximately 1 × to 4 × 10³/cm2 and subcultured at a ratio of 1 to 3 or 5 could preserve the proliferation capacity and differentiation potential for many passages,28 to obtain sufficient cells for cell therapy is time-consuming and delays the treatment. Developing a superior protocol exploiting the advantages of each culture method to expand MSCs has therefore attracted much research interest.29 The current protocol of combining low-density with hypoxic culture successfully expanded a great amount of efficient MSCs in a short time, and therefore can be applied in clinical practices. Methods enhancing lifespan or stem cell properties of MSCs include retroviral transduction of the human telomerase gene,30 HPV16 E6E7,31 and the combined use of growth factors in a serum-free culture.32 All these methods either need genetic modification or enrich cells with oncogenic potential.33 The protocol presented here takes advantage of MSCs privileged ability to survive under hypoxia without aberrant genetic and biologic changes.34 Based on the normal karyotype and intact genetic integrity, and the avoidance of tumors formation upon transplantation, the protocol presented here is safe to expand MSCs for clinical application.
This report further demonstrated hypoxia can prevent proliferation senescence, increase proliferation capacity, lifespan, and maintain stem cell properties of MSCs via HIF-1α-induced TWIST expression. The contribution of HIF-1α to hypoxia-induced prevention of premature senescence has also been demonstrated in embryonic fibroblasts.35 We also demonstrated that TWIST, through direct binding to E-boxes of E2A promoter, suppressed the E2A transcription to inhibit p21 expression. In addition, knockdown of p21 induced cell growth and increased stem cell properties under normoxia. The E2A-p21 pathway plays an important role in B-cell development and induces cell-cycle arrest involved in differentiation of various cell types.18 Previously, senescence of MSCs was found to be closely associated with the expression of the p16INK4A gene.6 We further demonstrated the up-regulation of E2A in expanded MSCs, which in turn induced p21 to cause cell-cycle arrest and replicative senescence. The expansion-induced senescence of MSCs, however, could be reversed under hypoxic conditions, such as those of the bone marrow environment, by a signaling pathway involving the suppression of E2A-p21 by HIF-TWIST. TWIST increases cancer cells with stem cell properties via inducing EMT.15,16 No differences were found in the expression of EMT markers between normoxic and hypoxic MSCs (data not shown). To our knowledge, this is the first paper demonstrating the regulation of normal stem cell properties by TWIST via direct regulation of E2A-p21 pathway, rather than modulating EMT.
Importantly, hypoxic MSCs decreased in DNA methylation of the promoter regions of OCT-4 and NANOG and increased in the expression of OCT-4A, NANOG, SOX-2 and SSEA-4 compared with normoxic MSCs. Moreover, MSCs decreased in the mRNA levels of these genes when induced for differentiation. Although the expression levels of these genes in MSCs are lower than in ES cells, they are much higher than in 293T cells. The expression levels were similar with previous reports for human MSCs.36 Because the expression of these genes in MSCs or adult stem cells is related to the differentiation status and expansion condition,36 the expression of these genes in MSCs carries biologically relevance implications. However, these are still only correlations, and definitive proof awaits further experiments in the future. In addition,overexpression of p21 under hypoxia reduced the expression of OCT-4A, NANOG and SOX-2, while knockdown of p21 under normoxia increased the expression of OCT-4A, NANOG and SOX-2. These data suggest p21 plays a suppressive role in the expression of these genes in MSCs under different oxygen concentrations. Currently, the mechanism that p21 mediated to regulate these pluripotency genes still remains unclear. Notably, the level of OCT-4A or NANOG inversely correlated with the level of p21 in cells treated with p21-specific siRNAs, but no stringent correlation was observed between the levels of SOX-2 and p21. One possible explanation is the specific function of SOX-2, which has been first known as a molecular rheostat for the repression of its own transcription, and the expression of SOX-2:OCT-3/4 target genes through the binding of its C-terminus to the binding sites for SOX-2 and OCT-3/4.37
Recently, hypoxia has been reported to enhance the undifferentiated status and stem cell properties via the interaction of HIF with Notch intracellular domain to block the activation of Notch-responsive promoters in various stem and precursor cell populations.38 In the current study, HIF-1α activated TWIST to suppress specific signaling pathways such as E2A-p21 and promote the expression of transcription factors such as OCT-4A, NANOG, and SOX-2 that control stem cell self-renewal and multipotency. Recently, the putative role of HIF-TWIST pathway in tumorigenesis and tumor metastasis has been recognized in several cancers, including breast cancer and head and neck cancer.15,17 This study identified a beneficial role of HIF-TWIST pathway in increasing lifespan, enhancing expression of embryonic transcription factors and promoting stem cell properties in stem cells.
With the conflict of HIF-TWIST in turmorigenesis of tumor and lifespan or stem cell properties of stem cells, emphasis should be placed on explaining why the activation of HIF-TWIST pathway did not induce tumorigenic transformation of MSCs. TWIST is constantly overexpressed in Mycn-amplified neuroblastomas, where TWIST overexpression is responsible for inhibiting the ARF/p53 pathway involved in the Myc-dependent apoptotic response. The oncogenic cooperation of these 2 key regulators of embryogenesis causes cell transformation and malignant outgrowth.14 The fact that neither amplification of Mycn nor changes in the p53 level and apoptotic response have been noted between hypoxic and normoxic conditions or HIF-TWIST activation may help to explain why HIF-TWIST did not induce tumor formation in MSCs. Overexpression of TWIST has also been reported to generate tumor cells with properties of stem cells by inducing EMT,15 or help oncogenic transformation16 by inhibiting senescence, induced by mitogenic oncoproteins, such as Ras or ErbB2, and inducing EMT. The fact that no changes in EMT expression were observed between hypoxic and normoxic conditions can help to explain why HIF-TWIST did not induce tumor formation in MSCs. For future application of hypoxic culture and HIF-TWIST pathway in increasing the stem cell properties of stem cells, we need to further clarify the underlying mechanisms of HIF-TWIST-mediated pathway.
Besides inhibiting senescence and stimulating stem cell properties, hypoxic culture also inhibited serum-deprivation-induced apoptosis in MSCs.39 In addition, MSCs cultured under hypoxic condition increased their expression of HIF-1α, and its downstream genes, CX3CR1 and CXCR4, and their engraftment in vivo.34 Therefore, the lifespan, efficiency, and stem cell properties of MSCs can be controlled by modifying the culture conditions or the corresponding signaling pathways. Hypoxic culture or activation of HIF-TWIST pathway may provide a great amount of MSCs with improved efficiency for clinical applications.
The online version of this article contains a data supplement.
The publication costs of this article were defrayed in part by page charge payment. Therefore, and solely to indicate this fact, this article is hereby marked “advertisement” in accordance with 18 USC section 1734.
Acknowledgments
Partial assistance was provided by the Division of Experimental Surgery of the Department of Surgery, Taipei Veterans General Hospital.
This work was supported by grants from the Veterans General Hospital (Taipei, Taiwan; V98C1-009, V98E1-002, and V99E1-011); the National Science Council (Taipei, Taiwan; 95-2314-B-075-047-MY3; 97-3111-B-010-001-, 98-3111-B-010-001-), and the National Yang-Ming University, Ministry of Education, Taipei, Taiwan.
Authorship
Contribution: C.C.T. participated in conception and design, collection or assembly of data, data analysis and interpretation, manuscript writing, and final approval of manuscript; T.L.Y. and L.L.C. collected or assembled data; Y.J.C., J.Y.W., and C.H.C. performed data analysis and interpretation; and S.C.H. participated in conception and design, data analysis and interpretation, manuscript writing, and final approval of manuscript.
Conflict-of-interest disclosure: The authors declare no competing financial interests.
Correspondence: Shih-Chieh Hung, MD, PhD, Department of Medical Research and Education, Veterans General Hospital-Taipei, 201, Sec 2, Shih-Pai Rd, Taipei, 11217, Taiwan; e-mail: hungsc@vghtpe.gov.tw.

