Abstract
In the current study, we identified 2 genetic markers for susceptibility to chronic myeloid leukemia (CML) using a genome-wide analysis. A total of 2744 subjects (671 cases and 2073 controls) were included, with 202 Korean CML patients and 497 control subjects enrolled as a discovery set. Significant findings in the discovery set were validated in a second Korean set of 237 patients and 1000 control subjects and in an additional Canadian cohort of European descent, including 232 patients and 576 control subjects. Analysis revealed significant associations of 2 candidate loci, 6q25.1 and 17p11.1, with CML susceptibility, with the lowest combined P values of 2.4 × 10⁻⁶ and 1.3 × 10⁻¹², respectively. Candidate genes in those regions include RMND1, AKAP12, ZBTB2, and WSB1. The locus 6q25.1 was validated in both Korean and European cohorts, whereas 17p11.1 was validated only in the Korean cohort. These findings suggest that genetic variants of 6q25.1 and 17p11.1 may predispose one to the development of CML.
Introduction
Chronic myeloid leukemia (CML) is a rare, clonal myeloproliferative disorder characterized by enhanced proliferative capacity and prolonged survival of hematopoietic stem cells and reduced apoptosis. CML has relatively low incidence rates, from 0.6 to 2.0 cases per 100 000 persons, and its incidence does not appear to differ between Western and East Asian countries. The formation of the B-cell receptor-ABL oncogene, which codes for a constitutively active Bcr-Abl fusion tyrosine kinase on the Philadelphia chromosome (Ph), contributes to the pathogenesis of CML. Although Bcr-Abl fusion tyrosine kinase is a key molecular marker of CML, it is still unclear which molecular or cellular events initiate the leukemogenesis of CML or drive translocation of the B-cell receptor-ABL gene.
Several genome-wide association studies have successfully revealed the associations between genetic variants and certain types of hematologic malignancies, including chronic lymphocytic leukemia,1,2 acute lymphoblastic leukemia,3-5 and therapy-related myeloid leukemia.6 Previous association studies for CML suggest that the BCL2 gene polymorphism is related to CML susceptibility.7 However, a genome-wide approach has never been used to identify genetic markers of CML risk. Accordingly, in the present study, we attempted to find genetic markers of CML susceptibility using a genome-wide analysis with a total of 2744 subjects (671 cases and 2073 controls).
Methods
Participants
A total of 202 Korean CML patients and 497 control subjects were recruited for use as a discovery set. A second Korean set of 237 patients and 1000 control subjects was used to replicate our findings. Another set was recruited for independent validation and consisted of 232 patients and 576 control subjects from Canada of European descent. The study was approved by the Institutional Research Board at the Samsung Medical Center, Sungkyunkwan University, Seoul, Korea.
Genotyping
A total of 906 530 single nucleotide polymorphisms (SNPs) were genotyped using the Affymetrix Genome-Wide Human SNP Array 6.0 (Affymetrix). Yields of pure, double-stranded genomic DNA were determined using the QIAamp DNA blood Maxi Kit (QIAGEN). Peripheral blood samples were taken during the course of therapy, usually when or after achieving complete cytogenetic response and after informed consent was obtained in accordance with the Declaration of Helsinki. Samples were normalized to 50 ng/μL, and the normalized genomic DNA (5 μL) from each sample was used as a template for Affymetrix Version 6.0 assays. Genotyping reactions were performed using Affymetrix Genome-Wide Human SNP Nsp/Sty, Version 6.0 kit reagents and protocols. Genotypes were called using the Birdseed algorithm of the Affymetrix Genotyping Console Version 3.0.2. After genotyping, SNPs that showed erroneous genotype clustering patterns were excluded by visual inspection. One sample with a missing genotype rate > 5% was excluded from analysis. We also excluded 192 348 SNPs with > 1% missing genotypes, 274 345 SNPs with a minor allele frequency (MAF) < 5%, and 6532 SNPs that showed significant deviations from Hardy-Weinberg equilibrium (HWE; P < .001) in controls. In the end, a total of 456 522 autosomal SNPs in 201 cases and 497 controls were examined. For validation using the Korean cohort, a total of 88 SNPs were genotyped in 237 cases and 1000 controls using the MassARRAY system (Sequenom). Genotypes for SNPs that deviated from HWE in the validation set were confirmed by sequence analysis (Applied Biosystems), and SNPs of discordant genotypes were excluded in the analysis. A total of 9 SNPs that were validated in the Korean cohort were genotyped again for validation in the European cohort.
Statistical analysis
The population structures of our samples were examined to confirm genetic homogeneity and assess stratification using the multidimensional scaling method.8 Affymetrix Version 6.0 data for East Asian (JPT + CHB), Caucasian (CEU), and African (YRI) populations from the International HapMap Project was used for multidimensional scaling analysis. The genomic inflation factor (λ) was calculated based on median χ2 statistic. Associations between SNP markers and disease susceptibility were tested using Cochran-Armitage trend tests with one degree of freedom. To select loci for further investigation, we searched for candidate regions in which the minimum P values were < 5.0 × 10⁻⁵ and > 5 SNPs with P < .001 within 1 Mb. For validation in the Korean cohort, we selected a set of 88 nonredundant SNPs, which included 39 SNPs that passed quality control among the top 50 SNPs and 49 additional SNPs with P < .001 in the candidate regions. We selected 9 of the 88 SNPs with P < .05 for further validation in the European cohort. All statistical analyses, including association analyses, were performed using PLINK Version 1.06.9 Linkage disequilibrium structure was assessed using HaploView Version 4.1.10 We also performed SNP imputation to increase genome-wide coverage for further analyses. IMPUTE program Version 1.0.0 was used to impute 633 644 polymorphic SNPs that were not covered by the Affymetrix Version 6.0 array.11 The reference panel used for imputation was composed of 90 known JPT + CHB haplotypes from the Inter-national HapMap Project data (phase 2 Public Release #22 NCBI Build 36).
Results
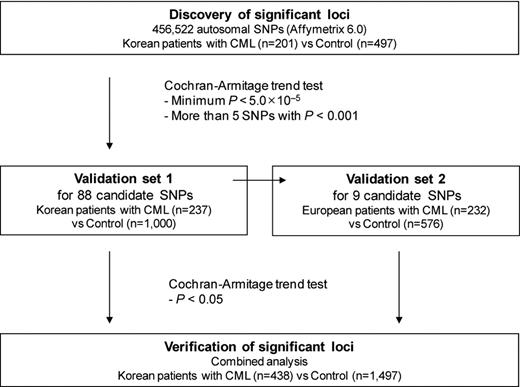
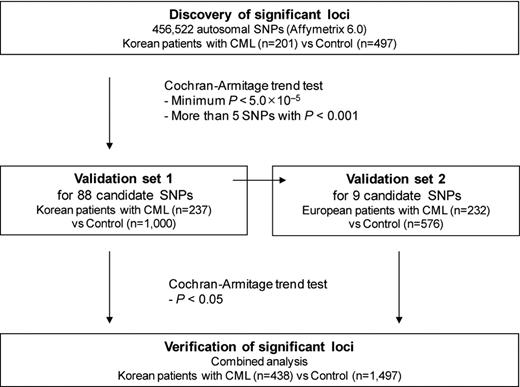
A total of 671 CML patients and 2073 control subjects of Korean and European descent were enrolled in our study to identify common genetic variants associated with CML (Figure 1).
Discovery set
In the discovery stage, we evaluated 456 522 common SNPs (MAF > 5%) for 201 cases and 497 controls in the Korean discovery set. Multidimensional scaling analysis demonstrated that the genetic variations exhibited by the Korean subjects overlap with those from JPT and CHB and are clearly distinct from CEU and YRI, according to the International HapMap Project data (supplemental Figure 1, available on the Blood Web site; see the Supplemental Materials link at the top of the online article). The distributions of observed P values for association tests across all SNPs tested showed no evidence of overall systematic bias (λ = 1.024) from the expected P values, and the excess of low P values was consistent with the presence of true associations (quantile-quantile plot; supplemental Figure 2). These observations indicate that our samples are genetically homogeneous and that significant associations are attributable to genetic differences in CML susceptibility.
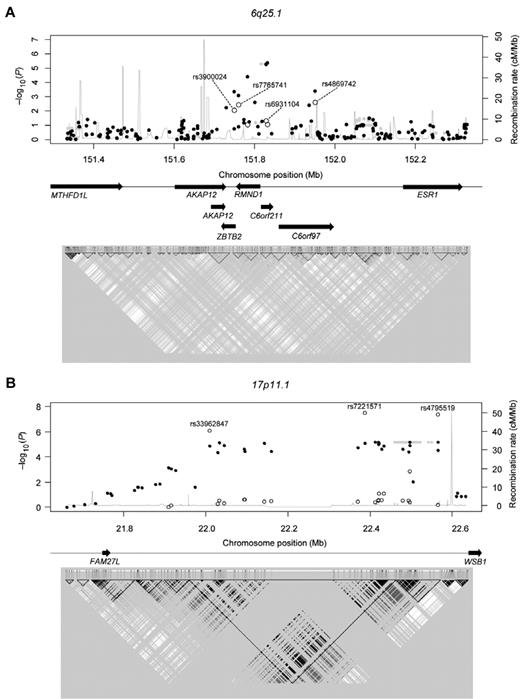
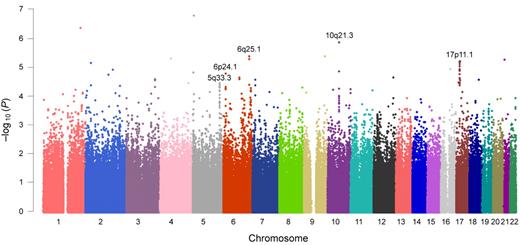
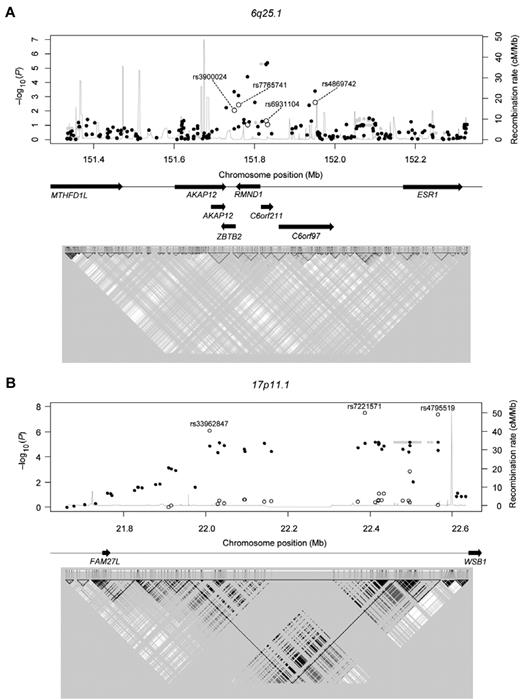
In genome-wide association analysis within the Korean discovery set (n = 698), a total of 56 SNPs with P < 5.0 × 10⁻⁵ (Cochran-Armitage trend test) were identified (the top 50 SNPs are listed in supplemental Table 1). Five loci fulfilled our criteria for significance (minimum P < 5.0 × 10⁻⁵ and P < .001 in more than 5 SNPs within 1 Mb): 5q33.3, 6p24.1, 6q25.1, 10q21.3, and 17p11.1 (Figure 2; supplemental Table 2). Minimum P values of 3.5 × 10⁻⁵ to 1.4 × 10⁻⁶ were observed for each locus. Approximately 18 annotated genes, including the potentially cancer-related candidate genes of RMND1, AKAP12, ZBTB2, EBF1, CTNNA3, and WSB1, were located on or near these loci. Regional association plots of the typed and imputed SNPs around the 5 loci revealed clusters of significant association peaks in the same regions (Figure 3; supplemental Figure 3).
Manhattan plot of genome-wide association results.P values are from the Cochran-Armitage trend test. For further validation, we selected genomic regions in which more than 5 SNPs with P < .001 within 1 Mb were observed and the minimum P value was less than 5.0 × 10⁻⁵. The 5 selected genomic loci are shown in this figure.
Manhattan plot of genome-wide association results.P values are from the Cochran-Armitage trend test. For further validation, we selected genomic regions in which more than 5 SNPs with P < .001 within 1 Mb were observed and the minimum P value was less than 5.0 × 10⁻⁵. The 5 selected genomic loci are shown in this figure.
Regional association plots. (A) 6q25.1 (B) 17p11.1 P values are from the Cochran-Armitage trend test. ● represents genotyped SNPs in the discovery set; and ○, genotyped SNPs in the validation set. The rs numbers of the validated SNPs are provided in Table 1. Gray shaded circles represent imputed SNPs; and gray line, recombination rates (estimated using the HapMap combined data). Arrows indicate the locations of genes. (Bottom panel) A linkage disequilibrium map based on r2 values computed using the HapMap JPT + CHB data.
Regional association plots. (A) 6q25.1 (B) 17p11.1 P values are from the Cochran-Armitage trend test. ● represents genotyped SNPs in the discovery set; and ○, genotyped SNPs in the validation set. The rs numbers of the validated SNPs are provided in Table 1. Gray shaded circles represent imputed SNPs; and gray line, recombination rates (estimated using the HapMap combined data). Arrows indicate the locations of genes. (Bottom panel) A linkage disequilibrium map based on r2 values computed using the HapMap JPT + CHB data.
Validation set
Validation studies were performed in cohorts of Korean (additional set of 237 CML cases and 1000 controls) and European (232 cases and 576 controls) descent for 88 SNPs, including 39 of the top 50 SNPs and 49 additional SNPs from the 5 significant loci. Locus 6q25.1 was validated in both Korean and European cohorts. Four SNPs on 6q25.1 (rs4869742, rs7765741, rs3900024, and rs6931104) showed significant associations in both validation sets (Table 1). The P values of the SNPs ranged between 5.5 × 10⁻⁶ and 8.4 × 10⁻⁴ in the discovery set, 2.6 × 10⁻³ and 5.0 × 10⁻² in the Korean validation set, 2.4 × 10⁻⁶ and 2.8 × 10⁻⁵ in the pooled set of Korean cohorts, and 1.4 × 10⁻³ and 2.3 × 10⁻³ in the European validation set (Table 1; supplemental Table 3), whereas rs4869742 was excluded from the analysis in the European validation set because of significant deviation from HWE. The directions of associations in the European set were identical to those in the Korean discovery and validation sets, and the associations were still significant after Bonferroni correction, suggesting that the locus 6q25.1 is associated with susceptibility to CML across populations.
For a selected representative SNP, rs7765741, the T allele frequency of cases in the combined Korean set was lower than that of controls (0.35 vs 0.44), and a similar trend was also observed in the European set (0.67 vs 0.75), although the T allele frequencies were higher than in Korean set. The odds ratio was 0.69 (95% confidence interval, 0.59-0.81) and 0.68 (95% confidence interval, 0.53-0.85) in Koreans and Europeans, respectively.
Among the candidate SNPs, 3 in 17p11.1 (rs7221571, rs4795519, and rs33962847) remained significant in the Korean validation set (P values: 3.3 × 10⁻⁸ to 8.0 × 10⁻⁷; Table 1), even after Bonferroni correction (P values: 2.9 × 10⁻⁶ to 7.0 × 10⁻⁵), but not in the European validation set. The significances of these 3 SNPs were enhanced when the Korean discovery and validation sets were pooled (P values: 1.3 × 10⁻¹² to 5.6 × 10⁻¹⁰). For the most significant SNP, rs4795519, the MAF in cases and controls was 0.37 and 0.52, respectively, with an odds ratio of 0.54 (95% confidence interval, 0.46-0.64). Regional association plots indicated that the locus is located near the 5′-end of the WSB1 gene (Figure 3). The significant SNPs are located in a strong linkage disequilibrium block that has been identified in East Asian samples. The −log10(P) values abruptly dropped when they crossed a recombination hotspot that is located in the upstream region of WSB1 (Figure 3).
Discussion
The key finding of the present study is that the chromosomal loci, 6q25.1 and 17p11.1, are associated with susceptibility to CML. In the discovery set, 5 chromosomal loci (6q25.1, 17p11.1, 5q33.3, 6p24.1, and 10q21.3) were initially identified as candidate sites (minimum P value: P = 3.5 × 10⁻⁵ to P = 1.4 × 10⁻⁶). Locus 6q25.1 was validated not only in an additional Korean cohort, but also in a Caucasian cohort. Several genes are located within a 1-Mb region of the locus 6q25.1, including ZBTB2, RMND1, C6orf211, C6orf97, and AKAP12 (Figure 3). Recently, 6q25.1, which is upstream of estrogen receptor 1 gene, was revealed to be associated with breast cancer susceptibility.12 However, it is not known whether ZBTB2, RMND1, C6orf211, C6orf97, and AKAP12 are involved in tumorigenesis, particularly in CML.
ZBTB2 is a POK family transcription factor and a potent repressor of the ARF-HDM2-p53-p21 pathway in cell cycle regulation.13 ZBTB2 can inhibit p53 binding and repress transcriptional activation by p53. Therefore, ZBTB2 could potentially be a master control gene of the p53 pathway.13 ZBTB2 is also a potent transcriptional repressor of the cell cycle arrest gene p21 that inhibits p53 and Sp1.13 Thus, ZBTB2 might be involved in leukemogenesis via deregulation of the p53 pathway. ZBTB2 SNPs, especially those upstream of ZBTB2, appear to be significantly associated with CML susceptibility. Further functional studies of ZBTB2 are needed to elucidate the role of ZBTB2 in CML leukemogenesis based on the results of the current study.
Another candidate gene is AKAP12/gravin, which is down-regulated not just in CML, but also in acute myeloid leukemia and myelodysplastic syndromes, suggesting the association of AKAP12 gene expression with myeloid neoplasm leukemogenesis.14 In addition, inactivation of AKAP12 is associated with tumor growth suppression.15 The chromosomal position of the SNP with the lowest P value in 6q25.1 is near the 3′-untranslated region of AKAP12 (Figure 3).
In addition, the association of the locus 17p11.1 with CML susceptibility was validated in the additional Korean cohort in which 3 SNPs (rs7221571, rs4795519, and rs3396847) were significant (P = 3.3 × 10⁻⁸ to P = 8.0 × 10⁻⁷), but the loci was not validated in the Caucasian cohort. Of the genes near the significant peak, the 5′-end of a candidate gene, WSB1, is located. Although its precise function is still unknown, WSB1 is associated with resistance to apoptosis, cell cycle acceleration, and protection from cell death induced by cellular stresses, such as DNA damage and genotoxic stress.16,17 In addition, changes in copy number of WSB1 are related to overexpression of WSB1 and are associated with the survival of neuroblastoma patients.18 Furthermore, WSB1 is known to be involved in the progression of pancreatic cancer.19 Although the 17p11.1 locus (on which WSB1 is located) was only significantly associated with CML susceptibility in the Korean population, it cannot be completely ruled out as a CML risk locus and further validation studies should be conducted.
Because of the relatively low incidence of CML (0.6-2.0 cases per 100 000 persons), it is difficult to recruit a large number of cases (> 1000) for genome-wide association studies. In the present study, a total of 2744 subjects were recruited, including 671 cases and 2073 controls. To the best of our knowledge, this study performed genome-wide analysis on the largest number of CML patients. Another strength of our study is that we validated our findings across ethnicities.
In conclusion, the present study identified 2 chromosomal loci, 6q25.1 and 17p11.1, that are associated with CML susceptibility. SNPs in the 6q25.1 locus were associated with CML in cohorts of both Korean and European descent, whereas SNPs at the 17p11.1 locus were associated with CML only in the Korean cohort. Our findings may provide new insights into the pathophysiology of CML and suggest a basis for CML disease prediction and therapeutics.
The online version of this article contains a data supplement.
The publication costs of this article were defrayed in part by page charge payment. Therefore, and solely to indicate this fact, this article is hereby marked “advertisement” in accordance with 18 USC section 1734.
Acknowledgments
This work was supported by the Basic Science Research Program through the National Research Foundation of Korea funded by the Ministry of Education, Science and Technology (NRF-2010-0010208), and the Korea Healthcare Technology R&D Project, Ministry of Health & Welfare, Republic of Korea (A092255). Hyeoung-Joon Kim was supported by the Korea Health 21 R&D Project, Ministry of Health & Welfare, Republic of Korea (A010385).
Authorship
Contribution: D.H.K. and J.-W.K. designed the study; D.H.K., S.-T.L., H.-H.W., and J.-W.K. performed data analyses and interpreted the results; H.-H.W. conducted statistical and bioinformatic analyses; S.K. and M.-J.K. supervised statistical analyses; Hee-Jin Kim, S.-H.K., Hyeoung-Joon Kim, Y.-K.K., S.K.S., J.H.M., and C.W.J. helped collect data for the Korean cohort; J.H.L. was responsible for data collection from the Canadian cohort and experimental validation procedures; D.H.K., S.-T.L., and H.-H.W. wrote the manuscript; and all authors contributed to the final version of the manuscript.
Conflict-of-interest disclosure: The authors declare no competing financial interests.
Correspondence: Dong Hwan (Dennis) Kim, Department of Hematology/Oncology, Samsung Medical Center, Sungkyunkwan University School of Medicine, Ilwon-dong 50, Gangnam-gu, Seoul, Korea, 135-710; e-mail: drkiim@medimail.co.kr; and Jong-Won Kim, Department of Laboratory Medicine and Genetics, Samsung Medical Center, Sungkyunkwan University School of Medicine, Ilwon-dong 50, Gangnam-gu, Seoul, Korea, 135-710; e-mail: culture.jkim@gmail.com.
References
Author notes
D.H.K., S.-T.L., and H.-H.W. contributed equally to this study.

