Abstract
MSI2 is highly expressed in human myeloid leukemia (AML) cell lines, and high expression of MSI2 mRNA is associated with decreased survival in AML, suggesting its use as a new prognostic marker. To test this, we measured MSI2 protein level by immunohistochemistry in 120 AML patients. Most cases (70%) showed some nuclear or cytoplasmic positivity, but the percentage of positive cells was low in most cases. Despite this, MSI2 protein expression was negatively associated with outcome, particularly for patients with good cytogenetic subgroup. For practical diagnostic purposes, the strongest significance of association was seen in cases with > 1% of cells showing strong MSI2 staining, these having a very poor outcome (P < .0001). Multivariate analysis with cytogenetic category, age, white cell count, and French-American-British subtype demonstrated that nuclear MSI2 levels were independently predictive of outcome (P = .0497). These results confirm the association of MSI2 expression with outcome in AML at the protein level and demonstrate the utility of MSI2 protein as a clinical prognostic biomarker. In addition, although positive at some level in most cases, its prognostic power derived from few positive cells, supporting its role in control of normal hematopoietic stem cell function and highlighting its role in disease progression.
Introduction
The Musashi (MSI) gene family members, MSI1 and MSI2, located on chromosomes 12 and 17, respectively, encode for a group of RNA-binding proteins that bind, via 2 ribonucleoprotein-type RNA recognition motifs in their N-termini, to consensus motifs in mRNAs to inhibit transcription.1-3 They specifically target developmental transcriptional factors and cell cycle regulators.4 They are expressed in stem cells,5-7 and their expression has been associated with aggressive behavior in a range to tumors, including gliomas,8 pediatric brain tumors,9 breast cancer,10 and colorectal cancer.11 Musashi 2 (MSI2) appears to be preferentially expressed over MSI1 in hematopoietic stem cells (HSCs), where it is crucial for HSC renewal and long-term hematopoietic engraftment.12 Hope et al,12 using an RNAi screen, showed that MSI2 was required for HSC repopulation and that overexpression increased long-term engraftment. In this context, the expression of MSI2 was associated with up-regulation of cell cycle genes (RAS, MITOGEN-ACTIVATED PROTEIN KINASE, CYCLIN D1, and MYC) and with homeobox genes, including MEIS1, HOXA9, and HOXA10.
More recently, MSI2 has been shown to be highly expressed in human myeloid leukemia cell lines, in which its depletion leads to decreased proliferation and increased apoptosis.13 Initially identified as a fusion partner of HOXA9 in chronic myeloid leukemia (CML) in accelerated phase or blast crisis,1 its expression is associated with blast crisis in CML.13,14 This is of particular interest given its association with up-regulation of HOXA9 on forced expression.14 Kharas et al13 reported its higher expression in gene expression data from CML patients in blast crisis compared with those in chronic phase, whereas Ito et al14 found its expression to be predictive of poor prognosis in CML. Kharas et al13 studied the role of MSI2 in leukemogenesis, showing that it positively regulates HSC proliferation and inhibits differentiation to mature blood cells, with resultant promotion of leukemogenesis. Furthermore, interrogation of gene expression data showed that high levels of MSI2 mRNA were associated with decreased survival in patients with AML, leading the authors to propose its use as a new prognostic marker.13
To validate the prognostic potential of this biomarker and to test its utility in the routine clinical setting, we measured MSI2 protein level by immunohistochemistry in 120 AML patients using a tissue microarray (TMA).
Methods
Sample selection
Presentation bone marrow trephine samples from 192 patients diagnosed with acute myeloid leukemia (AML) between 1994 and 2005 were retrieved from the histopathology archives at Manchester Royal Infirmary. All trephine biopsy samples were routinely processed, formalin-fixed, paraffin-embedded, and ethylenediaminetetraacetic acid-decalcified at presentation. All material used was residual diagnostic tissue, anonymized, and consent for its use in research granted (LREC study number 01/298).
TMA construction
TMAs were prepared using an ATA 100 tissue array machine (Chemicon International). For this, cylindrical cores 1.5 mm in diameter were taken from paraffin-embedded bone marrow trephine samples using a hollow needle and inserted into a precisely spaced “recipient” paraffin wax block. Cores were obtained from areas showing leukemic infiltration on H&E staining. Each TMA contained between 20 and 24 different patient samples. From each patient, sample 3 cores were removed and placed at different sites of the TMA block to maximize separation between related cores within a TMA. A total of 14 TMAs were prepared. Sections were cut from the TMA blocks and mounted onto coated glass slides. Each core from each patient contained at least 20% leukemic blasts and was representative of the whole trephine sample.
Immunohistochemistry
Immunohistochemistry was performed using 4-μm-thick formalin-fixed, paraffin-embedded tissue sections, baked onto coated slides overnight. Briefly, slides were soaked in xylene, passed through graded alcohols, and put in distilled water. Slides were then pretreated with 1.0mM citrate, pH 6.0 (Invitrogen), in a steam pressure cooker (Decloaking Chamber; BioCare Medical) as per the manufacturer's instructions followed by washing in distilled water. All further steps were performed at room temperature in a hydrated chamber. Slides were pretreated with Peroxidase Block (Dako United Kingdom) for 5 minutes to quench endogenous peroxidase activity. For MSI2, monoclonal rabbit anti–human MSI2 antibody (Abcam, clone: EP1305Y; catalog no. ab76148) was applied 1:2000 in DAKO diluent for 1 hour (Dako United Kingdom). Slides were washed in 50mM Tris-Cl, pH 7.4, and detected with anti–rabbit Envision+ kit (Dako United Kingdom) as per the manufacturer's instructions. After further washing, immunoperoxidase staining was developed using a diaminobenzidine chromogen (Dako United Kingdom) and counterstained with hematoxylin.
MSI2 protein expression measurement
MSI2 protein expression, assayed by Envision+-disclosed immunopositivity, was measured both manually by H-scoring by a hematopathologist (R.J.B.) and automatically using an Aperio image analysis system (Vista). Both of these methods measured the percentage of cells showing cellular or nuclear positivity for MSI2 at 1+, 2+, or 3+ of intensity, as detailed in “Manual H-score measurement” and “Automatic Aperio measurement of percentage MSI2 positivty.”
Manual H-score measurement
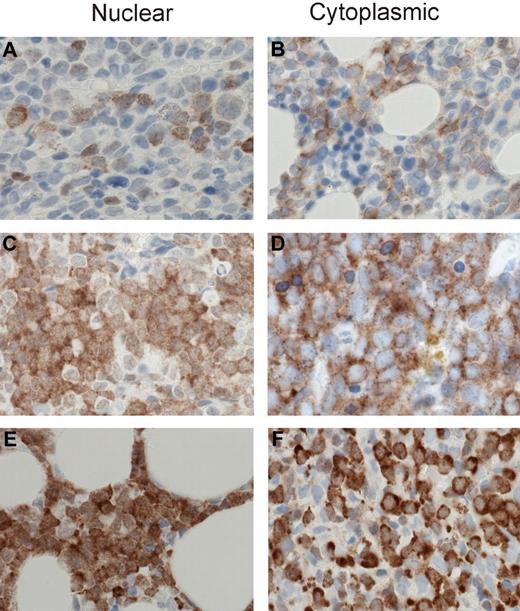
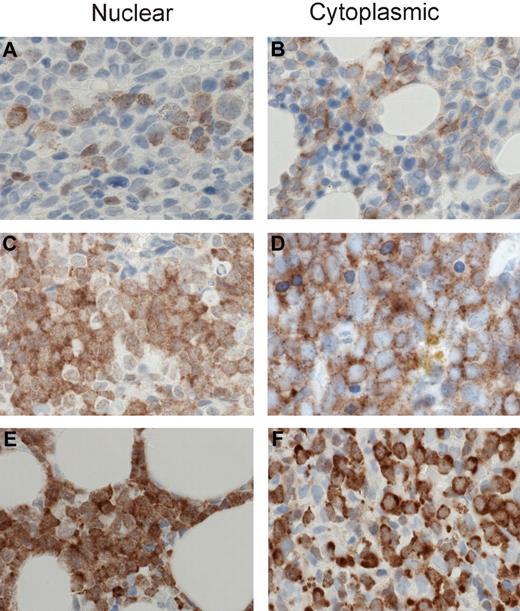
Slides were viewed by a hematopathologist (R.J.B.) using a Nikon Eclipse 55i microscope (Nikon Instruments Europe) and the percentage of cells positive for MSI2 at 1+, 2+, or 3+ intensities (representative images at each intensity are shown in Figure 1) estimated for each TMA core, from which an H-score (0-300) was calculated for each core using the formula H = (3 × percentage positivity at 3+) + (2 × percentage positivity at 2+) + (1 × percentage positivity at 1+); H-scores (0-300) were generated for both cytoplasmic and nuclear positivity and a combined H-score (0-600) generated for each core by addition of the H-scores for the nuclear and cytoplasmic compartments.
MSI2 staining intensities. Representative images are shown for 1+, 2+, and 3+ MSI2 staining in the nuclear and cytoplasmic compartments. Specifically, 1+ intensity is shown for nuclear (A) and cytoplasmic (B) staining, 2+ intensity for nuclear (C) and cytoplasmic (D) staining, and 3+ intensity for nuclear (E) and cytoplasmic (F) staining. (A-F) Original magnification ×400; sections were stained with diaminobenzidine and H&E. Manual analysis derived H-scores for nuclear and cytoplasmic MSI2 staining (as detailed in “Methods”) and Aperio image analysis measured nuclear and total cellular (combined nuclear and cytoplasmic) staining, using the illustrated intensity cut-offs. Micrographs were imaged using a Nikon Eclipse 80i microscope, with a Nikon Plan Apo 40×/0.95 air objective and captured using a Nikon DS-F digital camera with NIS-Elements D 3.1 software, with manipulation in CorelDRAW X3.
MSI2 staining intensities. Representative images are shown for 1+, 2+, and 3+ MSI2 staining in the nuclear and cytoplasmic compartments. Specifically, 1+ intensity is shown for nuclear (A) and cytoplasmic (B) staining, 2+ intensity for nuclear (C) and cytoplasmic (D) staining, and 3+ intensity for nuclear (E) and cytoplasmic (F) staining. (A-F) Original magnification ×400; sections were stained with diaminobenzidine and H&E. Manual analysis derived H-scores for nuclear and cytoplasmic MSI2 staining (as detailed in “Methods”) and Aperio image analysis measured nuclear and total cellular (combined nuclear and cytoplasmic) staining, using the illustrated intensity cut-offs. Micrographs were imaged using a Nikon Eclipse 80i microscope, with a Nikon Plan Apo 40×/0.95 air objective and captured using a Nikon DS-F digital camera with NIS-Elements D 3.1 software, with manipulation in CorelDRAW X3.
Automatic Aperio measurement of percentage MSI2 positivity
MSI2 protein expression was quantified in the TMA cores using an Aperio Scan Scope XT workstation, with ImageScope software. The Aperio Color Deconvolution Version 9 and Aperio Nuclear Version 9 immunohistochemical analysis algorithms, which measure the optical density per cell, were used to measure total cellular and nuclear MSI2 staining, respectively. Both algorithms calculated the percentage of cells positive in each core at 1+, 2+, or 3+ intensity (representative images at each intensity are shown in Figure 1 for total cellular and nuclear positivity, respectively). In addition, an H-score (0-300) was calculated from these percentages using the aforementioned formula for manual H-score measurement.
Statistical analysis
Kaplan-Meier survival analysis and manual H-score measurement.
Initially, Kaplan-Meier overall survival analysis was performed using the cytoplasmic and nuclear H-scores calculated from manual scoring. Analysis was performed using cut-offs at either the median or 75th centile H-score values, analysis being performed splitting the patients into 2 groups with H-scores either equal to or above, or less than, the median or 75th centile values; the median and 75th centiles for the nuclear and cytoplasmic H-score are given in Table 1.
Automatic Aperio measurement of percentage MSI2 positivity.
Secondly, Kaplan-Meier overall survival analysis was performed using the percentage of cells positive for total cellular or nuclear MSI2 at a range of levels of intensity of expression (or weak/1+ staining, medium/2+ staining, or strong/3+ staining), as measured using the Aperio analysis system. Analysis was performed using cut-offs at either the median or 75th centile percentage values, analysis being performed splitting the patients into 2 groups with percentage values either equal to or above, or less than, the median or 75th centile values; the median and 75th centiles for the nuclear and total cellular percentage values are given in Tables 2 and 3. Kaplan-Meier analysis was also performed within the cytogenetic subtypes, using the percentage of cells positive for total cellular or nuclear MSI2 at strong/3+ staining, and splitting the patient groups at the 75th centile, as in “Kaplan-Meier survival analysis and manual H-score measurement.”
Spearman rank correlation and multivariate survival analysis.
Spearman rank correlation was performed for total and nuclear MSI2 expression against French-American-British (FAB) subtype15,16 and cytogenetic category (favorable, intermediate, or poor), and multivariate survival analysis was performed with Cox regression using either total cellular and nuclear MSI2 expression together with cytogenetic category, FAB subtype, white blood cell count (WBC), and age at diagnosis; analysis was performed using either the raw continuous value of MSI2 positivity or a categorical value of MSI2 less than (1) or equal to or above (2) the 75th centile. All statistical analyses were performed using MedCalc Version 11.4.40.
Results
Patients
A total of 192 patient samples were stained; but after filtering for analysis on the basis of the presence of adequate tissue cores on the TMA and a full set of clinical follow-up data, a total of 120 patient samples were available for analysis (60 male, 60 female; age range, 17-83 years at diagnosis; median age, 55 years). Follow-up data were available for up to 5124 days, and 50 patients had died and 70 were still live at the end of the follow-up period. Patient demographics are summarized in Table 4. All patients included received intensive chemotherapy according to standard United Kingdom Medical Research Council AML protocols (Medical Research Council AML12, AML14, and AML15).
MSI2 protein expression level
One core was available for analysis for the majority of the 120 patients analyzed, although 2 cores were present for each patient in some TMAs; in these cases, the average values were taken from the 2 cores.
Manual H-score measurement
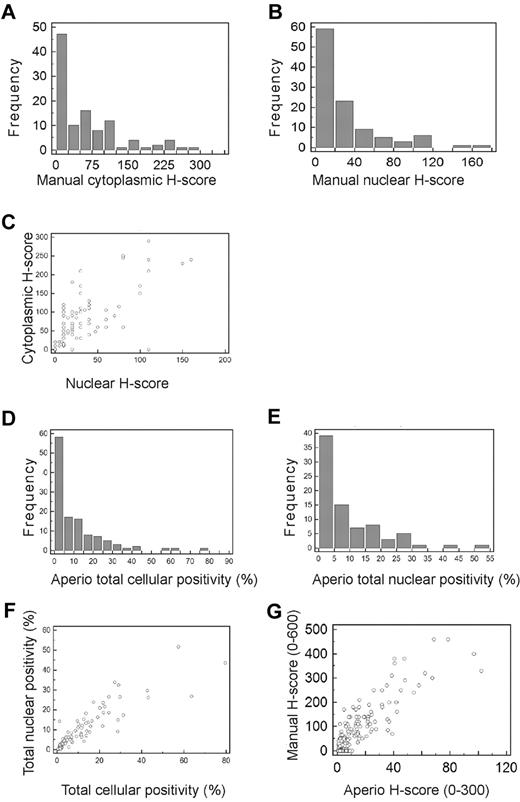
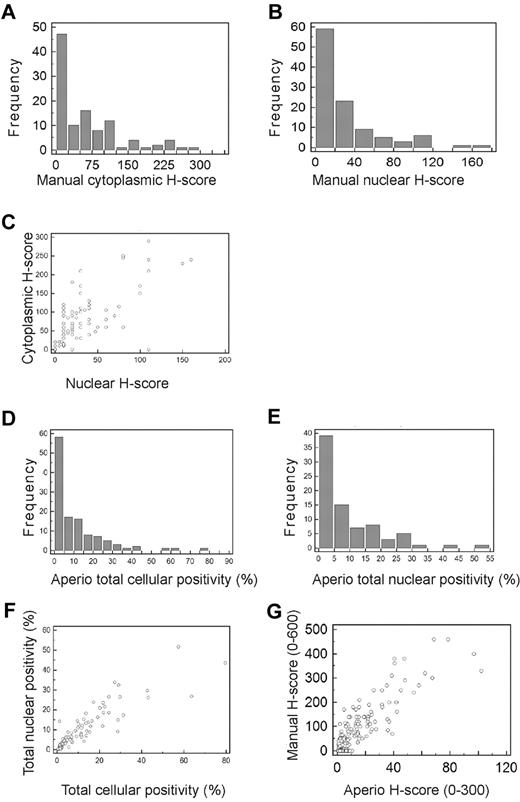
H-scores were generated for 107 of the 120 cases (13 cases were not suitable for scoring), of which 76 (70%) showed at least some nuclear or total cellular staining. The majority of cases had H-scores < 50 (of a maximum of 300) for cytoplasmic staining (Figure 2A), and 20 (of a maximum of 300) for nuclear staining (Figure 2B). There was a high degree of correlation between cytoplasmic and nuclear H-scores (R2 = 0.898; Figure 2C).
Frequency distributions for manual and Aperio data. (A-B) Frequency distributions for manually measured cytoplasmic (A) and nuclear (B) H-scores. The number of cases present with H-scores in each interval are shown by bars, using H-score intervals of 25 for cytoplasmic and 20 for nuclear H-scores. More than 50% of cases had cytoplasmic H-scores < 50, and > 50% of cases had nuclear H-scores < 20. (C) Scatter plot showing relationship between manually measured cytoplasmic and nuclear H-scores demonstrating high degree of correlation between the cytoplasmic and nuclear H-scores (R2 = 0.898). (D-E) Frequency distributions for Aperio measured percentage of cells showing total cellular (D) and nuclear (E) positivity. The number of cases present with percentage positivities in each interval are shown by bars, using percentage intervals of 5 for both total cellular and nuclear percentages. More than 50% of cases had total cellular MSI2 positivity < 5%, and > 50% of cases had nuclear positivity < 10%. (F) Scatter plot showing the relationship between Aperio measured total cellular and total nuclear percentage positivity, demonstrating high degree of correlation between the cellular and nuclear percentage positivities (R2 = 0.8000). (G) Scatter plot showing the relationship between manually measured H-scores (combined cytoplasmic and nuclear scores) and Aperio measured H-scores, demonstrating high degree of correlation between the manually and Aperio measured H-scores (R2 = 0.8795).
Frequency distributions for manual and Aperio data. (A-B) Frequency distributions for manually measured cytoplasmic (A) and nuclear (B) H-scores. The number of cases present with H-scores in each interval are shown by bars, using H-score intervals of 25 for cytoplasmic and 20 for nuclear H-scores. More than 50% of cases had cytoplasmic H-scores < 50, and > 50% of cases had nuclear H-scores < 20. (C) Scatter plot showing relationship between manually measured cytoplasmic and nuclear H-scores demonstrating high degree of correlation between the cytoplasmic and nuclear H-scores (R2 = 0.898). (D-E) Frequency distributions for Aperio measured percentage of cells showing total cellular (D) and nuclear (E) positivity. The number of cases present with percentage positivities in each interval are shown by bars, using percentage intervals of 5 for both total cellular and nuclear percentages. More than 50% of cases had total cellular MSI2 positivity < 5%, and > 50% of cases had nuclear positivity < 10%. (F) Scatter plot showing the relationship between Aperio measured total cellular and total nuclear percentage positivity, demonstrating high degree of correlation between the cellular and nuclear percentage positivities (R2 = 0.8000). (G) Scatter plot showing the relationship between manually measured H-scores (combined cytoplasmic and nuclear scores) and Aperio measured H-scores, demonstrating high degree of correlation between the manually and Aperio measured H-scores (R2 = 0.8795).
Automatic Aperio measurement of percentage MSI2 positivity
Measurement of percentage positive staining, either total cellular or nuclear, using Aperio analysis, demonstrated low percentage positivity at all intensity levels (total staining, or 1+, 2+, or 3+) for most cases, with the majority of cases showing positive staining, either total cellular or nuclear, in < 10% of cells (Figure 2D-E). The median percentage of cells with Aperio detected staining, at any intensity, was 5.45 for total cellular staining and 5.63 for nuclear staining. Positive staining was therefore an infrequent event at the cellular level, by both manual and Aperio measurement. There was a high degree of correlation between total cellular and nuclear percentage positivity (R2 = 0.800; Figure 2F). Interestingly, there was also a high correlation between total cellular positivity as measured by manual H-scoring and Aperio H-scoring (R2 = 0.8795; Figure 2G), indicating concordance between manual pathologist and automated Aperio analysis.
Correlation with FAB and cytogenetics
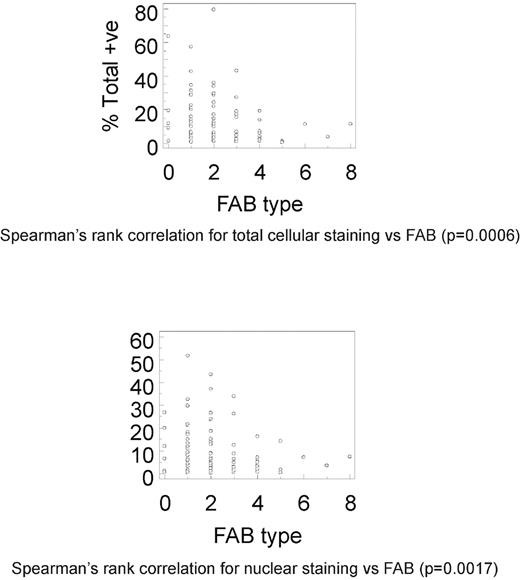
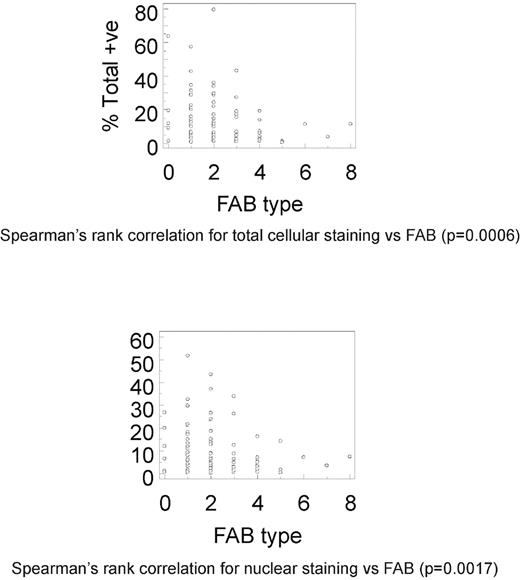
Spearman rank correlation demonstrated significant correlation between total cellular staining and FAB subtype, for all levels of staining (P = .0006), strong/3+ staining (P = .0217), medium/2+ staining (P = .0041), and weak/1+ staining (P = .0005; Figure 3). Similarly, there was significant correlation between nuclear staining and FAB subtype for all levels of staining (P = .0017), medium/2+ staining (P = .0236), and weak/1+ staining (P = .0004); however, strong/3+ staining showed borderline significance (P > .05; Figure 3). There was no significant correlation between either total cellular or nuclear staining, or cytogenetic category at any level of staining.
Correlation of MSI2 expression and FAB subtype. Spearman rank correlations between percentage total cellular (A; P = .0006) or nuclear (B; P = .0017) MSI2 positivity and FAB subtype. Data shown for both total cellular (A) or nuclear (B) MSI2 percentage positivity are for total staining (ie, at any intensity value).
Correlation of MSI2 expression and FAB subtype. Spearman rank correlations between percentage total cellular (A; P = .0006) or nuclear (B; P = .0017) MSI2 positivity and FAB subtype. Data shown for both total cellular (A) or nuclear (B) MSI2 percentage positivity are for total staining (ie, at any intensity value).
Cellular staining pattern
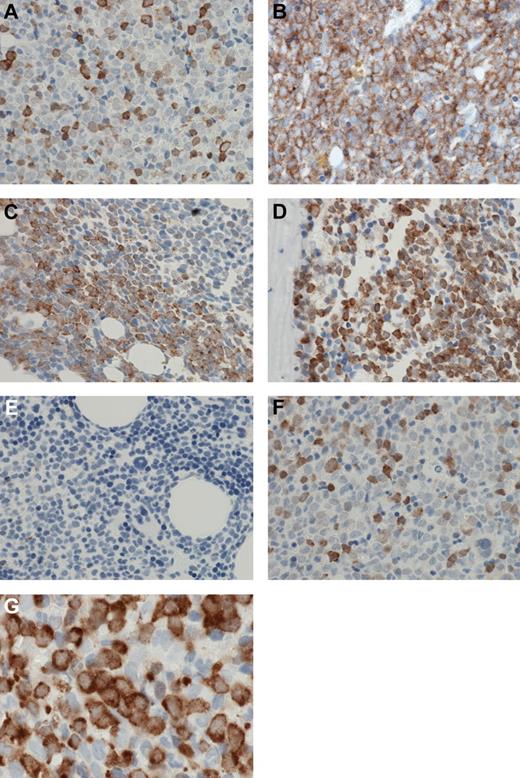
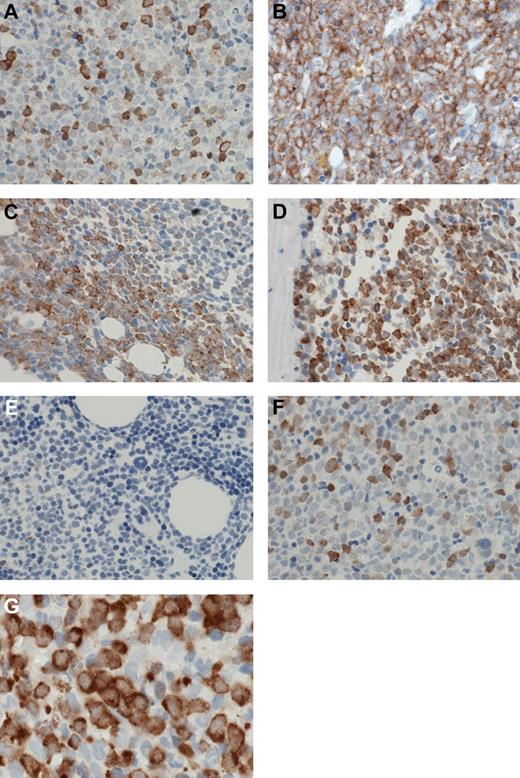
A high level of positive staining was a relatively infrequent cellular event, in either cytoplasmic or nuclear compartments. Positive cells were usually scattered in an interstitial pattern (Figure 4A), although occasional cases showed positive staining in sheets of cells (Figure 4B). However, even these tended to be focal, merging with negative surrounding cells at a watershed (Figure 4C); frequently, such sheets were paratrabecular (Figure 4D). Other cells, including myeloid and erythroid precursors, and megakaryocytes, were negative (Figure 4E). Nuclear staining was as frequent as cytoplasmic staining for any level of staining; although cytoplasmic staining was more frequently strong/3+ than nuclear staining, many cells showing medium or strong cytoplasm staining and weak nuclear staining, whereas cells with strong nuclear staining and weak cytoplasmic staining were infrequent (Figure 4F). In particular, in many cases, large blasts showed strong to medium cytoplasmic staining and weak or negative nuclear staining (Figure 4G).
Patterns of MSI2 expression. (A) MSI2 protein expression was usually present in relatively infrequent cells scattered in an interstitial pattern. (B) Occasional cases showed positive MSI2 staining in confluent sheets of cells. (C) A “watershed” interface was frequently present at the edge of confluent sheets of MSI2-positive cells, and the positive cells merged with negative adjacent cells at an irregular interface. (D) Confluent sheets of MSI2-positive cells were frequently paratrabecular. (E) Admixed non-neoplastic cells, particularly myeloid and erythroid precursors, and megakaryocytes, were negative for MSI2. (F) Occasional cells showed strong nuclear MSI2 staining and weak cytoplasmic staining, but these were infrequent, whereas frequently large blasts showed strong to medium cytoplasmic staining and weak or negative nuclear staining (G). (A-G) Original magnification ×600. Micrographs were imaged using a Nikon Eclipse 80i microscope, with a Nikon Plan APO 60×/1.40 oil objective under oil and captured using a Nikon DS-F digital camera with NIS-Elements D 3.1 software, with manipulation in CorelDRAW X3.
Patterns of MSI2 expression. (A) MSI2 protein expression was usually present in relatively infrequent cells scattered in an interstitial pattern. (B) Occasional cases showed positive MSI2 staining in confluent sheets of cells. (C) A “watershed” interface was frequently present at the edge of confluent sheets of MSI2-positive cells, and the positive cells merged with negative adjacent cells at an irregular interface. (D) Confluent sheets of MSI2-positive cells were frequently paratrabecular. (E) Admixed non-neoplastic cells, particularly myeloid and erythroid precursors, and megakaryocytes, were negative for MSI2. (F) Occasional cells showed strong nuclear MSI2 staining and weak cytoplasmic staining, but these were infrequent, whereas frequently large blasts showed strong to medium cytoplasmic staining and weak or negative nuclear staining (G). (A-G) Original magnification ×600. Micrographs were imaged using a Nikon Eclipse 80i microscope, with a Nikon Plan APO 60×/1.40 oil objective under oil and captured using a Nikon DS-F digital camera with NIS-Elements D 3.1 software, with manipulation in CorelDRAW X3.
Survival analysis
Manual H-score measurement.
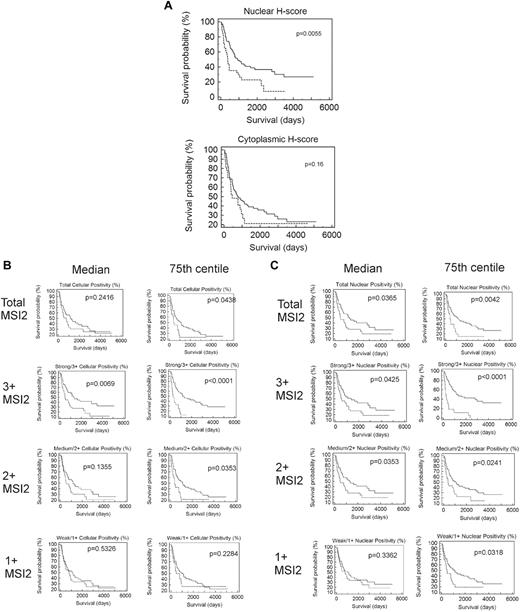
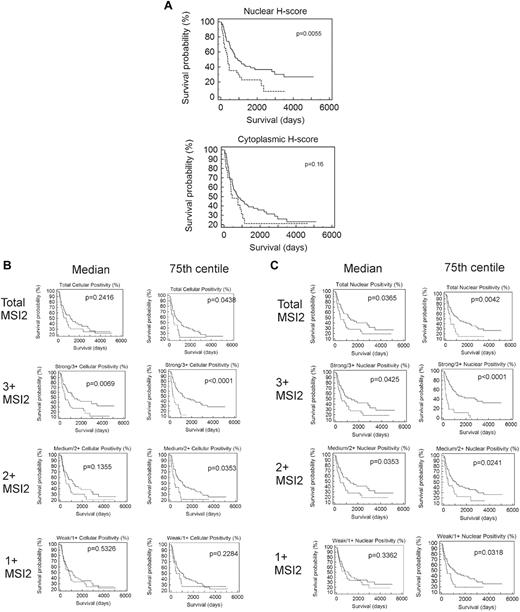
Neither cytoplasmic, nor nuclear, nor combined H-scores were significantly associated with outcome by Kaplan-Meier analysis for values above or below the median (data not shown), although patients with nuclear H-scores in the fourth quartile (≥ 75th centile) had poorer outcome (P = .0055; Figure 5A).
Association of MSI2 expression with outcome. (A) Kaplan-Meier survival analysis based on manually measured cytoplasmic or nuclear H-scores, showing significant association with outcome for nuclear H-scores. Patients with higher nuclear H-scores have poorer outcome (P = .0055) but lack association for cytoplasmic H-scores (P = .16); the patients were grouped by H-score into 2 groups, one with H-scores less than the 75th centile (quartiles 1-3) and one with H-scores equal to or above the 75th centile (quartile 4), with the first quartile used for the lower end of gene expression for each gene. (B) Kaplan-Meier survival analyses based on Aperio measured percentage of cells showing total cellular MSI2 positivity. Analyses are shown for 1+, 2+, or 3+ intensity of staining and using either the median or 75th centile to split the patients into 2 groups. Higher positivity for MSI2 was significantly associated with a poorer outcome at 3+ intensity of staining above either the median (P = .0069) or the 75th centile (P < .0001) and for 2+ intensity above the 75th centile; the most significant association was for patients with 3+ staining above or below the 75th centile (P < .0001), with patients in the fourth quartile having poorer outcome. (C) Kaplan-Meier survival analyses based on Aperio measured percentage of cells showing nuclear MSI2 positivity. Analyses are shown for 1+, 2+, or 3+ intensity of staining and using either the median or 75th centile to split the patients into 2 groups. Higher positivity for MSI2 was significantly associated with a poorer outcome at 3+ or 2+ intensity of staining above either the median (P = .0425 and P = .0353 for 3+ and 2+, respectively) or the 75th centile (P < .0001 and P = .0241 for 3+ and 2+, respectively) and for 1+ intensity above the 75th centile (P = .0318). The most significant association was for patients with 3+ staining above or below the 75th centile (P < .0001), with patients in the fourth quartile having poorer outcome.
Association of MSI2 expression with outcome. (A) Kaplan-Meier survival analysis based on manually measured cytoplasmic or nuclear H-scores, showing significant association with outcome for nuclear H-scores. Patients with higher nuclear H-scores have poorer outcome (P = .0055) but lack association for cytoplasmic H-scores (P = .16); the patients were grouped by H-score into 2 groups, one with H-scores less than the 75th centile (quartiles 1-3) and one with H-scores equal to or above the 75th centile (quartile 4), with the first quartile used for the lower end of gene expression for each gene. (B) Kaplan-Meier survival analyses based on Aperio measured percentage of cells showing total cellular MSI2 positivity. Analyses are shown for 1+, 2+, or 3+ intensity of staining and using either the median or 75th centile to split the patients into 2 groups. Higher positivity for MSI2 was significantly associated with a poorer outcome at 3+ intensity of staining above either the median (P = .0069) or the 75th centile (P < .0001) and for 2+ intensity above the 75th centile; the most significant association was for patients with 3+ staining above or below the 75th centile (P < .0001), with patients in the fourth quartile having poorer outcome. (C) Kaplan-Meier survival analyses based on Aperio measured percentage of cells showing nuclear MSI2 positivity. Analyses are shown for 1+, 2+, or 3+ intensity of staining and using either the median or 75th centile to split the patients into 2 groups. Higher positivity for MSI2 was significantly associated with a poorer outcome at 3+ or 2+ intensity of staining above either the median (P = .0425 and P = .0353 for 3+ and 2+, respectively) or the 75th centile (P < .0001 and P = .0241 for 3+ and 2+, respectively) and for 1+ intensity above the 75th centile (P = .0318). The most significant association was for patients with 3+ staining above or below the 75th centile (P < .0001), with patients in the fourth quartile having poorer outcome.
Automatic Aperio measurement of percentage MSI2 positivity.
Kaplan-Meier analysis demonstrated that strong/3+ or moderate/2+ MSI2 expression was associated with poor outcome for both total cellular and nuclear positivity (Figure 5B-C), using cut-offs at either the median or 75th centiles. However, association with outcome was particularly significant for strong/3+ staining, either total cellular or nuclear when the patient groups were split at the 75th centile, patients with percentage positivity in the fourth quartile having particularly poor outcome (P < .001). These patients showed positivity in > 1.29% of cells for total cellular and in > 0.75% of cells for nuclear staining. Because association of MSI2 positivity was strongest for strong/3+ staining, further Kaplan-Meier analysis was performed within the cytogenetic subgroups, splitting the patient groups at the 75th centile, demonstrating greater significance for those of good prognostic subgroup (P = .0004 for both total cellular and nuclear MSI2), compared with that for patients of intermediate (P = .0314 and P < .0001 for both total cellular and nuclear MSI2, respectively), or unfavorable subgroup (P = .0652 and P = .5345 for both total cellular and nuclear MSI2, respectively); this additional analysis was performed splitting the patients at the 75th centile for strong/3+ staining as this showed the most significant association with outcome in initial analysis (detailed at the start of this paragraph). Multivariate Cox regression survival analysis using the raw continuous value of MSI2, together with cytogenetic subtype, age, FAB subtype, and WBC, showed lack of significance (P = .0781) for total cellular staining, whereas nuclear positivity was independently associated with outcome (P = .0496; Table 5). In addition, however, multivariate survival analysis using MSI2 percentage positivity grouped categorically as either equal or greater, or less than the 75th centile, demonstrated MSI2 as an independent prognostic marker for both nuclear (P = .0002) and total cellular positivity (0.0069; Table 6). Interestingly, when analyzed in this way, MSI2 was the most significant marker among WBC, age, cytogenetic subgroup, and FAB subtype.
Discussion
AML is a disease characterized by uncontrolled proliferation of undifferentiated myeloid cells. The pathogenetic abnormalities underlying leukemogenesis have been intensely studied for many years; and, among the many pathways known to be altered in AML, it is probable that understanding of the normal control of HSC proliferation and differentiation is key to elucidating the initial steps in its development, as well as to identifying aberrant stem cells that may drive the clinical phenotype and subsequent recurrence after treatment.17 MSI2 has recently been shown to be critical in the control HSC proliferation and differentiation, with up-regulation of mRNA leading to increased proliferation of undifferentiated cells in cell culture,12 development of acute leukemia in CML,14 and poor outcome in patients with AML based on gene expression microarray analysis.13 As such, MSI2 may not only be important in the development of AML but has promise as a novel prognostic biomarker and as a possible marker of abnormal stem cells. We measured protein MSI2 expression by immunohistochemistry in an AML TMA composing 120 patients with full clinical follow-up: (1) to validate the prior gene expression correlation with prognosis, (2) to test its utility as a clinical biomarker, and (3) to determine its cellular pattern of expression in situ.
MSI2 expression was measured by both manual H-score measurement by an expert histopathologist (R.J.B.) and computer-assisted Aperio image analysis, with a high degree of correlation between the results for the 2 methods (R2 = 0.8795). The majority of the cases (70%) showed positivity for either nuclear or cytoplasmic staining, and there was high correlation between both nuclear and cytoplasmic staining as assessed by manual H-score analysis and between total cellular and nuclear staining assessed by Aperio analysis. However, the percentage of cells positive in each core was low in the majority of cases, < 10% of cells being positive in the majority of cores (Figure 2A-B). Furthermore, in most cores, positive cells were a minor component of the total cellularity and represented a typically scattered interstitial infiltrate. Despite this, MSI2 protein expression was negatively associated with outcome for both total cellular and nuclear staining, particularly for cases with strong staining. In addition, significance was strongest for those cases with percentage MSI2 positivity values in the fourth quartile (ie, ≥ 75th centile). Cytogenetic subgroup, good, intermediate, or poor, is a strong prognostic marker AML, although there remains a wide range in outcome within cytogenetic subgroups. Consequently, we were interested to determine whether MSI2 expression was further predictive of outcome within cytogenetic subgroups. Kaplan-Meier analysis within cytogenetic subgroups using the percentage positivity of total cellular MSI2 showed the strongest significance within the favorable and intermediate subgroups compared with the unfavorable (P = .0652) subgroup. This is of interest given the need for additional prognostic markers within these cytogenetic subgroups and points to a particularly strong effect of MSI2 over and above the molecular pathways within these subgroups compared with poor-risk cytogenetic patients in whom a more aggressive molecular phenotype exists, and in which any additional effect of MSI2 may therefore be proportionately less. Multivariate analysis demonstrated that raw nuclear MSI2 levels were independently predictive of outcome (P = .0496), whereas both nuclear and total cellular were independently predictive of outcome with high significance when MSI2 values were analyzed categorically as either high or low (P = .0002 and P = .0069, respectively, for nuclear and total cellular MSI2). Furthermore, when categorical values of MSI2 were used in multivariate analysis, MSI2 was the most strongly significant predictor of outcome.
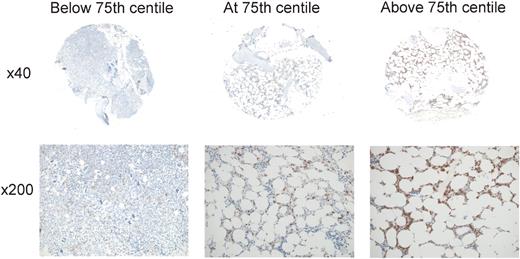
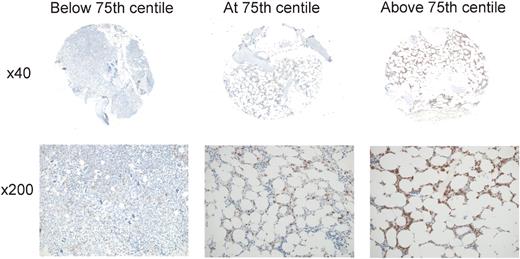
Taken together, these results confirm at the protein level the association of MSI2 expression with outcome in AML previously reported at the mRNA level and demonstrate the utility of MSI2 protein as an independent clinical prognostic biomarker. For practical diagnostic purposes, the strongest significance of association with survival was demonstrated for cases with percentage strong/3+ total cellular or nuclear positivity above or below the 75th centile (75th centiles were 0.75% of cells for nuclear and 1.29% of cells for total cellular staining), cases with values in the fourth quartile having very poor outcome (Figure 6). This group of patients exhibited percentage positivities ranging from 1.29% to 25.4% for total cellular positivity and from 0.75% to 14.1% for nuclear positivity. In essence, therefore, for practical purposes, cases with > 1% of cells exhibiting 3+/ strong staining for either nuclear or total cellular staining had a poorer outcome; the high correlation between manual and automated measurement of MSI2 positivity (R2 = 0.8795) supports its use diagnostically.
MSI2 expression levels associated with outcome. Representative cores are shown for percentage MSI2 positivity below (A), at (B), or above (C) the 75th centile, illustrating the relatively low abundance of positive cells associated with poorer outcome (B-C). For each core, the entire core is shown (original magnification ×40) and a representative inset below (original magnification ×200). Micrographs were imaged using a Nikon Eclipse 80i microscope and captured using a Nikon DS-F digital camera with NIS-Elements D 3.1 software, with manipulation in CorelDRAW X3. For each core the entire core was imaged using a Nikon Fluor Apo 4×/0.13 air objective and a representative high power image with a Nikon Plan Apor 20×/0.75 air objective.
MSI2 expression levels associated with outcome. Representative cores are shown for percentage MSI2 positivity below (A), at (B), or above (C) the 75th centile, illustrating the relatively low abundance of positive cells associated with poorer outcome (B-C). For each core, the entire core is shown (original magnification ×40) and a representative inset below (original magnification ×200). Micrographs were imaged using a Nikon Eclipse 80i microscope and captured using a Nikon DS-F digital camera with NIS-Elements D 3.1 software, with manipulation in CorelDRAW X3. For each core the entire core was imaged using a Nikon Fluor Apo 4×/0.13 air objective and a representative high power image with a Nikon Plan Apor 20×/0.75 air objective.
The MSI proteins are RNA-binding proteins that bind to mRNAs and inhibit transcription.18 The function of MSI2 has not been studied extensively, but MSI1 has been shown to bind to consensus motifs in the 3′-untranslated regions of mRNAs where it interacts with the poly(A)-binding protein and competes for eukaryotic initiation factor-4G,3,4 with resultant inhibition of transcription, including developmental regulators and cell cycle regulators.19 One of these targets, NUMB, is negative regulator of NOTCH,20,21 which is dysregulated in T-ALL.22 MSI2 has been shown to regulate pathways important for control of HSC proliferation and differentiation, including RAS, MITOGEN-ACTIVATED PROTEIN KINASE, CYCLIN D1, MYC, MEIS1, HOXA9, HOXA10, and NOTCH pathway effectors.12,13 MSI2 expression is increased in HSCs compared with their differentiated progeny,12,23 and its control is important in maintaining normal HSC turnover and differentiation.12 In normal human HSCs, MSI2 is up-regulated by HOXA9,14 of importance considering the initial discovery of MSI2 in patients with CML carrying the t(7;17)(p15;q23) translocation, which resulted in a MSl2/HOXA9 fusion gene.1 Furthermore, the combination of BCR-ABL with NUP98-HOXA9 in a mouse model of CML induced blast crisis, showed associated increased expression of MSI2, and decreased expression of NUMB. In contrast increased NUMB was associated with loss of MSI2, inhibition of NOTCH signaling, and suppression of progression of blast crisis. Taken together, these findings indicate modulation of NOTCH by MSI2 and NUMB, which in turn are under the control of HOXA9.17 Specifically, MSI2 is up-regulated by HOXA9 and acts to inhibit NUMB, resulting in loss of negative control of NOTCH. We have separately measured the expression levels of HOXA9 and Meis1 by a novel in situ hybridization method in the same TMA cores as used in the present study,24 although were unable to find significant correlation between MSI2 protein levels and these 2 genes (data shown in supplemental Tables 1-2, available on the Blood Web site; see the Supplemental Materials link at the top of the online article). HOXA9 has also been shown to predict outcome in AML in microarray studies,25-27 whereas MSI2 also appears in a gene signature predicting poor outcome in AML identified by Bullinger et al.28 These previous reports point to the importance of MSI2 in driving development of AML and to its possible role as a clinical biomarker, which is confirmed in the present study.
MSI2 acts as an mRNA binding protein and its effects are largely outside the nucleus, although the protein is present in both nuclear and cytoplasmic compartments. It is of note, therefore, that its expression was strongest in the cytoplasm in the present study. Furthermore, although correlation with outcome was more strongly significant for data acquired via Aperio analysis, significant negative association with outcome was found for manual nuclear H-score, and a trend to significance for manual cytoplasmic H-score. Correlation between manual H-score and automated Aperio measurement of its expression was high, indicating that it is a feasible prognostic biomarker using conventional immunohistochemistry and visual assessment. This feature will facilitate its clinical translation. The pattern of staining observed is also interesting, in that, although it is a strong predictor of outcome (including in multivariate analysis with conventional prognostic markers), the percentage of cells positive for it in each core was low in the majority of cases, a relatively minor increase in the abundance of these cells, and their strength of expression, being key to its prognostic significance. Most cases contained at least some, although < 1%, positive cells; but, comparatively, those cases in which there were more than a scattering of positive cells had poorer outcome. Still, no cases showed uniform staining in all cells; and, even in those with a relatively high percentage of positive cells, the positive cells remained relatively sparse and scattered compared with conventional biomarkers. This first underlines the powerful effect up-regulation of MSI2 has on AML behavior and second reflects the fact that it is probably up-regulated predominantly in stem cells, which in turn could explain the powerful effect of its up-regulation in relatively few cells. Recently, Gentles et al29 have identified a gene expression signature for leukemic stem cells, which was independently associated with poor outcome, indicating the importance of the stem cell population with outcome in AML. MSI2 expression, measured by immunohistochemistry in the present study, may therefore be acting as a proxy for such a stem cell signature, MSI2 expression association with outcome therefore because of the consequent abundance of leukemic stem cells; MSI2, however, did not appear in the signature reported by Gentles et al.29 Stem cells are recognized as important determinants of recurrence and/or poor outcome in cancer, as the stem cell signature in AML reported by Gentles et al29 confirms. Consequent on this, if MSI2 is acting as a proxy for the abundance of stem cells in AML samples, this would explain its strong association with outcome and the finding of its level as the most significant factor in multivariate survival analysis. Because the samples used were archival and collected at time of diagnosis before 2005, it was not possible to measure more recently reported prognostic molecular markers, such as FLT3-ITD, or mutations in CEBPA, NPM1, or WT1. It would be interesting in future studies to investigate the relationship between MSI2 expression and these markers, particularly as they have been reported to be altered in leukemic stem cells.30-33 There are to date no reports of association of MSI2 with these markers, although Moreira et al reported high protein expression of MSI2, measured by immunohistochemistry, in association with KIT in pulmonary small cell carcinoma, 100% of which were positive for both these proteins.34 In contrast, among cases of non-small cell pulmonary carcinoma, MSI2 was present in 25% of adenocarcinomas, 36% of large cell lung cancers, and 45% of squamous cell carcinoma, the differential expression being significant between the histologic subtypes (P = .008).34 Small cell carcinoma is an aggressive tumor that has been reported to express the stem cell markers podocalyxin-like protein 1 and Bmi-1,35 whereas Moreira et al34 found diffuse expression for all the stem cell markers they investigated (KIT, p63, CD133, MSI1, and MSI2) in small cell carcinoma, the other subtypes showing only focal or isolated positivity. It is of interest, therefore, that MSI2 and KIT were both expressed at high levels in small cell carcinoma, which the reports of Moreira et al34 and Koch et al35 indicate a more “stem-like” phenotype than the non-small cell subtypes. Concordant with the hypothesis that MSI2 is preferentially expressed in stem cells, or cells with “stemness,” is the finding of it in occasional paratrabecular sheets because myeloid differentiation normally proceeds from the paratrabecular niche into the intertrabecular space. Furthermore, in CML evolving toward either accelerated phase or blast crisis, blasts typically first accumulate in the paratrabecular compartment before over-running the marrow. Persistence of stem cells after chemotherapy is an important cause of disease recurrence, and identification of such cells in situ is important to guide treatment after induction chemotherapy. Presently, however, there are few markers for such cells, which morphologically are very similar, and mostly identical to, early regenerating myeloid cells. Of note, in the cores examined, there were several examples of cells that morphologically appeared as blasts but did not stain, suggesting that MSI2 may be a marker of residual or recurrent leukemic stem cells in tissue sections, a finding that needs to be tested in follow-up studies.
MSI2 has been shown to be important in development and progression of AML but to date has not been assessed at the protein level in clinical samples. We have demonstrated negative association of MSI2 protein levels with outcome in AML and that its expression can be measured by conventional visualization of immunohistochemistry, indicating its feasibility as a novel clinical biomarker. In addition, although it is positive at some level in the majority of cases, its prognostic power derives from a relatively small number of positive cells, supporting its role in modulation of normal HSC function in AML and highlighting the role of these cells in disease progression.
The online version of this article contains a data supplement.
The publication costs of this article were defrayed in part by page charge payment. Therefore, and solely to indicate this fact, this article is hereby marked “advertisement” in accordance with 18 USC section 1734.
Acknowledgments
The authors thank Dr E. Tholouli, Miss S. McDermott, and Professor J. Hoyland, University of Manchester, for tissue microarray construction; and Mrs L. Griffiths-Davies, Department of Histopathology, Manchester Royal Infirmary, who prepared sections.
Authorship
Contribution: R.J.B. provided experimental design, collected experimental data, analyzed data, and wrote the manuscript; T.C. performed immunohistochemistry and slide scanning and edited the manuscript; E.T. provided clinical support, collated clinical data, and edited the manuscript; S.J.R. helped with experimental design and data analysis and wrote the manuscript; and J.L.K. provided scientific direction, helped with design of experimental plan, and wrote the manuscript.
Conflict-of-interest disclosure: The authors declare no competing financial interests.
The current affiliation for J.L.K. is Infinity Pharmaceuticals, Cambridge, MA.
Correspondence: Richard J. Byers, Department of Histopathology, Clinical Sciences Building One, Manchester Royal Infirmary, Oxford Road, Manchester, M13 9WL, United Kingdom; e-mail: r.byers@manchester.ac.uk or richard.byers@cmft.nhs.uk.

