Abstract
Endothelial cells form the inner lining of vascular networks and maintain blood fluidity by inhibiting blood coagulation and promoting blood clot dissolution (fibrinolysis). Plasmin, the primary fibrinolytic enzyme, is generated by the cleavage of the plasma protein, plasminogen, by its activator, tissue plasminogen activator. This reaction is regulated by plasminogen receptors at the surface of the vascular endothelial cells. Previous studies have identified the plasminogen receptor protein S100A10 as a key regulator of plasmin generation by cancer cells and macrophages. Here we examine the role of S100A10 and its annexin A2 binding partner in endothelial cell function using a homozygous S100A10-null mouse. Compared with wild-type mice, S100A10-null mice displayed increased deposition of fibrin in the vasculature and reduced clearance of batroxobin-induced vascular thrombi, suggesting a role for S100A10 in fibrinolysis in vivo. Compared with wild-type cells, endothelial cells from S100A10-null mice demonstrated a 40% reduction in plasminogen binding and plasmin generation in vitro. Furthermore, S100A10-deficient endothelial cells demonstrated impaired neovascularization of Matrigel plugs in vivo, suggesting a role for S100A10 in angiogenesis. These results establish an important role for S100A10 in the regulation of fibrinolysis and angiogenesis in vivo, suggesting S100A10 plays a critical role in endothelial cell function.
Introduction
Blood clots are continuously forming in the vasculature because of activation of the coagulation process by sluggish blood flow; the presence of tissue debris in the blood, collagen, or lipids; or because of damage to small blood vessels and capillaries.1,2 In various diseases such as atherosclerosis, damage to the normally smooth vascular surface also results in the generation of blood clots. The endothelial cells that form the inner lining of the blood vessels are responsible for ensuring vascular patency by removing these potentially dangerous blood clots. To achieve this goal, the endothelial cells convert the plasma zymogen, plasminogen, to the active serine protease plasmin. The primary function of plasmin is to maintain vascular patency by degrading the fibrin-rich blood clots, a process called fibrinolysis.3,4 Fibrinolysis is a normal vascular process that occurs continuously and is required to prevent naturally occurring blood clots from growing and causing vascular occlusions that would result in heart attack and stroke.5
Proteins that colocalize plasminogen with its activators to the endothelial cell surface are fundamental to the process of fibrinolysis, thereby stimulating the formation of plasmin in a tightly localized and highly regulated fashion.6 Among the protein and nonprotein plasminogen receptors that have been identified is a subset of plasminogen receptors that use their carboxyl-terminal lysine residue to interact with the kringle domains of plasminogen and tissue plasminogen activator (tPA).7-12 Several of these plasminogen receptors, such as α-enolase,13 histone H2B,14 PLG-RTK,15 and S100A10,16 have recently been the focus of detailed studies in which the authors highlighted the importance of plasminogen receptors in the regulation of cellular plasmin generation.
S100A10 is present on the surface of endothelial and other cells in a heterotetrameric complex with its binding partner, annexin A2.17,18 The complex, called the annexin A2 heterotetramer (AIIt), is composed of a dimer of S100A10 that links together 2 molecules of annexin A2. Our laboratory has demonstrated that the phospholipid-binding sites of annexin A2 anchor S100A10 to the cell surface, whereas the carboxyl-terminal lysine of the S100A10 subunits provide the binding sites for tPA (Kd = 0.45μM), plasminogen (Pg; Kd = 1.81μM), and plasmin (Pm; Kd = 0.36μM).19 The annexin A2 subunit may also play a role in Pg binding. However, the binding of Pg to annexin A2 is absolutely dependent on the cleavage of annexin A2 at Lys-307,20 an event that has not been demonstrated to occur on the cell surface in vivo. The role of S100A10 in Pg binding and Pm regulation has been verified by a series of studies in which the authors examined S100A10 function in the absence of annexin A2 in vitro. For example, removal of the carboxyl-terminal lysine from S100A10 attenuates its binding to tPA and Pg, establishing this region of S100A10 as the tPA and Pg binding site.21 The binding of Pg to S100A10 also induces an activator-susceptible conformation in Pg that facilitates the activation of Pg by tPA.19 Furthermore, S100A10 protects Pm from its physiologic inhibitor, α2-antiplasmin, and also protects tPA from its inhibitor, PAI-1.22
By using an in vitro assay that measures the rate of conversion of Pg to Pm by tPA, investigators have shown that recombinant S100A10 stimulated the rate of tPA-dependent activation of Pg by approximately 46-fold compared with a stimulation of 2-fold by recombinant annexin A2 and 77-fold by recombinant AIIt.22 Interestingly, the formation of a complex between S100A10 and a peptide comprising the first 15 amino acids of annexin A2, representing the S100A10-binding site of annexin A2, demonstrated similar activity to recombinant AIIt, suggesting that the binding of annexin A2 to S100A10 stimulates S100A10-dependent Pg activation.22 Other authors have used site-directed mutagenesis to study the role of S100A10 within the heterotetrameric complex. For example, a mutant recombinant AIIt, composed of the wild-type (WT) annexin A2 and a S100A10 subunit deletion mutant missing the carboxyl-terminal lysine residue, possessed ∼ 12% of the WT activity22 and also failed to bind Pg,19 confirming that the carboxyl-terminal lysine residue of S100A10 is the Pg binding site within AIIt.19 It has also been shown that physiologically relevant concentrations of plasma carboxypeptidase N and thrombin-activated fibrinolysis inhibitor (TAFI) are capable of completely ablating the enhancement of Pg activation by AIIt. These enzymes specifically catalyze the removal of the carboxy-terminal lysine residues of S100A10.21 These results suggest that S100A10 is a potent activator of cellular Pm generation and that physiologic mechanisms exist to terminate S100A10-stimulated Pm production and thereby protect cells from the deleterious effect of Pm overproduction.
S100A10 was originally identified as an important regulator of Pm generation by endothelial and cancer cells in vitro.17,23-25 Depletion of S100A10 by RNA interference results in the loss of 65%-95% of cancer cell Pm generation.23,24 The loss of S100A10 from the extracellular surface of HT1080 fibrosarcoma cells also corresponded to a decrease in cellular invasiveness and metastatic potential, suggesting a role for S100A10 in tumor growth and metastasis in vivo.23 Recently, it was reported that macrophage recruitment in response to an inflammatory stimulus was markedly decreased in S100A10-deficient mice compared with WT mice. This finding established that S100A10 is a major mediator of the Pm-dependent component of the inflammatory response in vivo.16 Interestingly, although a role for S100A10 in Pm regulation has been well documented, an in vivo role for S100A10 in endothelial cell function has not been investigated.
Here, we use the recently developed homozygous S100A10-null mouse to investigate the role of S100A10 in endothelial cell function in vivo. We report that S100A10 plays a key role in the fibrinolytic and angiogenic response of endothelial cells in vivo.
Methods
A detailed description of the routine methods is presented in supplemental Methods (available on the Blood Web site; see the Supplemental Materials link at the top of the online article). Only nonroutine procedures and specialized materials are described herein.
Mice
The S100A10-null (S100A10−/−) mice, on a 129SV × a C57BL/6 background, were graciously provided by Svenningsson et al.26 Experimental mice were typically 6-8 weeks of age and comprised both sexes. All animal experiments were performed in accordance with protocols approved by the University Committee on Laboratory Animals at Dalhousie University.
Isolation of primary murine microvascular cells
Lungs were collected from 5 mice, finely diced, digested with Liberase Blendzyme (Roche), and passed through a 100-μm filter (BD Biosciences). Endothelial cells were then isolated by magnetic bead separation by the use of CD146 microbeads (Miltenyi Biotec). Purity was measured by DilAc-LDL (Biomedical Technologies).
Cell culture
Primary endothelial cells and telomerase-immortalized microvascular endothelial (TIME) cells were cultured with EBM-2 media (Lonza). Primary endothelial cells between passages 4 and 8 were used in all studies. T241 fibrosarcoma cells were a generous gift from Dr Y. Cao (Karolinska Instiutet) and were cultured in complete DMEM (Gibco).
Plasmids
pSUPER-retro plasmids were constructed as previously described.25 In brief, TIME cells were transduced with a retroviral shRNA system by the use of shRNA specific for 2 sequences of S100A10 (shRNA 1 and shRNA 5), 1 sequence of annexin A2 (shRNA 4), and a control shRNA scramble sequence (shRNA Scramble).
Transfections
To establish S100A10 and annexin A2 knockdown cell lines, Phoenix packaging cells plated in 25-cm3 flasks were transfected with 4 μg of the pSUPER-retro plasmids described previously via the Lipofectamine 2000 transfection reagent (Invitrogen) according to the manufacturer's instructions. At 48 hours after transfection the TIME cells were infected with the Phoenix cell supernatants, and then at 48 hours after infection, the S100A10 and annexin A2 knockdown cells were selected with 2 μg/mL of puromycin for a minimum of 1 week.
Analysis of protein expression
Proteins were analyzed by Western immunoblot as described in detail in supplemental Methods.
Plasminogen activation
Cells were trypsinized with EDTA-free trypsin and washed 3 × with Dulbecco PBS. 1 × 10⁵ cells were then incubated with 5nM tPA for 20 minutes at 4°C in incubation buffer (HBSS containing 3mM CaCl2 and 1mM MgCl2). The cells were then washed 3 × with incubation buffer and incubated with 0.5μM Glu-Pg and 250μM Pm substrate S2251 (Chromogenix; Diapharma Group). The urokinase-type plasminogen activator (uPA)–dependent plasminogen activation assay was performed with 25nM uPA (Sigma-Aldrich)27 and is described in detail in supplemental Methods. The rate of plasmin generation was measured at absorbance 405 nm every minute for 2 hours via the use of a BioTek ELx808 plate reader.
Plasminogen binding assays
Preparation of FITC-Pg is described elsewhere.16 Cells were washed and cultured in the absence of serum for 2 hours before assay. Cells were trypsinized with EDTA-free trypsin and washed 3 × with DPBS. For carboxypeptidase B (CpB; Worthington Biochemical) treatment, cells were incubated for 20 minutes at 37°C in the presence of 5 U/mL CpB. Cells were then incubated with 200nM FITC Glu-plasminogen, with or without ϵ-ACA (100mM), for 1 hour at 4°C in HBSS (1mM MgCl2 and 3mM CaCl2). Pg binding was measured by FACS analysis.
Cell-surface biotinylation
Cell surface protein levels were analyzed by cell-surface biotinylation as described in detail in supplemental Methods.
Fibrin deposition
Levels of fibrin deposition were determined as previously described.28
Histochemistry and immunohistochemistry
Masson trichrome and immunohistochemical staining of tissues are described in detail in supplemental Methods.
Batroxobin-induced fibrin deposition
WT and S100A10−/− C57BL/6 mice were injected with 25 μCi 125I-fibrinogen (MP Biomedicals) followed by 25 U/kg batroxobin (Pentapharm) by the use of tail vein catheters (Braintree Scientific). Two hours later, blood and tissues were collected and weighed. Gamma counts for the tissues and blood were measured with a Beckman LS 5000TA scintillation counter and corrected for weight.
Neoangiogenesis assay
A total of 750 μL growth factor–reduced Matrigel (BD Biosciences) with 200 ng/mL basic fibroblast growth factor (bFGF; Invitrogen) and 60 U/mL heparin (Calbiochem) added was injected subcutaneously into WT and S100A10−/− C57BL/6 mice. After 7 days, the Matrigel plug was removed and embedded in Tissue Tek Cryo-OCT (Andwin Scientific). Sections were blocked with horse serum (1:20; Gibco) and incubated with an antibody against CD31 (1:250; BD Biosciences) or normal mouse IgG1 (as control; BD Biosciences) at room temperature overnight. Sections were then stained with Alexa-Fluor 488–conjugated rabbit anti–rat (1:2500; Invitrogen) and DAPI. Vessel density was quantified by the use of ImageJ Version 1.42q software (National Institutes of Health).
T241 tumor angiogenesis
T241 tumors were established by subcutaneous injection of 2 × 10⁶ cells, suspended in 100 μL of DMEM (Gibco), containing 10% FBS (Hyclone), in the right flank of 6- to 8-week-old female mice. Tumors were removed from the mice after 3 weeks and embedded in Tissue Tek Cryo-OCT (Andwin Scientific). Sections were blocked with horse serum (1:20; Gibco) and incubated with an antibody against CD31 (1:250; BD Biosciences) or normal mouse IgG1 (isotypic control; BD Biosciences) at room temperature overnight. Sections were then stained with Alexa-Fluor 488–conjugated rabbit anti–rat antibody (1:2500; Invitrogen) and DAPI. Vessel density was quantified with ImageJ Version 1.42q software (National Institutes of Health).
Matrigel invasion and cell migration
Murine WT or S100A10−/− endothelial cells and control or S100A10-depleted TIME cells were loaded (1 × 10⁵ cells/well) into the upper layer of Transwell chambers that were coated with Matrigel (invasion assays) or were uncoated (migration assays; BD Biosciences). Pg (0.5μM), which was prepared as previously described,29 and CpB (5 U/mL) were added to serum-free media in the upper chamber where indicated whereas media with 20% FBS was added to the bottom chamber as chemoattractant. After 48 hours, cells on the underside of the membrane were stained with H&E (Sigma-Aldrich) and counted.
Coagulation assays
The prothrombin time (PT) and activated partial thromboplastin time (aPTT) were determined by the use of an ACL TOP (Beckman Coulter) whereas platelet levels were determined with an LH 755 analyzer (Beckman Coulter). Citrated blood collected from the mice was used for all coagulation assays. Clot lysis assay is described in supple-mental Methods.
Tail vein clip assay
WT and S100A10−/− C57BL/6 mice were anaesthetized with isoflurane, and the bottom 3 mm of the tail was clipped off with a scalpel and the bleeding tail was placed in 37°C saline. Time until bleeding stoppage and rebleeding was recorded.
Statistics
Statistical significance was determined by Student t test or 1-way ANOVA with Tukey multiple comparisons. Results were regarded as significant if 2-tailed P values were < .05. All data are expressed as mean ± SD.
Results
S100A10−/− mice accumulate fibrin in their tissues
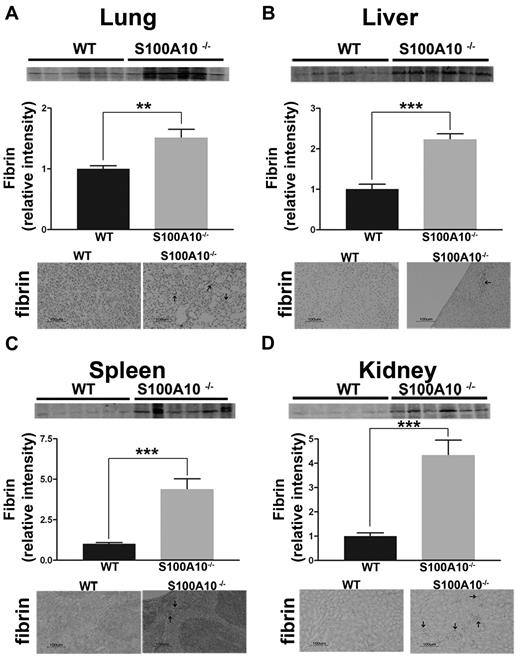
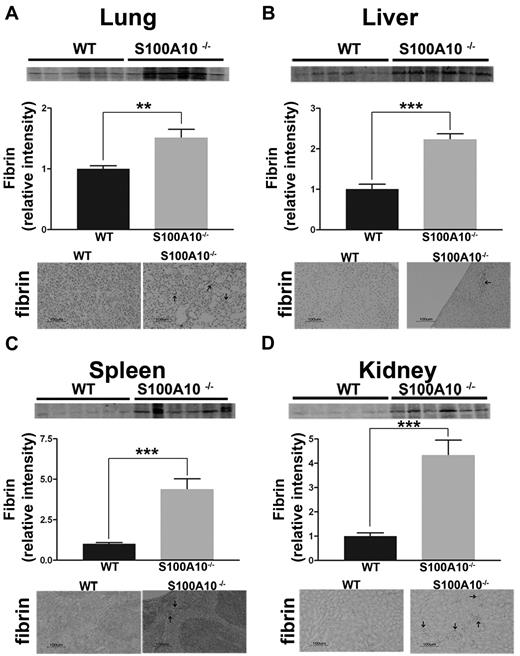
S100A10 has been proposed to be an important regulator of cellular Pm generation.17 Mice with inactivation of the Pg gene do not generate Pm and develop spontaneous fibrin deposition in the tissues because of impaired fibrinolysis.30,31 Therefore, we compared the fibrin content of freshly isolated tissues from WT and S100A10−/− mice. Tissues homogenates were prepared and the fibrin levels were determined by Western blot analysis by the use of an antifibrin antibody. As shown in Figure 1A, tissues from S100A10−/− mice contained significantly greater amounts of fibrin that their WT littermates. Quantification of band intensity revealed 1.8-fold increases of fibrin in lung, a 2.2-fold increase in liver, a 4-fold increase in kidney, and a 4.4-fold increase spleen from the S100A10−/− mice compared with WT controls. Fibrin immunohistochemistry of tissue sections demonstrated areas of fibrin deposition in the S100A10−/− lung (Figure 1A), liver (Figure 1B), spleen (Figure 1C), and kidney (Figure 1D), whereas fibrin-positive staining was not observed in sections from the WT mice. Because this increased accumulation of fibrin in the tissues of the S100A10−/− mice could be the result of either enhanced coagulation or reduced fibrinolytic activity, we further investigated the potential role of S100A10 in coagulation and fibrinolysis. The PT and aPTT values were identical between the WT and S100A10−/− mice (supplemental Figure 1A-B), suggesting that S100A10 depletion does not affect the coagulation pathway.
Loss of S100A10 results in increased tissue fibrin deposition. Lung, liver, kidney, and spleen tissues from 6 WT and S100A10−/− mice were collected, and the fibrin content of tissue lysates was determined by SDS-PAGE and Western blot analysis. A total of 10 ng of each tissue was loaded. Quantification of fibrin deposition was normalized to WT levels. Immunohistochemistry for fibrin was performed on perfused sections of formalin-fixed tissues. Sections were deparaffinized and incubated with antifibrin antibody followed by antirabbit HRP. Arrows indicate areas with fibrin deposition. Tissues observed were lung (A), liver (B), spleen (C), and kidney (D). Statistical analysis was performed with the use of Student t test, and the data are expressed as the mean (±) SEM of 6 independent experiments (**P < .01, ***P < .001). Sections were mounted by the use of Cytoseal 60 mounting media (Richard-Allen Scientific) and viewed with a 20×/0.5 NA objective lens. Images were captured by the Nikon Eclipse E600 microscope with a Nikon DXM1200F camera. Digital acquisition of the images was performed with ACT-1 Version 2.7 software (Nikon). Figures were generated with Adobe Photoshop CS3 Version 10 (Adobe Systems Incorporated).
Loss of S100A10 results in increased tissue fibrin deposition. Lung, liver, kidney, and spleen tissues from 6 WT and S100A10−/− mice were collected, and the fibrin content of tissue lysates was determined by SDS-PAGE and Western blot analysis. A total of 10 ng of each tissue was loaded. Quantification of fibrin deposition was normalized to WT levels. Immunohistochemistry for fibrin was performed on perfused sections of formalin-fixed tissues. Sections were deparaffinized and incubated with antifibrin antibody followed by antirabbit HRP. Arrows indicate areas with fibrin deposition. Tissues observed were lung (A), liver (B), spleen (C), and kidney (D). Statistical analysis was performed with the use of Student t test, and the data are expressed as the mean (±) SEM of 6 independent experiments (**P < .01, ***P < .001). Sections were mounted by the use of Cytoseal 60 mounting media (Richard-Allen Scientific) and viewed with a 20×/0.5 NA objective lens. Images were captured by the Nikon Eclipse E600 microscope with a Nikon DXM1200F camera. Digital acquisition of the images was performed with ACT-1 Version 2.7 software (Nikon). Figures were generated with Adobe Photoshop CS3 Version 10 (Adobe Systems Incorporated).
S100A10−/− mice have impaired fibrinolysis
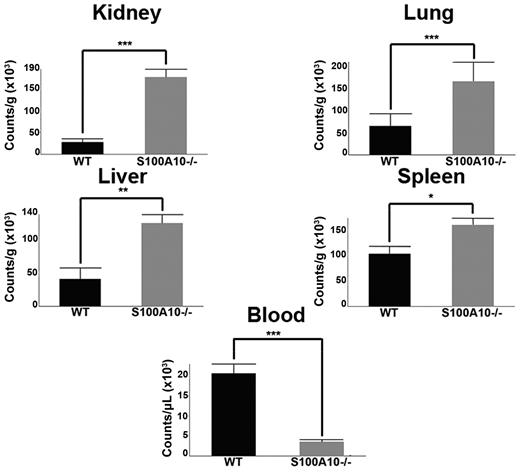
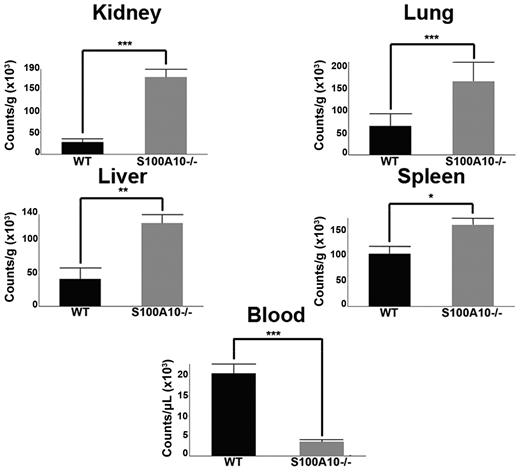
To evaluate fibrinolysis in WT and S100A10−/− mice, 125I-fibrinogen was injected via the tail vein into WT and S100A10−/− mice. After 5 minutes, fibrin clot formation was initiated by the tail vein injection of batroxobin32 and after 2 hours, blood and tissues were collected and total radioactivity was determined. We observed that the tissues of the S100A10−/− mice had significantly greater accumulation of 125I-label than the WT mice and less 125I-label in the blood (Figure 2). For example, the residual radioactivity in the lung tissue of the S100A10−/− mice was 2.5-fold greater than the WT lung tissue and 5-fold lower in the blood. The dramatic loss in the ability of the S100A10−/− mice to degrade a batroxobin-induced clot could be because of a loss in plasma components of the fibrin clot lysis system or the fibrinolytic activity of the endothelium. Therefore, we compared the plasma components of the fibrinolytic system. The platelet and protein levels of plasma Pg and fibrinogen of WT and S100A10−/− mice were similar (supplemental Figure 1C-D). Plasma clots prepared from WT and S100A10−/− mice were then evaluated for their susceptibility to tPA-mediated clot lysis. We observed that neither the time to clot nor the time of clot lysis differed between the WT and S100A10−/− mice (supplemental Figure 1E-F). In addition, no differences were observed in antiplasmin levels, plasmin-antiplasmin complex levels, and thrombin potential between the WT and S100A10−/− mice (supplemental Figure 1G-I). These results are consistent with a loss of fibrinolytic activity of the endothelium in the S100A10−/− mouse.
S100A10−/− mice have impaired ability to clear induced fibrin clots. WT and S100A10−/− mice were injected with 125I-fibrinogen and batroxobin. After 2 hours, tissues were collected, weighed, and radioactivity was measured with a γ counter. The data are expressed as counts per gram of tissue. Statistical analysis was performed with the Student t test, and the data are expressed as the mean (±) SEM of 6 independent experiments (*P < .1, **P < .01, ***P < .001). Figures were generated with Adobe Photoshop CS3 Version 10 (Adobe Systems Incorporated).
S100A10−/− mice have impaired ability to clear induced fibrin clots. WT and S100A10−/− mice were injected with 125I-fibrinogen and batroxobin. After 2 hours, tissues were collected, weighed, and radioactivity was measured with a γ counter. The data are expressed as counts per gram of tissue. Statistical analysis was performed with the Student t test, and the data are expressed as the mean (±) SEM of 6 independent experiments (*P < .1, **P < .01, ***P < .001). Figures were generated with Adobe Photoshop CS3 Version 10 (Adobe Systems Incorporated).
Tail bleeding-rebleeding assay
A short segment of the tail of WT and S100A10−/− mice was clipped and the time until cessation of bleeding was determined. We observed that mice lacking S100A10 had a 4-fold reduction in the bleeding time after the tail clip compared with the WT mice (Figure 3A). Because we observed a decrease in fibrinolysis in the S100A10−/− mice (Figure 2B), and a similar coagulation rate (supplemental Figure 1A-B), the observed reduction in bleeding time by the S100A10−/− mice was likely because of decreased fibrinolysis of the tail clip-induced blood clot. We also observed that the time between cessation of bleeding and the initiation of subsequent episodes of bleeding, the rebleeding time, was of shorter duration and also occurred with less frequency with the S100A10−/− mice (Table 1). This finding suggested that the clots formed by the S100A10−/− mice were more stable than the WT mice, presumably again because of a decreased rate of fibrinolysis.
Bleeding time in WT and S100A10−/− mice. The last 3 mm of the tail of anaesthetized WT and S100A10−/− mice was clipped with a scalpel blade. The clipped tails of the anaesthetized mice were placed in 37°C saline, and the time for cessation of bleeding was recorded (A). Masson trichrome staining was used to observe the morphology of tail sections from WT (B) and S100A10−/− (C) mice. Immunohistochemistry for S100A10 was also performed on tail sections from WT (D) and S100A10−/− (E) mice. Sections were deparaffinized and either subjected to Masson trichrome staining or anti-S100A10 antibody followed by antigoat HRP. Arrows indicate endothelial lining of vessels. Statistical analysis was performed with Student t test, the data are expressed as (±) SEM of 3 independent experiments (***P < .001). Sections were mounted with Cytoseal 60 mounting media (Richard-Allen Scientific) and viewed with a 20×/0.5 NA objective lens. Images were captured by the Nikon Eclipse E600 microscope using a Nikon DXM1200F camera. Digital acquisition of the images was performed with ACT-1 Version 2.7 software (Nikon). Figures were generated with Adobe Photoshop CS3 Version 10 (Adobe Systems Incorporated).
Bleeding time in WT and S100A10−/− mice. The last 3 mm of the tail of anaesthetized WT and S100A10−/− mice was clipped with a scalpel blade. The clipped tails of the anaesthetized mice were placed in 37°C saline, and the time for cessation of bleeding was recorded (A). Masson trichrome staining was used to observe the morphology of tail sections from WT (B) and S100A10−/− (C) mice. Immunohistochemistry for S100A10 was also performed on tail sections from WT (D) and S100A10−/− (E) mice. Sections were deparaffinized and either subjected to Masson trichrome staining or anti-S100A10 antibody followed by antigoat HRP. Arrows indicate endothelial lining of vessels. Statistical analysis was performed with Student t test, the data are expressed as (±) SEM of 3 independent experiments (***P < .001). Sections were mounted with Cytoseal 60 mounting media (Richard-Allen Scientific) and viewed with a 20×/0.5 NA objective lens. Images were captured by the Nikon Eclipse E600 microscope using a Nikon DXM1200F camera. Digital acquisition of the images was performed with ACT-1 Version 2.7 software (Nikon). Figures were generated with Adobe Photoshop CS3 Version 10 (Adobe Systems Incorporated).
We also examined the tails of the mice for other differences that might explain the variations in the bleeding and rebleeding values. Sections of the tails were stained for collagen with Masson trichrome staining (Figure 3B-C), and obvious qualitative differences were not observed, thus suggesting that the collagen levels and architecture of the tails were similar. Because the tail collagen is the major platelet adhesive substratum for initiation of coagulation, these results further support our data suggesting that decreased fibrinolytic activity at the endothelium of the S100A10−/− mice was responsible for the decreased bleeding times. Sections of the tail from the WT and S100A10−/− mice were also stained for S100A10 (Figure 3D-E). As expected, S100A10 did not stain the tail section obtained from the S100A10−/− mice (Figure 3E), whereas S100A10 staining in observed throughout the WT sections, including on the endothelium of the vessels (Figure 3D).
Generation of plasmin by isolated endothelial cells from WT and S100A10−/− mice
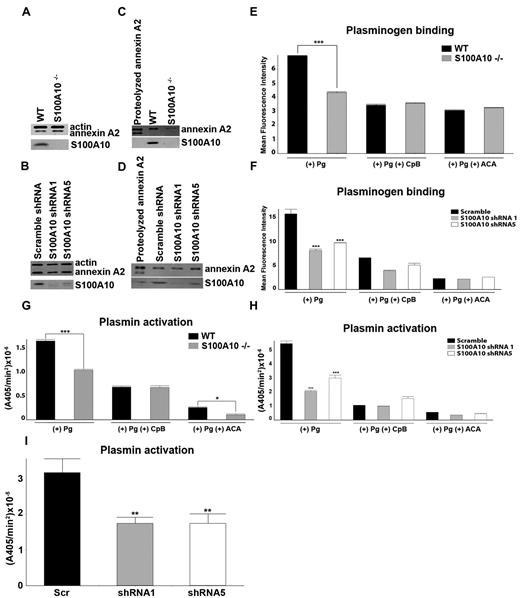
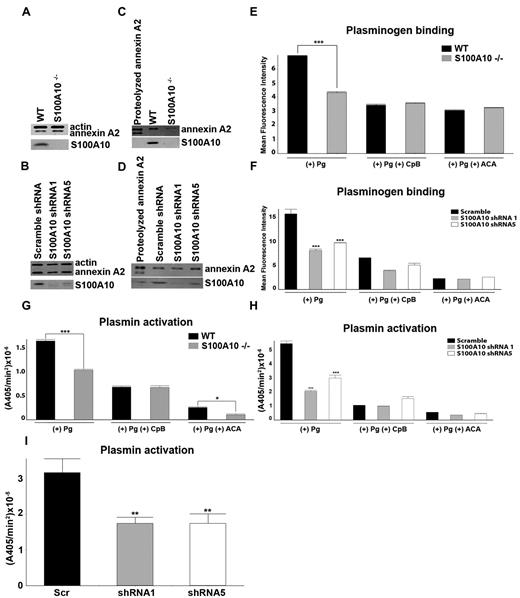
We investigated the possibility that the fibrinolytic defect displayed by the S100A10−/− mice was because of endothelial cell dysfunction. Lung endothelial cells from WT and S100A10−/− mice were isolated. Total annexin A2 levels were unaffected by loss of S100A10 (Figure 4A), whereas cell-surface annexin A2 was depleted in the S100A10−/− cells (Figure 4C). In contrast, the cell surface levels of annexin A2 in the endothelial cell line, TIME, were unaffected by S100A10 depletion (Figure 4D), whereas total annexin A2 levels were also unaltered (Figure 4B). Compared with the WT mice, the endothelial cells from the S100A10−/− mice displayed 40% less Pg binding (Figure 4E) and Pm generation (Figure 4G). We also observed that human endothelial cells that were depleted of S100A10 by RNA interference also bound ∼ 50% less Pg (Figure 4E) and generated 60% less Pm with either tPA (Figure 4H) or uPA (Figure 4I). Pretreatment of the cells with CpB significantly decreased Pg binding and activation, suggesting that these processes are dependent in large part on carboxyl-terminal lysine on the Pg receptors. In this regard, S100A10 was responsible for 76% and 55% of the carboxyl-terminal–dependent Pg binding of the murine and human endothelial cells, respectively. This finding also suggests that although S100A10 is the dominant Pg-binding protein in endothelial cells, other carboxyl-terminal lysine containing Pg receptors also contribute to endothelial cell Pg binding and Pm generation.
Depletion of S100A10 results in decreased endothelial cell plasminogen binding and plasmin generation. To detect the total cellular levels of annexin A2 and S100A10, primary murine endothelial cells, isolated from WT or S100A10−/− mice (A), as well as control and S100A10 depleted TIME cells (B), were dissociated from culture flasks, lysed, subjected to SDS-PAGE, and immunoblotted with antiactin (loading control), antiannexin A2, or anti-S100A10 antibodies. Cell-surface protein levels for primary murine endothelial cells (C) and TIME cells (D), as detected by cell-surface biotinylation, are shown. FITC-Pg binding to the primary murine endothelial cells (E) or TIME cells (F) was measured by FACS. Quantification of flow cytometric analysis of Pg binding was calculated with WinMDI software. Loss of S100A10 affected tPA-dependent plasmin generation by primary murine endothelial cells (G) and TIME cells (H) and uPA-dependent plasmin generation by TIME cells (I). Statistical analysis was performed with the Student t test (E,G) or ANOVA (F,H); *P < .1, **P < .01, and ***P < .001. Figures were generated with Adobe Photoshop CS3 Version 10 (Adobe Systems Incorporated).
Depletion of S100A10 results in decreased endothelial cell plasminogen binding and plasmin generation. To detect the total cellular levels of annexin A2 and S100A10, primary murine endothelial cells, isolated from WT or S100A10−/− mice (A), as well as control and S100A10 depleted TIME cells (B), were dissociated from culture flasks, lysed, subjected to SDS-PAGE, and immunoblotted with antiactin (loading control), antiannexin A2, or anti-S100A10 antibodies. Cell-surface protein levels for primary murine endothelial cells (C) and TIME cells (D), as detected by cell-surface biotinylation, are shown. FITC-Pg binding to the primary murine endothelial cells (E) or TIME cells (F) was measured by FACS. Quantification of flow cytometric analysis of Pg binding was calculated with WinMDI software. Loss of S100A10 affected tPA-dependent plasmin generation by primary murine endothelial cells (G) and TIME cells (H) and uPA-dependent plasmin generation by TIME cells (I). Statistical analysis was performed with the Student t test (E,G) or ANOVA (F,H); *P < .1, **P < .01, and ***P < .001. Figures were generated with Adobe Photoshop CS3 Version 10 (Adobe Systems Incorporated).
We also examined the possible contribution of annexin A2 to endothelial cell Pm regulation. Depletion of annexin A2 by RNA interference reduced TIME cell Pg binding by ∼ 50% and Pm generation with tPA or uPA by ∼ 60% (supplemental Figure 2B-D). These values were similar to the loss in Pg binding and Pm generation observed for S100A10-depleted TIME cells (Figure 4F,H-I). As expected, the depletion of TIME cell annexin A2 by the annexin A2 shRNA also resulted in S100A10 depletion (supplemental Figure 2A). Thus, the similarity between the loss in Pg binding and Pm generation between TIME cells depleted of S100A10 by S100A10 shRNAs, but possessing unaltered levels of annexin A2 (Figure 4F,H) and those depleted of both annexin A2 and S100A10 by the annexin A2 shRNA (supplemental Figure 2B-C) suggested that annexin A2 did not significantly contribute to TIME cell Pg binding and Pm generation under these experimental conditions. Annexin A2 binds Pg via a mechanism that is absolutely dependent on the exposure of a new carboxyl-terminal lysine. The exposure of this lysine residue requires proteolytic processing and the loss of 29 amino acid residues (∼ 3200 Da).20 Therefore, if annexin A2 played a significant role in Pm generation by the TIME cells, it would be expected that the truncated annexin A2 would be the predominant form of annexin A2 on the cell surface of TIME cells. Although we easily detected intact cell surface annexin A2, we were unable to detect any truncated annexin A2 at the cell surface (Figure 4D).
S100A10−/− mice display reduced angiogenesis
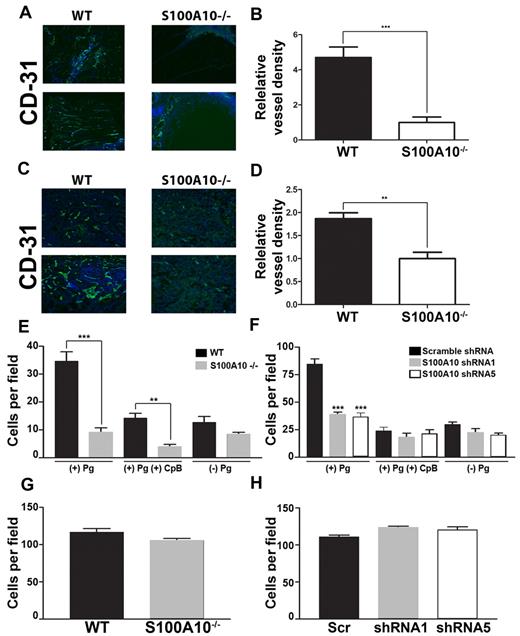
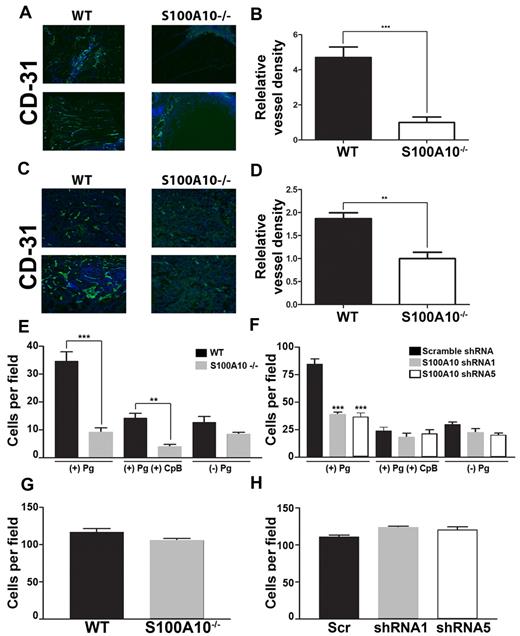
Pm, by virtue of its role in the degradation of extracellular matrix proteins, plays an important role in angiogenesis, and Pg−/− mice show significant defects in angiogenesis.33 To examine the possible role of S100A10 in angiogenesis, we implanted WT and S100A10−/− mice with Matrigel plugs containing bFGF. When known angiogenic factors, such as bFGF, are mixed with Matrigel and injected subcutaneously into mice, endothelial cells migrate into the Matrigel plug and form vessel-like structures. We observed that the Matrigel plugs obtained from the S100A10−/− mice displayed ∼ 79% less endothelial staining compared with the plugs obtained from the WT mice (Figures 5A-B). When T241 tumors grown in the WT and S100A10−/− mice were stained for the endothelial cell marker CD31, we observed ∼ 42% less endothelial staining in the tumors grown in the S100A10−/− mice compared with those grown in the WT mice (Figure 5C-D). These results suggest that angiogenesis was compromised in the S100A10−/− mice.
Role of S100A10 in plasmin-dependent Matrigel invasion. WT and S100A10−/− mice were implanted with a Matrigel plug containing 200 ng/mL bFGF and 60 U/mL heparin. CD31 staining (green) of endothelial cells shows decreased invasion into the matrigel plug in S100A10−/− mice (A). Nuclei were stained with DAPI (blue). Tissue surrounding the matrigel plug is visible in the S100A10−/− sections. Quantification of positive CD31 staining of 20× fields from 3 separate matrigel plugs was performed with ImageJ software (B). T241 fibrosarcoma cells were injected subcutaneously into WT and S100A10−/−. Tumors were collected after 3 weeks. CD31 staining (green) of endothelial cells shows decreased staining of endothelial cells in tumors collected from the S100A10−/− mice (C). Nuclei were stained with DAPI (blue). Quantification of positive CD31 staining of 20× fields from 3 separate tumors was performed with ImageJ software (D). Sections were mounted with Vectashield mounting medium (Vector Laboratories) and viewed using a 20×/0.5 NA objective lens. Images were captured by the Zeiss Axioplan 2 microscope with a Spot 2 digital camera. Digital acquisition of the images was performed with Axiovision 4.7 (Zeiss). Primary WT or S100A10−/− murine endothelial cells (E,G) or control or S100A10-depleted TIME cells (F,H) were added to the top chamber of Transwell chambers in the presence of media and in the presence or absence of Pg (0.5μM). Some chambers were coated with Matrigel (invasion assays; E,F) or uncoated (migration assays; G,H). The lower chambers contained media with 10% FBS. Cells were incubated for 48 hours, after which invading cells were stained with H&E and counted. Data are expressed as mean number of cells per 40× field ± SD of 3 independent experiments. Statistical analysis was performed by use of the Student t test (B,D,E,G) or ANOVA (F,H); ***P < .001. In some experiments cells were pretreated with CpB (5 U/mL), which was added to the upper chamber where indicated. Figures were generated with Adobe Photoshop CS3 Version 10 (Adobe Systems Incorporated).
Role of S100A10 in plasmin-dependent Matrigel invasion. WT and S100A10−/− mice were implanted with a Matrigel plug containing 200 ng/mL bFGF and 60 U/mL heparin. CD31 staining (green) of endothelial cells shows decreased invasion into the matrigel plug in S100A10−/− mice (A). Nuclei were stained with DAPI (blue). Tissue surrounding the matrigel plug is visible in the S100A10−/− sections. Quantification of positive CD31 staining of 20× fields from 3 separate matrigel plugs was performed with ImageJ software (B). T241 fibrosarcoma cells were injected subcutaneously into WT and S100A10−/−. Tumors were collected after 3 weeks. CD31 staining (green) of endothelial cells shows decreased staining of endothelial cells in tumors collected from the S100A10−/− mice (C). Nuclei were stained with DAPI (blue). Quantification of positive CD31 staining of 20× fields from 3 separate tumors was performed with ImageJ software (D). Sections were mounted with Vectashield mounting medium (Vector Laboratories) and viewed using a 20×/0.5 NA objective lens. Images were captured by the Zeiss Axioplan 2 microscope with a Spot 2 digital camera. Digital acquisition of the images was performed with Axiovision 4.7 (Zeiss). Primary WT or S100A10−/− murine endothelial cells (E,G) or control or S100A10-depleted TIME cells (F,H) were added to the top chamber of Transwell chambers in the presence of media and in the presence or absence of Pg (0.5μM). Some chambers were coated with Matrigel (invasion assays; E,F) or uncoated (migration assays; G,H). The lower chambers contained media with 10% FBS. Cells were incubated for 48 hours, after which invading cells were stained with H&E and counted. Data are expressed as mean number of cells per 40× field ± SD of 3 independent experiments. Statistical analysis was performed by use of the Student t test (B,D,E,G) or ANOVA (F,H); ***P < .001. In some experiments cells were pretreated with CpB (5 U/mL), which was added to the upper chamber where indicated. Figures were generated with Adobe Photoshop CS3 Version 10 (Adobe Systems Incorporated).
Endothelial cells from S100A10−/− mice show impaired chemotaxis through Matrigel
The simplest explanation for the inability of the S100A10-depleted endothelial cells to vascularize the Matrigel plug was because of the reduced capacity of these cells to generate Pm and clear a path through the Matrigel plug. We therefore directly examined the ability of the WT and S100A10-null endothelial cells to migrate through a Matrigel layer. These experiments used Boyden chambers in which Pg and endothelial cells isolated from WT or S100A10-null mice were placed in the upper chamber, the insert between chambers was coated with Matrigel, and serum was added to the lower chamber to act as a chemoattractant. We observed that in response to the chemoattractant, 74% fewer S100A10-null endothelial cells migrated across the Matrigel barrier than WT endothelial cells (Figure 5E). CpB treatment decreased migration across the Matrigel barrier of both WT and S100A10-null cells. We also observed that 55% fewer S100A10-depleted TIME cells migrated across the Matrigel barrier than control TIME cells (Figure 5F), and that treatment with CpB also decreased migration across the Matrigel barrier of both control and S100A10-depleted TIME cells. Interestingly, the chemotaxis of the WT endothelial cells was enhanced in the presence of Pg. A comparison of the chemotaxis of the S100A10-null cells in the presence or absence of Pg suggested that S100A10 was responsible for 100% of this Pg-dependent chemotaxis of the S100A10-null cells and similarly for 75% of the Pg dependent chemotaxis of the S100A10-depleted TIME cells. These results suggest that S100A10 plays a key role in the regulation of endothelial cell surface protease activity. Loss of annexin A2 resulted in similar decrease in plasminogen dependent invasion through a matrigel barrier (supplemental Figure 2E).
When chemotaxis assays were repeated in the absence of a Matrigel barrier, the migration of endothelial cells from WT and S100A10-null mice through the inserts was indistinguishable (Figure 5G), as was the migration of the S100A10-depleted TIME cells (Figure 5H). This result establishes that the ability of the S100A10−/− endothelial cells to migrate in response to a chemotactic stimulus was unaffected by genetic ablation of S100A10.
Discussion
Our observation that S100A10−/− mice accumulate fibrin in their tissues is consistent with a role for S100A10 in Pm generation and fibrinolysis. However, fibrin clot accumulation in tissue is a dynamic process that is regulated by both the rate of clot formation (coagulation) and clot dissolution (fibrinolysis). Therefore, fibrin accumulation in the tissues could also be explained by increased coagulation in the S100A10−/− mouse. Because the PT and aPTT assays, which directly measure coagulation, were identical for the WT and S100A10−/− mice, it is unlikely that enhanced coagulation is responsible for the increased accumulation of fibrin in the tissues of S100A10−/− mice.
To directly measure endogenous fibrinolysis in vivo, we injected mice with 125I-fibrinogen followed by injection of batroxobin. Batroxobin is a thrombin-like enzyme that cleaves mainly the fibrinopeptide A from fibrinogen and activates factor XIII only to a slight degree.34 Compared with thrombin-formed fibrin, batroxobin-formed fibrin is more readily lysed by Pm, because it only cross-links fibrin to a minor extent. Furthermore, unlike thrombin, batroxobin does not activate platelets.35 Under our experimental conditions, batroxobin rapidly converts 125I-fibrinogen to 125I-fibrin, which is removed from the blood and retained in the tissues. Pm, which is produced by the endothelium of the tissues, digests the 125I-fibrin and these degradation products are released into the blood. Our observation that the S100A10−/− mice have greater tissue and lower blood radioactivity levels than the WT mice suggests that the S100A10−/− mice have lower rates of fibrinolysis in vivo. Similarly, another group used the batroxobin model system for analysis of fibrinolysis in mice deficient in the TAFI. They reported a reduction of radioactivity in the lungs of TAFI−/− mice, consistent with an increase in fibrinolytic activity in these mice.36
Tail bleeding times have typically been used to provide a measure of hemostasis in vivo, and tail bleeding times in mice are sensitive to both alterations in coagulation37 or fibrinolysis.38 Our observation that bleeding time is reduced in S100A10−/− mice, compared with WT mice, is consistent with the decreased fibrinolysis exhibited by the S100A10−/− mice. Bleeding time has been shown to be significantly increased in the Pg−/− mice compared with WT mice,39 whereas another group found no difference.40 The interpretation of the Pg−/− mice data was complicated by the possible role of Pg in platelet function.39 However, S100A10 has not been detected in platelets, suggesting that loss of S100A10 is unlikely to affect platelet function.41 In support of the decreased bleed time being caused by decreased fibrinolysis is the report that textilinin-1, a potent Pm inhibitor from Pseudonaja textilis venom, dramatically decreases the bleeding time.37
Similarly, the decreased rebleeding time, exhibited by the S100A10−/− mice compared with the WT mice, could be because of increased stability of the fibrin clot because of decreased fibrinolytic attack. The decreased fibrinolytic attack could be mediated by the generation of Pm by the assembly of tPA and Pg on the plasma clot surface or by Pm generated as a consequence of the assembly of tPA and Pg on the surface of the endothelium. Our observation that tPA-dependent plasma clot lysis by WT and S100A10−/− mice is identical would rule out the possibility that neither the assembly of tPA and Pg on the fibrin clot and the generation of Pm by the plasma clot are altered by S100A10 depletion. Therefore, the central defect in the S100A10−/− mice likely involves Pm generation by the endothelium.
Matrigel is an extract of the Engleberth-Holm-Swarm tumor and is composed of basement membrane proteins. The Matrigel plug supports an intense vascular response when supplemented with angiogenic factors, such as bFGF, and is a well-established procedure for measurement of angiogenic responses in mice. Our observation that the Matrigel plugs were poorly vascularized by the S100A10−/− mice compared with WT mice suggests that depletion of S100A10 inhibits angiogenesis. Further evidence for the role of S100A10 in angiogenesis is suggested by the significant reduction in endothelial cell density within T241 tumors grown in the S100A10−/− mice compared with the endothelial density in the WT mice. A role for S100A10 in angiogenesis was also suggested by the dramatic loss in the ability of S100A10-depleted endothelial cells to migrate through Matrigel barriers (Figure 5).
Ling et al have recently developed an annexin A2−/− mouse.28 The homozygous annexin A2−/− mice displayed deposition of fibrin in the microvasculature and incomplete clearance of injury-induced arterial thrombi. Our results support a subsequent publication from He et al in which they report that the loss of annexin A2 also results in the loss of S100A10 in these mice42 (supplemental Figure 2A). The concomitant loss of S100A10 with annexin A2 depletion was also consistent with the reports from several other laboratories.43-47 Because the levels of S100A10 were reduced in the annexin A2−/− mice, it is unclear whether the fibrin deposition observed in the annexin A2−/− mice was because of annexin A2 or S100A10 depletion (or both).
Interestingly, we observed that compared with WT endothelial cells, the S100A0−/− endothelial cells had similar total levels of annexin A2 but the cell surface annexin A2 levels were depleted. This finding suggested that S100A10 might be necessary for the transport of annexin A2 to the cell surface.43 However, the loss of cell-surface annexin A2 in S100A10−/− endothelial cells made it difficult to assess the function of annexin A2 in the S100A10−/− cells. We therefore used 2 different approaches to address the issue of whether annexin A2 played a significant role in endothelial cell-dependent fibrinolysis. First, because annexin A2 requires proteolytic processing and cleavage at Lys-307 to form a carboxyl-terminal Pg binding site, we examined the molecular weight forms of annexin A2 at the endothelial cell surface by Western blotting. Although native annexin A2 was easily detected, we were unable to detect any lower molecular weight (truncated) forms of annexin A2 (Figure 4C-D and supplemental Figure 2A).
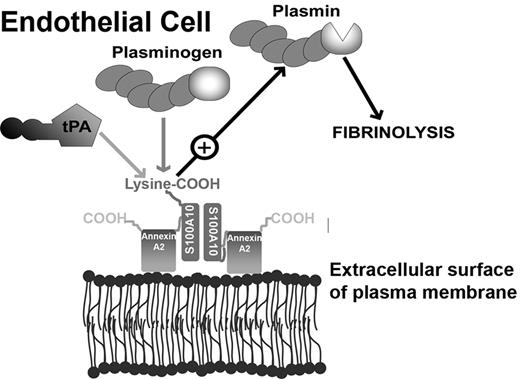
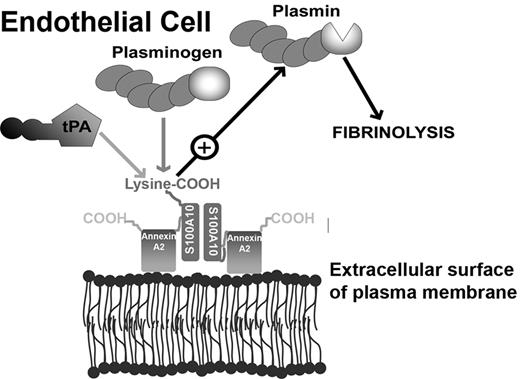
Similarly, we have been unable to detect any truncated annexin A2 on the surface of macrophages that are actively generating Pm,16 on the surface of hyperfibrinolytic leukemic promyelocytes25 and on the surface of cancer cells.23 The truncated form of annexin A2 (Ser-1-Lys-307) has to the best of our knowledge never been directly demonstrated on any cell surface. Interesting, similar to our suggestion that annexin A2 does not play a role on the surface of endothelial cells, has been the suggestion that macrophage cell surface annexin A2 most likely serves as a cell-surface binding partner of S100A10, but does not directly bind Pg.48 Second, TIME cells depleted of S100A10 showed dramatic losses in both Pg binding (50%) and Pm generation (60%) even though the surface annexin A2 levels of the WT and S100A10-depleted cells are similar (Figure 4). Third, the loss in Pg binding and Pm generation is similar between the S100A10-depleted TIME cells and the annexin A2 depleted TIME cells, although the annexin A2-depleted TIME cells are actually depleted in both cell surface annexin A2 and cell surface S100A10, ie, the loss in cell-surface annexin A2 does not appear to effect Pg binding or Pm generation under these experimental conditions. Therefore, we propose that annexin A2 functions to stabilize S100A10 and to localize S100A10 to the cell surface of endothelial cells but does not play a direct role in fibrinolysis by endothelial cells (Figure 6).18,19,22
Model depicting the role of S100A10 in endothelial cell plasmin generation. The predominant form of S100A10 at the endothelial cell surface is as a heterotetramer, AIIt, which consists of 2 copies each of the annexin A2 and S100A10 subunits.22 The annexin A2 subunit acts as a regulatory subunit, which uses its phospholipid-binding sites to anchor S100A10 to the cell surface. The S100A10 subunit binds tPA and Pg at the carboxyl-terminal lysine residue.18,19 The colocalization of tPA and Pg results in accelerated cleavage of Pg by tPA, resulting in Pm generation and fibrinolytic activity.
Model depicting the role of S100A10 in endothelial cell plasmin generation. The predominant form of S100A10 at the endothelial cell surface is as a heterotetramer, AIIt, which consists of 2 copies each of the annexin A2 and S100A10 subunits.22 The annexin A2 subunit acts as a regulatory subunit, which uses its phospholipid-binding sites to anchor S100A10 to the cell surface. The S100A10 subunit binds tPA and Pg at the carboxyl-terminal lysine residue.18,19 The colocalization of tPA and Pg results in accelerated cleavage of Pg by tPA, resulting in Pm generation and fibrinolytic activity.
In conclusion, our studies with the S100A10−/− mouse establish an important role for S100A10 in endothelial cell-dependent fibrinolysis and angiogenesis. At the cellular level, S100A10 is responsible for much of the Pg binding and Pm generation of murine and human microvascular endothelial cells.
The online version of this article contains a data supplement.
The publication costs of this article were defrayed in part by page charge payment. Therefore, and solely to indicate this fact, this article is hereby marked “advertisement” in accordance with 18 USC section 1734.
Acknowledgments
The authors thank Patricia Colp from the Dalhousie University Histology and Research Services Laboratory for tissue processing.
This work was supported by the Heart and Stroke Foundation of New Brunswick and Nova Scotia.
Authorship
Contribution: A.P.S. designed and performed research, analyzed data, and wrote the manuscript; P.A.M. generated the S100A10 and Annexin A2 depleted human endothelial cell lines and cell surface biotinylation; K.D.P. and V.A.M. performed research; P.S. provided the S100A10−/− mice and critically evaluated the manuscript; and D.M.W. designed research, analyzed data, and wrote the manuscript.
Conflict-of-interest disclosure: The authors declare no competing financial interests.
Correspondence: David M. Waisman, Department of Biochemistry & Molecular Biology and Department of Pathology, Dalhousie University, Halifax, Nova Scotia, B3H 4R2; e-mail: david.waisman@dal.ca.

