Abstract
The molecular mechanisms underlying erythroid-specific gene regulation remain incompletely understood. Closely spaced binding sites for GATA, NF-E2/maf, and CACCC interacting transcription factors play functionally important roles in globin and other erythroid-specific gene expression. We and others recently identified the CACCC-binding transcription factor ZBP-89 as a novel GATA-1 and NF-E2/mafK interacting partner. Here, we examined the role of ZBP-89 in human globin gene regulation and erythroid maturation using a primary CD34+ cell ex vivo differentiation system. We show that ZBP-89 protein levels rise dramatically during human erythroid differentiation and that ZBP-89 occupies key cis-regulatory elements within the globin and other erythroid gene loci. ZBP-89 binding correlates strongly with RNA Pol II occupancy, active histone marks, and high-level gene expression. ZBP-89 physically associates with the histone acetyltransferases p300 and Gcn5/Trrap, and occupies common sites with Gcn5 within the human globin loci. Lentiviral short hairpin RNAs knockdown of ZBP-89 results in reduced Gcn5 occupancy, decreased acetylated histone 3 levels, lower globin and erythroid-specific gene expression, and impaired erythroid maturation. Addition of the histone deacetylase inhibitor valproic acid partially reverses the reduced globin gene expression. These findings reveal an activating role for ZBP-89 in human globin gene regulation and erythroid differentiation.
Introduction
Hemoglobinopathies are the most common inherited monogenic disorders worldwide. An estimated 7% of the global population are carriers, and at least 300 000 affected children are born each year.1,2 During development, there is sequential activation and silencing of different α-and β-like globin genes to generate developmental stage-specific hemoglobins. As β-hemoglobinopathies, such as β-thalassemia and sickle cell anemia, involve defects in the adult β-globin gene, there has been a long-standing interest in finding means to reactivate fetal globin (γ-globin) production during adult hematopoiesis to treat these disorders. Because the clinical manifestations of thalassemias result largely from globin chain imbalance, therapeutic approaches aimed at limiting expression of the over-represented globin gene are also expected to produce therapeutic benefits. However, incomplete knowledge of all the key trans-acting factors involved in normal human globin gene regulation has impeded progress in designing rational means to manipulate globin gene expression.
A recurring theme in globin gene regulation is the intricate interaction of multiple sequence-specific transcription factors, such as GATA-1, Sp/KLFs, and NF-E2/maf, to recruit chromatin remodeling complexes to either activate or repress globin genes in a developmental specific manner. These factors bind to common DNA consensus motifs, GATA, CACCC-box, and MARE elements, respectively. These motifs are frequently found in close proximity to one another and are highly enriched at the locus control region (LCR) and proximal promoter regions of globin as well as other erythroid-specific genes. Among these motifs, the CACCC-box has been implicated in formation of an open chromatin structure and developmental globin switching.3-5 Mice lacking KLF1, a major erythroid-specific CACCC-box binding transcription factor, die of severe anemia, mimicking a β-thalassemic phenotype.6 Like GATA-1, KLF1 also regulates many nonglobin erythroid genes.7,8 One of KLF1's direct target genes is BCL11A, a recently identified key stage-specific repressor of γ-globin expression.9-12 Although KLF1 is a key erythroid regulator, additional CACCC-box binding factors may also contribute to erythropoiesis.
In a previous study, we purified GATA-1 containing multiprotein complexes from erythroid cells and identified the CACCC-binding Krüppel-like zinc finger transcription factor ZBP-89 (also called zfp148, BERF-1, and BFCOl1) as a novel direct GATA-1 interacting partner.13 Using murine genetrap embryonic stem cells, we showed that ZBP-89 is required for erythroid terminal maturation in vitro. Chimeric mouse analysis demonstrated significantly reduced contribution of ZBP-89 genetrap embryonic stem cells to peripheral blood hemoglobin production relative to the degree of overall hematopoietic chimerism, suggesting that ZBP-89 is specifically required for erythroid development and/or globin gene activation in vivo.13 In a quantitative proteomic study, Brand et al14 found that ZBP-89 also selectively associates with mafK/NFE2-p45 complexes during induction of mouse erythroleukemia cell maturation. Given the physical association of ZBP-89 with GATA-1 and MafK/NF-E2p45, the close proximity of ZBP-89 type binding sites with GATA and NF-E2/maf target sites in key human globin cis-regulatory elements, and the functional role of ZBP-89 in murine erythropoiesis, we hypothesized that ZBP-89 may be directly involved in human globin and other erythroid-specific gene regulation. The current study examines this hypothesis using a primary human CD34+ cell ex vivo erythroid cell differentiation system.
Methods
Antibodies and reagents
Generation of rabbit polyclonal ZBP-89 N14 antibody has previously been described.13 Additional antibodies were purchased from the following commercial sources: Santa Cruz Biotechnology, GAPDH (sc-25778), p300 (sc-584), TIP60 (sc-5725), and Gcn5 (sc-20698); Abcam, WDR5 (ab22512); and Cell Signaling, Trrap (P2032). All chemicals were purchased from Sigma-Aldrich, unless noted otherwise.
Cell culture
K562 subclones carrying the birA enzyme and FLAG-biotin tagged versions of ZBP-89 were generated as previously described.15 K562 cells were cultured in RPMI with 10% FCS and 2% penicillin-streptomycin. Deidentified cryogenically preserved primary human CD34+ (hCD34+) cells were obtained from the Yale Center of Excellence in Molecular Hematology. They were prepared by magnetically sorting mononuclear samples of G-CSF-mobilized peripheral blood from donors. For erythroid ex vivo differentiation, hCD34+ progenitor stem cells were expanded for 6 days in StemSpan SFEM Medium with 1× CC100 cytokine mix (Stem Cell Technologies) and 2% penicillin-streptomycin. On day 6 of expansion, cells were reseeded into erythroid differentiation medium (StemSpan SFEM Medium containing 2% penicillin-streptomycin, 20 ng/mL SCF, 1 U/mL erythropoietin, 5 ng/mL IL-3, 2μM dexamethasone, and 1μM β-estradiol) and cultured for up to 12 additional days.
shRNA knockdown
Lentivirus mediated down-regulation was performed as previously described.9 Two short hairpin RNAs (shRNAs), designated as sh1 and sh2, target ZBP-89 cDNA at 473 bp and 1207 bp from the start of exon 9, respectively. Exon 9 is shared among all reported isoforms of ZBP-89. Sequences are provided in supplemental Table 1 (available on the Blood Web site; see the Supplemental Materials link at the top of the online article). The shRNA sequences were cloned into the pLKO.1 vector (Sigma-Aldrich), which drives expression of shRNAs from the human U6 promoter and contains a puromycin resistance selection cassette.16 The cells were seeded in fresh medium 24 hours after transduction and cultured for an additional 24 hours before the start of selection with puromycin. The empty pLKO.1ps vector or pLKO.1ps-containing hairpin sequences against green fluorescent protein were used to produce control lentiviruses. For histone acetyltransferase (HAT) inhibitor studies, valproic acid (VPA, 1μM final concentration) was added on day 3 of erythroid differentiation and the cells were assayed 72 hours later.
Quantitative RT-PCR
Total RNA was isolated using the RNeasy Plus Mini Kit (QIAGEN) according to the manufacturer's instructions. iScript (Bio-Rad) was used to synthesize cDNA. Real-time quantitative RT-PCR was performed using the iQ SYBR Green Supermix on a MyiQ real-time PCR detection system (Bio-Rad). Relative expression was quantified using the ΔΔCt method as described previously.17 Relative expression values for each of the genes were calculated by comparing to Gapdh transcript levels. At least 3 biologic replicates were performed. Sequences of primers used are listed in supplemental Table 2.
Nuclear protein extraction, tandem affinity purification, and Western blot
Nuclear extraction and tandem affinity purification from primary human erythroid and/or K562 cells were performed essentially as described.13 A total of 1 to 5 mg of nuclear extract protein was pretreated with DNase I (1 μg/mL), RNaseA, (1 μg/mL), and ethidium bromide (50 μg/mL) to eliminate protein-DNA interaction before preclearing with protein A/G beads (Roche Diagnostics). Input nuclear extract was incubated with anti-FLAG M2-agarose beads (Sigma-Aldrich) overnight at 4°C with continuous gentle rotation, followed by washing and elution with excess FLAG peptide (Sigma-Aldrich). Material from 3 successive elutions was pooled and incubated with streptavidin-agarose beads (Invitrogen) for 2 to 4 hours at 4°C with gentle continuous tube rotation. Final bound protein complexes were eluted by boiling in Laemmli SDS loading buffer. The eluates from 1 mg of starting nuclear protein and 2% of the input were loaded into each lane of an SDS-polyacrylamide gel for Western blot analysis.
ChIP assays
Cultured cells were cross-linked with 1% formaldehyde for 10 minutes at room temperature and quenched in 125mM glycine. The cells were washed in PBS and then lysed in buffer containing 1% to 0.1% SDS. Sonicated DNA fragments were incubated overnight at 4°C with 2 to 20 μg/mL of ChIP grade antibodies. Bound material was precipitated with Protein A or G agarose beads (Roche) at 4°C for 2 hours followed by washing and de-crosslinking for subsequent analysis. For quantitative ChIP-PCR, enriched DNA fragments were quantitated by quantitative PCR using the Bio-Rad system as previously described.13 Relative enrichment was calculated by comparing enrichment signals at the tested site with a control β-actin exon 6 site. At least 3 biologic replicates were performed. The sequences of the primers used are described previously9 or are listed in supplemental Table 3.
ChIP-chip and data analysis
ChIP samples were amplified by ligation mediated PCR as described previously,18 and microarray hybridizations were performed on the Affymetrix GeneChip ENCODE, Version 2.0R arrays. Three biologic replicates were performed. Hybridization, incubation, washing, and scanning were performed at the Microarray Core Facility at the Dana-Farber Cancer Institute. Model-based Analysis of Tiling array with P value = .00001 was applied to predict the significant peaks19 in the human genome assembly hg17. Occupancy between 2 kb upstream and 2 kb downstream of the transcriptional start site (TSS) of annotated genes was used to assign bound genes. Analysis of ZBP-89 sequence preference at binding sites was performed using the cis-regulatory element annotation system.20 The ChIP-chip data have been deposited in the Gene Expression Omnibus public database under accession no. GSE31036.
cDNA microarray analysis
Total RNA was prepared from erythroid progenitors on day 6 of differentiation. At least 2 biologic repeats were performed. Microarray analysis was performed on Affymetrix GeneChip Human Genome U133A, Version 2.0 Array at the Dana-Farber Cancer Institute. Data were analyzed by dChip program and Gene Set Enrichment Analysis as previously described.21,22 Erythroblast specific gene sets were obtained from Watkins et al.23 The gene expression data have been deposited in the Gene Expression Omnibus public database under accession no. GSE31092.
Flow cytometry
Ex vivo cultured erythroid cells were stained with antihuman CD71-FITC (eBioscience, 11-0719-41) and antihuman CD235a-PE (eBioscience, 12-9987-80) following standard procedures and analyzed on a FACSCalibur flow cytometry instrument (BD Biosciences) using FlowJo software.
Histology and cytology
Cytocentrifuge preparations were stained with May-Grunwald-Giemsa according to standard procedures.13
Human subjects protections
All protocols related to collection and analysis of the primary human CD34+ cells were approved by the Institutional Review Boards at Yale University and Children's Hospital Boston.
Results
ZBP-89 protein levels increase during human erythroid cell differentiation
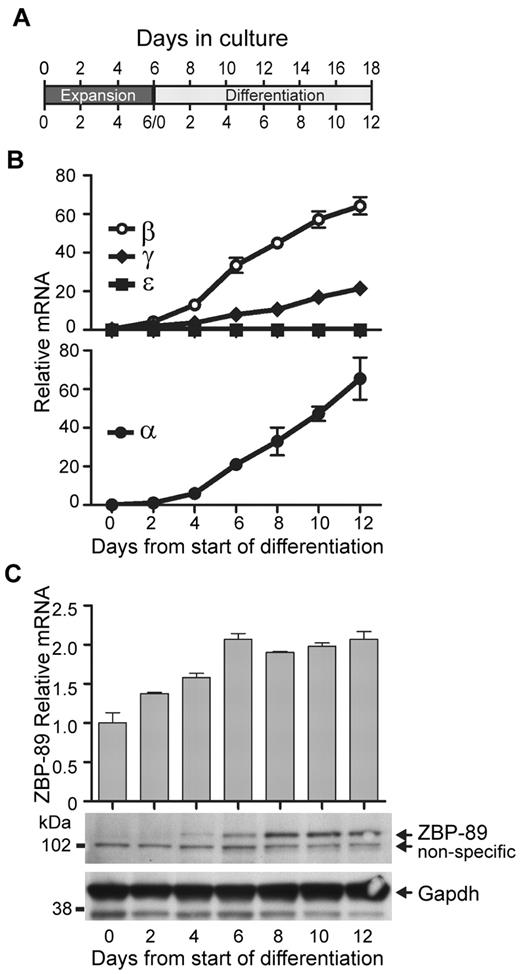
We began by examining ZBP-89 expression levels during ex vivo erythroid differentiation of hCD34 cells. In this system,9 G-CSF–mobilized peripheral blood CD34+ cells are expanded in the presence of Flt-3, SCF, IL-3, and IL-6 for 6 days (“expansion phase”; Figure 1A). They are then switched to a differentiation medium containing erythropoietin, SCF, IL-3, dexamethasone, and β-estradiol and cultured for an additional 12 days (“differentiation phase”). By day 7 of the differentiation phase, the cells are mostly basophilic erythroblasts; by day 12, they are mostly orthochromatic normoblasts.24 During the expansion phase, α-globin and β-like globins are expressed at very low levels (Figure 1B). However, beginning on day 4 of differentiation, mRNA levels for the α-like globin genes HBA1 and HBA2, and the β-like globin genes HBB (β-globin) and HBG (γ-globin) increase and continue to rise throughout the remainder of the culture period.
ZBP-89 expression during erythroid ex vivo differentiation of human CD34+ cells. (A) Schematic diagram showing time course of culture system used in the experiments. The days of total culture are indicated on top, and days of the individual expansion and differentiation periods are indicated separately on the bottom. (B) Time course of β-, γ-, ϵ-, and α-globin mRNA transcript levels after placing the expanded CD34+ cells into erythroid differentiation medium (“Cell culture”). Measurements were made by quantitative RT-PCR and are graphed relative to Gapdh mRNA levels at each time point ± SEM (n > 3). (C) Time course of ZBP-89 mRNA (top) and protein (bottom) levels along the same time course as shown in panel B. mRNA levels are shown relative to those on day 0 of the differentiation culture phase.
ZBP-89 expression during erythroid ex vivo differentiation of human CD34+ cells. (A) Schematic diagram showing time course of culture system used in the experiments. The days of total culture are indicated on top, and days of the individual expansion and differentiation periods are indicated separately on the bottom. (B) Time course of β-, γ-, ϵ-, and α-globin mRNA transcript levels after placing the expanded CD34+ cells into erythroid differentiation medium (“Cell culture”). Measurements were made by quantitative RT-PCR and are graphed relative to Gapdh mRNA levels at each time point ± SEM (n > 3). (C) Time course of ZBP-89 mRNA (top) and protein (bottom) levels along the same time course as shown in panel B. mRNA levels are shown relative to those on day 0 of the differentiation culture phase.
As shown in Figure 1C (upper panel), ZBP-89 mRNA levels begin to rise on day 2 of the differentiation phase. ZBP-89 protein, which is essentially undetectable by Western blot during the expansion phase, becomes evident by day 4 of the differentiation phase and rises in intensity until day 8, and remains elevated for the rest of the culture period (lower panel). The increase in ZBP-89 protein levels correlates with the rise in globin mRNA transcript levels, consistent with a potential direct role in human globin gene activation.
ZBP-89 occupies key cis-regulatory regions within the human α- and β-globin loci
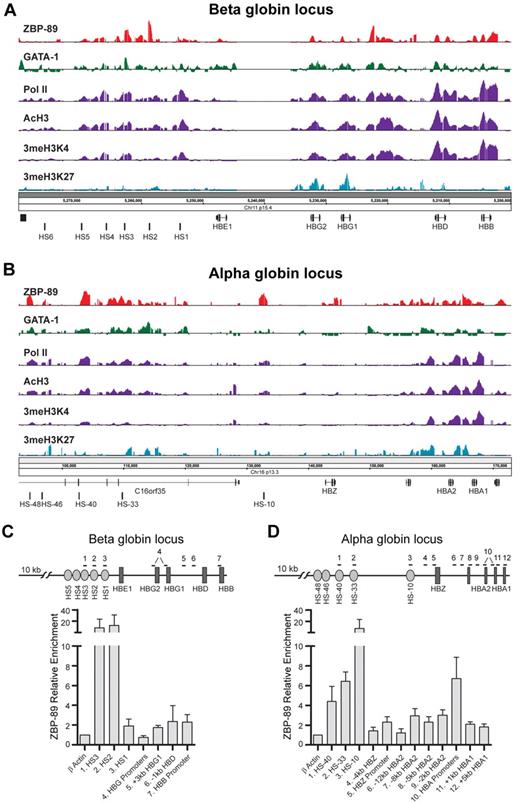
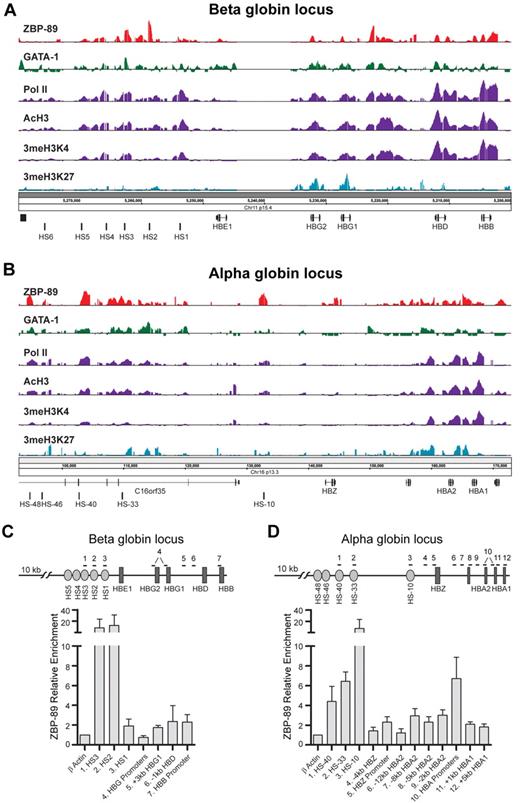
ChIP-chip experiments were performed next to determine whether ZBP-89 occupies key cis-regulatory elements within the human globin loci. Cells were harvested on day 5 of the differentiation phase and analyzed by ChIP-chip using Affymetrix GeneChip ENCODE, Version 2.0R arrays. These arrays contain 1% of the human genome tiled at 7 bp resolution and include both the α- and β-globin loci. As shown in Figure 2, ZBP-89 enrichment peaks were found at a number of known key cis-regulatory regions of both loci. In the β-globin locus (Figure 2A), major peaks were observed at DNase I hypersensitive (HS) sites HS2 and HS3 of the LCR25 and at an intergenic region located between the HBG1(A γ)-globin gene and the HBD (δ)-globin genes. Lower level peaks were seen at HS4 of the LCR and at the HBG1 and HBG2, HBD, and HBB gene proximal promoters, and within the HBD and HBB gene bodies. ZBP-89 occupancy at HS3, all of the globin gene proximal promoters, and the intergenic site between HBG1 and HBD corresponds to GATA-1 occupancy sites24 (Figure 2A).
ZBP-89 occupancy of the globin loci in primary human erythroid precursor cells. Representative ChIP-chip signals for ZBP-89, GATA-1, RNA Pol II, AcH3, 3meH3K4, and 3meH3K27 within the human β-globin (A) and α-globin (B) loci in hCD34+ cells harvested on day 5 of the erythroid differentiation culture period. The locations of key cis-regulatory elements and genes are indicated at the bottom of each panel. The data for GATA-1, Pol II, 3meH3K4, and 3meH3K27 were obtained from Xu et al.24 (C-D) Quantitative ChIP validation of key ZBP-89 enrichment peaks from the ENCODE array ChIP-chip studies within the β-globin (C) and α-globin (D) loci from cells on day 6 of differentiation. The positions of the primers used for each site (numbered) are indicated by horizontal lines at the top of the schematic drawing. Note that the primers used for the HBG promoters (#4) detect both HBG1 and HBG2. Likewise, the primers for the HBA promoters (#10) detect both HBA1 and HBA2 promoters. It was not possible to design primers centered at the peak of the ZBP-89 enrichment site between HBG1 and HBD (A) because of high GC content of this region. Primer pair #5 is offset from the center of the peak. Fold enrichments are shown relative to an exonic region of the β-actin gene. Data represent the mean of ≥ 3 independent experiments ± SEM.
ZBP-89 occupancy of the globin loci in primary human erythroid precursor cells. Representative ChIP-chip signals for ZBP-89, GATA-1, RNA Pol II, AcH3, 3meH3K4, and 3meH3K27 within the human β-globin (A) and α-globin (B) loci in hCD34+ cells harvested on day 5 of the erythroid differentiation culture period. The locations of key cis-regulatory elements and genes are indicated at the bottom of each panel. The data for GATA-1, Pol II, 3meH3K4, and 3meH3K27 were obtained from Xu et al.24 (C-D) Quantitative ChIP validation of key ZBP-89 enrichment peaks from the ENCODE array ChIP-chip studies within the β-globin (C) and α-globin (D) loci from cells on day 6 of differentiation. The positions of the primers used for each site (numbered) are indicated by horizontal lines at the top of the schematic drawing. Note that the primers used for the HBG promoters (#4) detect both HBG1 and HBG2. Likewise, the primers for the HBA promoters (#10) detect both HBA1 and HBA2 promoters. It was not possible to design primers centered at the peak of the ZBP-89 enrichment site between HBG1 and HBD (A) because of high GC content of this region. Primer pair #5 is offset from the center of the peak. Fold enrichments are shown relative to an exonic region of the β-actin gene. Data represent the mean of ≥ 3 independent experiments ± SEM.
Multiple ZBP-89 enrichment peaks were observed within the α-globin locus (Figure 2B). This includes peaks at enhancer regions corresponding to HS-48, HS-40, HS-33, and HS-10, and broad low-level enrichment peaks at both HBA2 and HBA1 (α2 and α1) genes in their promoters and gene bodies. ZBP-89 enrichment peaks were validated by quantitative ChIP assays in independent experiments (Figure 2C-D). We conclude that ZBP-89 occupies key cis-regulatory elements within the β- and α-globin loci in primary human erythroid precursor cells.
ZBP-89 occupancy correlates with RNA Pol II occupancy and activating histone marks within the globin loci
We took advantage of recently published ChIP-ENCODE array data by Xu et al24 to correlate ZBP-89 binding with RNA polymerase II (RNA Pol II) occupancy, the activating histone mark trimethyl histone 3 lysine 4 (3meH3K4), and the repressive histone mark trimethyl histone 3 lysine 27 (3meH3K27). We also included a new dataset for histone 3 acetylation (AcH3), another marker of activated genes. Comparison of peak location and width revealed a remarkable positive correlation between ZBP-89 occupancy and RNA Pol II, 3meH3K4, and AcH3 enrichment and a negative correlation with 3meH3K27 enrichment (Figure 2A-B). These observations suggest a potential activating role for ZBP-89 in globin gene regulation.
ZBP-89 occupies GC/GT boxes with preference for proximal promoters
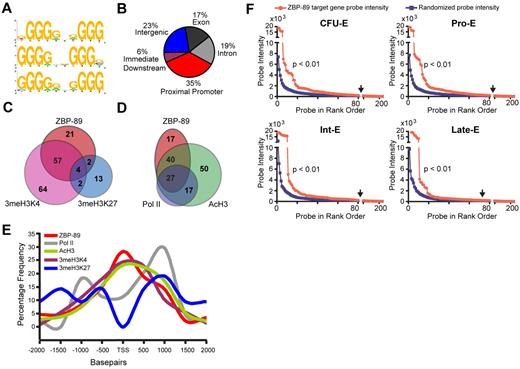
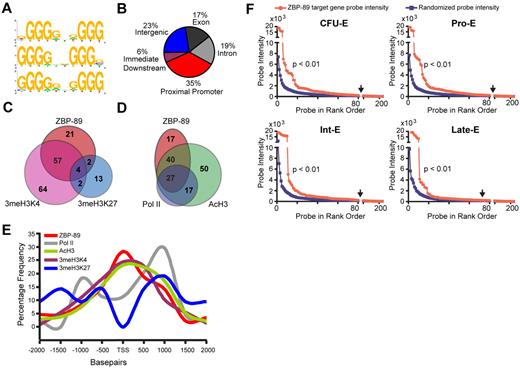
Extension of our analysis across the entire ENCODE array revealed 235 ZBP-89 enrichment peaks with a P value of .00001. This represents 84 bound genes, based on occupancy between −2 kb and 2 kb of the TSS (supplemental Table 4). Prior in vitro studies identified the ZBP-89 DNA binding consensus sequence as a CACCC-like and/or GT/GC-rich Sp/KLF-like motif.26,27 A more recent study described 5 consecutive guanines (GGGGG) as being critical for ZBP-89 occupancy at the GATA1 hematopoietic enhancer (G1HE).28 Analysis of our global ChIP-chip dataset using the cis-regulatory element annotation system algorithm20 revealed that several variant motifs, including GGGG(G/A)X(G/A)GGG, GGGGXXGGGg, and gGGG(G/A)X(G/A)GGG, were enriched at ZBP-89 occupancy sites (Figure 3A). This suggests that ZBP-89 has an extended G-rich sequence preference in vivo. Examination of ZBP-89 occupancy location relative to annotated gene structures shows that more than one-third of the peaks (35%) are located at the proximal promoter region of genes, suggesting a preferred role at the site of transcriptional initiation (Figure 3B).
Association of ZBP-89 chromatin occupancy with activating gene features. (A) DNA sequence motif preference at ZBP-89 bound sites across the entire ENCODE array using cis-regulatory element annotation system algorithm.20 (B) Pie chart showing the relative location of ZBP-89 occupancy peaks relative to annotated gene structures. (C) Venn diagram showing overlap of genes containing ZBP-89 occupancy peaks and those with enrichment for 3meH3K4 and/or 3meH3K27 between −2 kb upstream to 2 kb downstream of the TSS. (D) Venn diagram showing overlap of ZBP-89 occupied genes, RNA Pol II-occupied genes, and genes enriched for AcH3. (E) Plot showing percentage frequency of ZBP-89, RNA Pol II, AcH3, 3meH3K4, and 3meH3K27 enrichment peaks relative to distance from the TSS. (F) Plots of normalized cDNA gene expression microarray probe intensity signals29 (NCBI GEO accession no. GSE22552) corresponding to the 84 ZBP-89 bound genes (represented by 219 probes; red) compared with the mean of 10 sets of randomly selected 219 probe sets (blue). Data for each of the represented equivalent erythroid maturational stages (CFU-E), proerythroblast (Pro-E), intermediate erythroblast (Int-E), and late erythroblast (Late-E) are shown. All probe sets to the left of the vertical arrows have intensities ≥ 1.5-fold greater than the random control probe sets of equivalent rank order.
Association of ZBP-89 chromatin occupancy with activating gene features. (A) DNA sequence motif preference at ZBP-89 bound sites across the entire ENCODE array using cis-regulatory element annotation system algorithm.20 (B) Pie chart showing the relative location of ZBP-89 occupancy peaks relative to annotated gene structures. (C) Venn diagram showing overlap of genes containing ZBP-89 occupancy peaks and those with enrichment for 3meH3K4 and/or 3meH3K27 between −2 kb upstream to 2 kb downstream of the TSS. (D) Venn diagram showing overlap of ZBP-89 occupied genes, RNA Pol II-occupied genes, and genes enriched for AcH3. (E) Plot showing percentage frequency of ZBP-89, RNA Pol II, AcH3, 3meH3K4, and 3meH3K27 enrichment peaks relative to distance from the TSS. (F) Plots of normalized cDNA gene expression microarray probe intensity signals29 (NCBI GEO accession no. GSE22552) corresponding to the 84 ZBP-89 bound genes (represented by 219 probes; red) compared with the mean of 10 sets of randomly selected 219 probe sets (blue). Data for each of the represented equivalent erythroid maturational stages (CFU-E), proerythroblast (Pro-E), intermediate erythroblast (Int-E), and late erythroblast (Late-E) are shown. All probe sets to the left of the vertical arrows have intensities ≥ 1.5-fold greater than the random control probe sets of equivalent rank order.
Global ZBP-89 binding correlates with RNA Pol II occupancy and activated histone marks
Comparison of ZBP-89 occupied genes with histone modifications throughout the entire ENCODE array revealed that 57 of the 84 ZBP-89 occupied genes (68%) are also enriched for 3meH3K4, compared with only 2 with 3meH3K27 (2.4%; Figure 3C). Four occupied genes have “bivalent” marks (4.8%). More than two-thirds of the ZBP-89 occupied genes are enriched for both 3meH3K4 and AcH3, and 27 (32%) are also occupied by RNA Pol II (Figure 3D). Plotting the distance of the ZBP-89 occupancy peaks relative to the TSS further illustrates ZBP-89 colocalization with 3meH3K4 and AcH3, and depletion of 3meH3K27 (Figure 3E). RNA Pol II occupancy peaks are centered at approximately −1 kb and 1 kb from the TSS with the dominant peak at 1 kb, consistent with potential accumulation of paused elongation complexes. Interestingly, there is a small shoulder of ZBP-89 occupancy that coincides with the 1-kb RNA Pol II major peak.
ZBP-89 occupied genes are expressed during human erythroid maturation
Merryweather-Clarke et al29 recently reported a global gene expression analysis of primary human erythroid precursors isolated at 4 stages of maturation: colony-forming unit (CFU-E), pro-erythroblast (Pro-E), intermediate erythroblast (Int-E), and late erythroblast (Late-E).29 Comparison of the 84 ZBP-89 bound genes with their gene expression profiles from this dataset shows a significant enrichment for highly expressed genes compared with a large set of randomly selected probes (Figure 3F). In addition, there was an increase in signal intensity among ZBP-89 bound genes as the cells progressed from the Pro-E to Int-E stage. A similar pattern was observed using the GATA-1 ENCODE ChIP-chip dataset,24 although the total number of peaks was smaller because of technical limitations of the α-human GATA-1 antibody (supplemental Figure 1).
ZBP-89 interacts with the histone acetyltransferases p300 and Gcn5/Trrap in erythroid cells
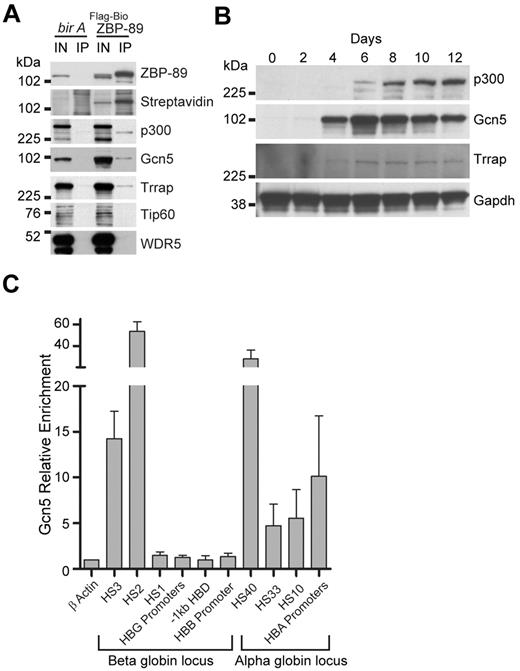
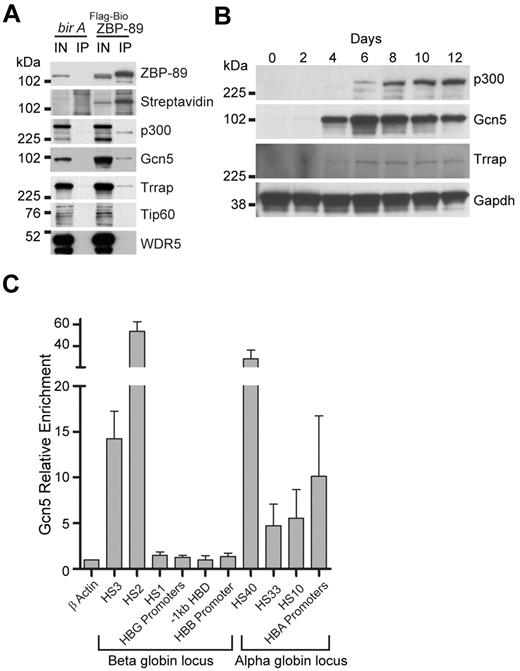
ZBP-89 interacts with the HAT p300 in nonerythroid cells.30 To examine whether ZBP-89 also interacts with p300 in erythroid cells, we generated human K562 erytholeukemia cell lines that stably express FLAG and metabolically biotinylated ZBP-89 (FLAG-BioZBP-89). Clones were selected that express FLAG-BioZBP-89 at levels below endogenous ZBP-89 to avoid potential artifacts from protein overexpression. Tandem anti-FLAG–streptavidin affinity purification was performed, and copurified proteins were analyzed by Western blot (Figure 4A). Interaction with p300 was detected from the experimental cells, but not control cells expressing the biotin ligase (bir A) alone, indicating that ZBP-89 also associates with p300 in human erythroid cells.
Physical association of p300 and the Gcn5/Trrap (GNAP) complex with ZBP-89 in human erythroid cells. (A) Tandem anti-FLAG, streptavidin affinity purification assay from uninduced K562 cells stably expressing FLAG and metabolically biotin tagged ZBP-89 (FLAG-Bio ZBP89) versus control cells expressing birA alone. Western blot analysis of the final copurified proteins for the indicated proteins is shown. Streptavidin indicates streptavidin-horseradish peroxidase (SA-HRP) direct blot; IN′, 2% input; and IP, streptavidin affinity purified material. (B) Western blot analysis of indicated proteins during erythroid commitment and maturation from expanded CD34+ cells. Time represents days after the cells were switched into differentiation medium. (C) Quantitative ChIP assays for Gcn5 occupancy at key cis-regulatory regions within the β- and α-globin loci from cells on day 7 of differentiation. Fold enrichments are shown relative to an exonic region of the β-actin gene. Data represent the mean of 3 independent experiments ± SEM.
Physical association of p300 and the Gcn5/Trrap (GNAP) complex with ZBP-89 in human erythroid cells. (A) Tandem anti-FLAG, streptavidin affinity purification assay from uninduced K562 cells stably expressing FLAG and metabolically biotin tagged ZBP-89 (FLAG-Bio ZBP89) versus control cells expressing birA alone. Western blot analysis of the final copurified proteins for the indicated proteins is shown. Streptavidin indicates streptavidin-horseradish peroxidase (SA-HRP) direct blot; IN′, 2% input; and IP, streptavidin affinity purified material. (B) Western blot analysis of indicated proteins during erythroid commitment and maturation from expanded CD34+ cells. Time represents days after the cells were switched into differentiation medium. (C) Quantitative ChIP assays for Gcn5 occupancy at key cis-regulatory regions within the β- and α-globin loci from cells on day 7 of differentiation. Fold enrichments are shown relative to an exonic region of the β-actin gene. Data represent the mean of 3 independent experiments ± SEM.
We also examined potential interactions between ZBP-89 and other HAT family members and Trithorax group proteins. This revealed physical association of ZBP-89 with the HAT Gcn5, as well as the Gcn5 cofactor, Trapp (Figure 4A). Trrap is a scaffolding protein that cooperates with Gcn5 to form the GNAP (Gcn5-related N-acetyltransferase) complex, or with Tip60 to form the MYST (MOZ, Ybf2/Sas3, Sas2, and Tip60) complex.31 The GNAP complex preferentially acetylates histone 3 (H3) in vitro, whereas MYST preferentially acetylates histone 4 (H4).32,33 We did not detect interaction between ZBP-89 and Tip60 (Figure 4A), suggesting that ZBP-89 specifically associates with the GNAP complex. We also did not detect interaction with WDR5, a core component of MLL/SET complexes, which mediate histone 3 lysine 4 trimethylation, suggesting that the link between ZBP-89 chromatin occupancy and 3meH3K4 is indirect.
To begin examining a role for the GNAP complex in human erythroid development, we monitored the expression of Gcn5 and Trrap proteins during hCD34+ ex vivo erythroid differentiation (Figure 4B). This shows that Gcn5 and Trrap protein levels increase with similar kinetics as ZBP-89 (compare with Figure 1C), whereas p300 protein levels rise somewhat later during the differentiation time course. Quantitative ChIP assays in the primary human erythroid precursors show strong enrichment for Gcn5 at HS3 and HS2 of the β-globin locus, and HS-40, HS-33, HS-10, and HBA promoters of the α-globin locus, similar to ZBP-89 occupancy (Figures 4C and 2C-D). Collectively, these data suggest a potential cooperative role between GNAP and ZBP-89 in human globin gene regulation.
ZBP-89 plays an activating role in human erythroid cells and is required for terminal maturation
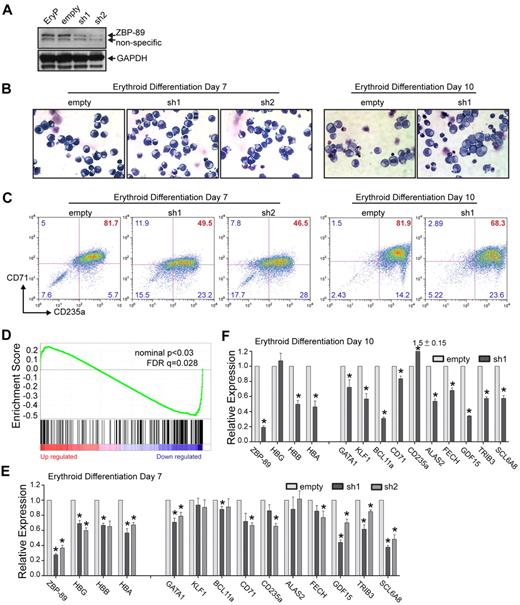
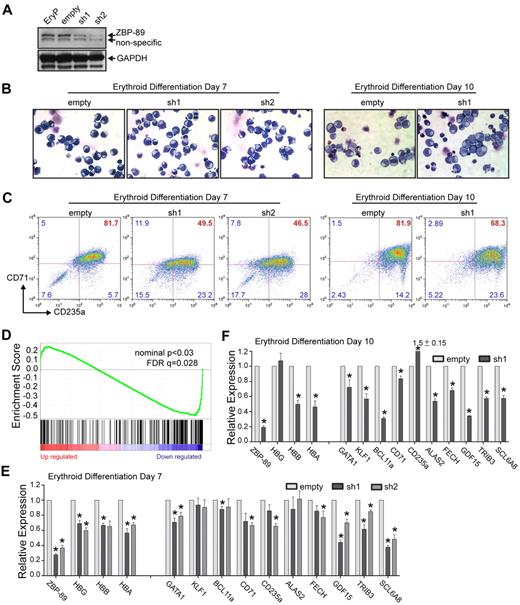
To test the functional significance of ZBP-89 in human erythroid gene expression, ZBP-89 protein levels were depleted in the human primary cell cultures using lentivirally expressed shRNAs. Two independent shRNA constructs were used that target different sequences within ZBP-89 exon 9. The cells were infected 2 days before initiation of the differentiation phase, selected with puromycin for 2 days (the lentiviral vectors coexpress a puromycin resistance gene) and then switched to erythroid differentiation medium. Western blot analysis on day 7 of differentiation shows approximately 60% to 70% depletion of ZBP-89 protein levels compared with control cells transduced with the empty vector (Figure 5A).
Requirement for ZBP-89 in human globin gene activation and erythroid maturation. (A) Lentiviral-mediated shRNA knockdown of ZBP-89 in ex vivo differentiated erythroid precursors. Western blot for ZBP-89 protein levels in nontransduced erythroid precursors (EryP), or those transduced with the empty lentiviral vector or vectors containing one of 2 shRNA constructs (sh1 and sh2) that target different sequences within ZBP-89 exon 9 (“shRNA knockdown”). Western blot was performed from cells harvested on day 7 after placement into differentiation medium. (B) May-Grunwald-Giemsa stains of cytospun EryP cells transduced with the empty vector, sh1 or sh2 on days 7 and 10 of differentiation (original magnification × 600; see supplemental Figure 2 for additional images). (C) Flow cytometric analysis for CD71 and CD235a expression of EryP cells transduced with the empty vector, sh1, or sh2 on days 7 and 10 of differentiation. (D) Gene Set Enrichment Analysis of genes differentially expressed on ZBP-89 knockdown (sh1; vs the empty vector) on day 6 of differentiation compared with the erythroid-specific expressed gene set.23 The y-axis shows the enrichment score for each gene, which is illustrated as a vertical line plotted in rank order of most up regulated (left) to most down-regulated (right). (E-F) Quantitative RT-PCR analysis of mRNA transcript levels for the indicated genes in EryP cells transduced with the empty vector, sh1, or sh2 on day 7 (E) and day 10 (F) of differentiation. Expression is shown relative to levels from the empty vector-transduced cells and is normalized to Gapdh levels. Measurements represent the mean from > 3 independent experiments ± SEM. *Significant differences compared with the empty vector (P < .05, Student t test).
Requirement for ZBP-89 in human globin gene activation and erythroid maturation. (A) Lentiviral-mediated shRNA knockdown of ZBP-89 in ex vivo differentiated erythroid precursors. Western blot for ZBP-89 protein levels in nontransduced erythroid precursors (EryP), or those transduced with the empty lentiviral vector or vectors containing one of 2 shRNA constructs (sh1 and sh2) that target different sequences within ZBP-89 exon 9 (“shRNA knockdown”). Western blot was performed from cells harvested on day 7 after placement into differentiation medium. (B) May-Grunwald-Giemsa stains of cytospun EryP cells transduced with the empty vector, sh1 or sh2 on days 7 and 10 of differentiation (original magnification × 600; see supplemental Figure 2 for additional images). (C) Flow cytometric analysis for CD71 and CD235a expression of EryP cells transduced with the empty vector, sh1, or sh2 on days 7 and 10 of differentiation. (D) Gene Set Enrichment Analysis of genes differentially expressed on ZBP-89 knockdown (sh1; vs the empty vector) on day 6 of differentiation compared with the erythroid-specific expressed gene set.23 The y-axis shows the enrichment score for each gene, which is illustrated as a vertical line plotted in rank order of most up regulated (left) to most down-regulated (right). (E-F) Quantitative RT-PCR analysis of mRNA transcript levels for the indicated genes in EryP cells transduced with the empty vector, sh1, or sh2 on day 7 (E) and day 10 (F) of differentiation. Expression is shown relative to levels from the empty vector-transduced cells and is normalized to Gapdh levels. Measurements represent the mean from > 3 independent experiments ± SEM. *Significant differences compared with the empty vector (P < .05, Student t test).
On day 7 of differentiation, May-Grunwald-Giemsa staining of cytospun cells did not show major morphologic differences between the knockdown versus control cells (Figure 5B). By day 10, the control cells showed morphologic heterogeneity with some cells containing smaller and more condensed nuclei, and lighter colored cytoplasm. Numerous normoblasts were present. The ZBP-89 knockdown cells were somewhat more homogeneous in appearance with larger nuclei, slightly more basophilic cytoplasm, and fewer normoblasts present (see supplemental Figure 2 for additional images).
Flow cytometric analysis for the erythroid surface markers CD71 (transferrin receptor) and CD235a (glycophorin A) demonstrated a modest shift in the population toward lower CD71 and (to a lesser degree) CD235a expression of the knockdown cells compared with controls at day 7 (Figure 5C). At day 10, the control cells showed a fairly compact pattern of high CD71+ CD235a+ cells, with a tail of more mature CD71low CD235a+ cells. In contrast, the cells from the knockdown cultures showed a more dispersed population and had less of a clear tail of CD71lowCD235a+ cells. Control cells transduced with an shRNA-directed against green fluorescent protein behaved similar to empty vector-transduced cells (supplemental Figure 3).
cDNA microarray gene expression analysis was performed on the control and knockdown cells at day 6 of the differentiation. A total of 89 genes were down-regulated and 187 were up-regulated ≥ 1.5-fold with P < .05 on ZBP-89 knockdown compared with the empty vector control. Gene set enrichment analysis showed that the majority of down-regulated genes were highly enriched for erythroid-specific expressed genes23 (nominal P < .03; false discovery rate = 0.028; Figure 5D). The 50 most down-regulated and up-regulated erythroid specific genes are listed in supplemental Tables 5 and 6, respectively.
Validation studies using quantitative RT-PCR analysis were performed on cells from days 7 and 10 of differentiation (Figure 5E and Figure 5F, respectively). ZBP-89 mRNA levels were decreased by 60% to 70% after normalization to the housekeeping gene Gapdh. Normalized mRNA transcript levels for γ-, β-, and α- globins were reduced by 30% to 40% at day 7. By day 10, the β- and α-globin transcripts further decreased to approximately 50% of control levels, whereas γ-globin transcripts increased back to normal. Reductions in a number of other erythroid-expressed genes, including GATA1, KLF1, BCL11a, CD71, CD235a, ALAS2, FECH, GDF15, TRIB3, and SCL6A8, were also observed, with more significant decreases observed on day 10, except for CD235a. These results are consistent with a global role of ZBP-89 in human erythroid-specific gene regulation and/or terminal erythroid maturation.
Direct role of ZBP-89 in human globin gene regulation
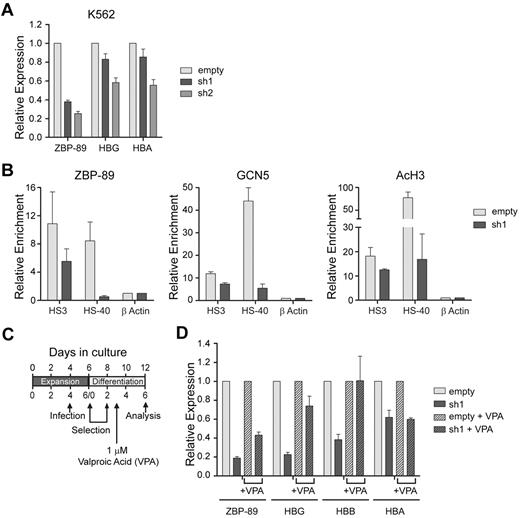
Although ZBP-89 chromatin occupancy at globin locus cis-regulatory elements supports a direct role for ZBP-89 in globin gene regulation, the reduced globin gene expression in the knockdown cells could be the result of impaired cell maturation. To further address a potential direct role, we performed ZBP-89 shRNA knockdown experiments in uninduced human K562 cells. These cells express α- and γ-globin under basal conditions, allowing us to probe the effect of ZBP-89 deficiency independent of erythroid cell maturation. As shown in Figure 6A, ZBP-89 knockdown correlated with a dose-dependent reduction in both α- and γ-globin mRNA levels in uninduced K562 cells. This indicates that ZBP-89 affects globin gene expression independent of cell maturation.
Role of ZBP-89 in globin gene regulation and recruitment of HATs. (A) Change in globin gene expression on ZBP-89 depletion in uninduced K562 cells. Relative mRNA levels for ZBP-89, HBG (γ-globin), and HBA (α-globin) normalized to Gapdh are shown in uninduced K562 cells transduced with either the empty vector, or ZBP-89 sh1 and sh2. Levels are shown relative to the empty vector control and represent the mean of 3 independent experiments ± SEM. (B) Quantitative ChIP assays for ZBP-89, Gcn5, and AcH3 enrichment levels at β-globin HS3 and α-globin HS-40 in human EryP cells transduced with the empty vector or ZBP-89 sh1. The cells were harvested on day 6 of differentiation. The data represent the enrichment relative to β-actin exon 6 and are the mean of 2 biologic duplicates and 3 experimental repeats ± SEM. (D) Effect of VPA on globin gene expression changes induced by ZBP-89 depletion. Relative mRNA levels for ZBP-89, HBG (γ-globin), HBB (β-globin), and HBA (α-globin) in human EryP cells transduced with the empty vector or ZBP-89 sh1. Transduced and selected cells were divided into 2 cultures and incubated with either 1μM VPA in PBS or PBS alone. Cells were harvested 72 hours later. Levels are shown relative to the empty vector control and represent the mean of 3 experiments ± SEM.
Role of ZBP-89 in globin gene regulation and recruitment of HATs. (A) Change in globin gene expression on ZBP-89 depletion in uninduced K562 cells. Relative mRNA levels for ZBP-89, HBG (γ-globin), and HBA (α-globin) normalized to Gapdh are shown in uninduced K562 cells transduced with either the empty vector, or ZBP-89 sh1 and sh2. Levels are shown relative to the empty vector control and represent the mean of 3 independent experiments ± SEM. (B) Quantitative ChIP assays for ZBP-89, Gcn5, and AcH3 enrichment levels at β-globin HS3 and α-globin HS-40 in human EryP cells transduced with the empty vector or ZBP-89 sh1. The cells were harvested on day 6 of differentiation. The data represent the enrichment relative to β-actin exon 6 and are the mean of 2 biologic duplicates and 3 experimental repeats ± SEM. (D) Effect of VPA on globin gene expression changes induced by ZBP-89 depletion. Relative mRNA levels for ZBP-89, HBG (γ-globin), HBB (β-globin), and HBA (α-globin) in human EryP cells transduced with the empty vector or ZBP-89 sh1. Transduced and selected cells were divided into 2 cultures and incubated with either 1μM VPA in PBS or PBS alone. Cells were harvested 72 hours later. Levels are shown relative to the empty vector control and represent the mean of 3 experiments ± SEM.
We also examined changes in histone acetylation and Gcn5 recruitment at key globin cis-regulatory elements in ex vivo differentiated primary human erythroid cells. Lentiviral shRNA knockdown of ZBP-89 resulted in a 49% reduction of ZBP-89 occupancy at HS3 of the β-globin LCR and 94% reduction at HS-40 of the α-globin locus, compared with the empty vector control. This correlated with a 38% and 87% reduction of Gcn5 enrichment, and a 31% and 78% reduction of AcH3 levels at HS3 and HS-40, respectively (Figure 6B). These findings, in combination with the chromatin occupancy data (Figure 2), are consistent with a direct role of ZBP-89 in human globin gene regulation. They also support a mechanism in which ZBP-89 recruits Gcn5 to its target sites.
ZBP-89 acts through the recruitment of HATs
To further test whether ZBP-89 gene regulatory mechanisms predominantly use HAT activity, we treated ex vivo differentiated ZBP-89 shRNA knockdown cells with the histone deacetylase inhibitor VPA. As shown in Figure 6D, VPA treatment partially reversed the decrease in HBG and HBB expression seen with ZBP-89 depletion. Although the degree of ZBP-89 knockdown was slightly blunted by VPA, the increases in HBG and HBB expression were in excess of this change. These data demonstrate that ZBP-89 acts through the recruitment of HATs in at least a subset of its target loci, including the human β-globin locus. HBA levels were not affected by VPA treatment, suggesting that additional mechanisms may be involved at this locus.
Discussion
In this study, we examined the role of ZBP-89 in human globin gene regulation and erythroid differentiation, given its known interaction with GATA-1 and NF-E2/MafK complexes, its binding to “CACCC”-type motifs, and our prior work showing its involvement in murine erythropoiesis. Although our current data indicate a general role for ZBP-89 in human erythroid maturation, extensive occupancy at known key globin cis-regulatory regions, reduced globin gene expression after ZBP-89 depletion in uninduced K562 cells, and loss of Gcn5 and AcH3 at β-globin HS3 and α-globin HS-40 on ZBP-89 depletion strongly suggest that ZBP-89 also plays a direct role in human globin gene expression. This is similar to GATA-1 and KLF1, which regulate both globin and other erythroid-specific genes.
The results of the current study demonstrate a predominant activating role for ZBP-89 in erythroid gene regulation, probably via HAT complex recruitment. Prior work has suggested that histone acetylation at the β-globin locus is mediated through p300/CBP.34 These factors also interact with NF-E2,35 GATA-1,36 and KLF1.37 Moreover, acetylation of these transcription factors themselves contributes to transcriptional activation of the β-globin locus.38 Our data indicate that ZBP-89 also contributes to HAT recruitment to the globin loci during erythroid maturation.
Prior studies in nonerythroid cells indicate that ZBP-89 acts as both a transcriptional activator27,39,40 and repressor.41-43 Although our data do not exclude a repressor function in primary erythroid cells, it suggests a more prominent role in activation. It is possible that ZBP-89's activity is cell context dependent. Further, in vivo studies should better define ZBP-89's physiologic transcriptional roles.
The role of the GNAP complex in erythroid differentiation has not been examined in detail. Jayapal et al recently reported that Gcn5 is a downstream target of Myc and that down-regulation of Myc and Gcn5 is necessary for late-stage erythroid chromatin deacetylation, nuclear condensation, and enucleation.44 The findings in our study support a potential positive functional role for GNAP complex during earlier stages of erythroid maturation. We show that Gcn5/Trrap protein levels rise during ex vivo human erythroid cell commitment and maturation, that Gcn5 occupies key cis-regulatory elements within the human globin loci, and that Gcn5 forms physical complexes with ZBP-89 in human erythroid cells. Gcn5 null mice die at embryonic day 10.5 by failing to form dorsal mesoderm lineages.45 A conditional null model for Gcn5 has not been reported, so information regarding its specific roles beyond early development is not available. Trrap null mice die at the peri-implantation stage because of blocked proliferation of blastocysts.46 However, selective deletion of Trrap in the hematopoietic system impairs hematopoietic stem/progenitor cell pool maintenance.47 It will be important to dissect the roles of the GNAP complex in hematopoiesis further because different HATs may play functionally distinct roles at different stages of maturation. Our finding of earlier induction of GNAP proteins compared with p300 during ex vivo human erythroid precursor maturation (Figure 4B) is consistent with potential distinct functions.
BCL11A is a recently recognized key developmental stage-specific repressor of γ-globin expression.9,10 Like ZBP-89, BCL11A physically associates with GATA-1 and Friend of GATA-1 in erythroid cells. BCL11A and ZBP-89 also share a subset of common chromatin occupancy sites, including HS3, in primary human erythroid cells. However, unlike BCL11A, ZBP-89 appears to have a predominant activating function and affects erythroid gene regulation more broadly. Interestingly, reduced ZBP-89 led to decreased KLF1 and BCL11A expression, raising the possibility that ZBP-89 may act upstream of these factors.
In addition to KLF1, a number of other GC/GT-box binding proteins have been implicated in erythroid development. Specificity protein 1 (Sp1) is abundantly expressed in erythroid cells. In a study using human fetal liver and mouse erythroleukemia hybrid cells, Sp1 was found to bind to key GT boxes within the LCR and to inhibit β-like globin gene transcription during erythroid terminal differentiation.48 Sp1−/− mouse embryos express embryonic globin genes but die of multiple complications on day 11 of gestation.49 A later study with compound heterozygous deletion of Sp1 and Sp3 showed impaired fetal liver erythropoiesis, suggesting compensatory roles of multiple Sp family members.50 Given the potential overlap in DNA binding activities between ZBP-89, KFL1, and Sp factors, it will be of interest to determine whether there is any functional interplay, either positively or negatively, between these factors during erythroid differentiation.
The carboxyl terminal domain of ZBP-89 contains a strong PEST sequence, which typically targets proteins for rapid degradation. Despite the presence of basal ZBP-89 mRNA levels in undifferentiated hCD34+ cells, no detectable ZBP-89 protein is present (Figure 1). In addition, the rapid increase in protein levels during erythroid maturation is out of proportion to the rise in mRNA levels. These findings suggest that post-transcriptional mechanisms may play important roles in regulating ZBP-89 activity and may contribute to the final stages of terminal erythroid maturation.
In conclusion, the data presented in this study provide evidence for a functional role of ZBP-89 in human erythroid differentiation and globin gene regulation. Moreover, they elucidate a novel mechanism for the recruitment of HATs to the human globin locus and may provide new pharmacologic targets for manipulating globin gene expression.
The online version of this article contains a data supplement.
The publication costs of this article were defrayed in part by page charge payment. Therefore, and solely to indicate this fact, this article is hereby marked “advertisement” in accordance with 18 USC section 1734.
Acknowledgments
The authors thank the Microarray Core Facility at the Dana-Farber Cancer Institute for assistance with the ChIP-chip analysis and Barry Paw and Dan Bauer for critical review of the manuscript.
A.B.C. is supported by the National Institutes of Health (grant P01 HL32262-25).
National Institutes of Health
Authorship
Contribution: A.J.W. designed and performed the experiments and contributed to preparation of the manuscript; J.K. and J.X. participated in ChIP-chip experiments and bioinformatics analyses; H.H. contributed to ZBP-89 knockdown cell phenotypic analysis; and A.B.C. designed the experiments, assisted in interpretation of the data, and prepared the manuscript.
Conflict-of-interest disclosure: The authors declare no competing financial interests.
Correspondence: Alan B. Cantor, Children's Hospital Boston, 300 Longwood Ave, Karp 7, Boston, MA 02115; e-mail: alan.cantor@childrens.harvard.edu.

