Abstract
Abstract 2918
Genetic heterogeneity is a well-known characteristic of MM. Two broad subtypes, Hyperdiploid MM (>46) and Non Hyperdiploid MM (≤46), are defined by chromosome number and are each associated with a distinct prognosis. However, karyotype in MM is informative in no more than one-third of newly diagnosed cases. DNA flow cytometry has given excellent results in the quantification of the cell DNA content. Furthermore, the combined DNA and cytoplasmic Immunoglobulin (DNA/cIg) flow cytometric analysis offers a number of distinct advantages in the study of MM compared to other assays. The relative quantification of cIg is feasible even for cases of non-secreting MM, the characterization of the ploidy of that clone, or even the identification of more than one abnormal clone in the same monoclonal population based on differential DNA content.
480 patients that met the criteria for symptomatic or progressive MM were enrolled to the Total Therapy (TT) 3A & B protocols as previously published. The number of distinct DNA ploidy clones (NC) found on DNA/cIg analysis, their percentages and their respective DNA Index (DI) and cIg Index (cIgI), and percentage of cells in S phase, were evaluated alone and in relevance with known powerful prognostic parameters as previously published (Table 1). A DI between 0.99 and 1.01 referred to diploidy, lesser than 0.99 to hypodiploidy and more than 1.01 to hyperdiploidy. Cox proportional hazards regression was used to perform univariate and multivariate analysis of the various prognostic factors for overall survival (OS) and progression-free survival (PFS).
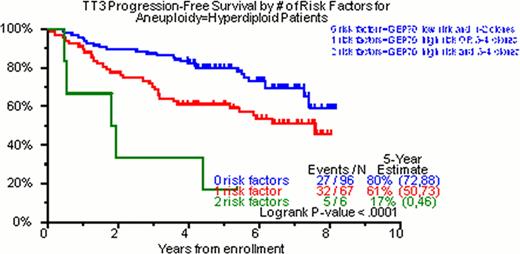
Of the total cohort of TT3 patients, 98% had DNA/cIg flow cytometry done on initial diagnosis. In 28%, no clone was identified; in 22% one clone, in 37% two clones, in 13% three clones and in 0.5% four clones were identified. Of 342 patients with at least one cell clone, hyperdiploidy was the feature of the dominant clone in 49% (169/342), diploidy in 42% (147/342) and hypodiploidy in 8% (26/342). The median values for DI and cIgI were 1.01 (0.72–2.02) and 3.4 (1.0–22), respectively. In the univariate analysis for OS, NC was highly significant (p<0.001, HR=1.32). The characterization of the ploidy of the dominant clone by DNA/cIg did not achieve statistical significance (p=0.172, HR=1.29). Nevertheless, when the DI of this clone was evaluated as a continuous numerical variable, DI>1 was statistically significant (p=0.021, HR=0.65). The same was also true for the cIgI of the dominant clone (p=0.019, HR=0.74). Regarding PFS, NC (p=0.005, HR=1.23), diploidy of the dominant clone (p=0.042, HR=1.40), the DI>1 of the dominant (p=0.006, HR=0.63) and the secondary (p=0.031, HR=1.58) clone as well as the cIgI of the dominant clone (p=0.037, HR=0.81) were statistically significant. In the multivariate analysis regarding OS, the NC was able to enter both models with and without GEP (p=0.007, HR=1.26 and p=0.002, HR=1.29 respectively). Regarding PFS, NC yielded similar results (p=0.054, HR=1.15 and p=0.013, HR=1.19 for the GEP including and non-including model respectively). Implementation of GEP and DNA/cIg was able to identify 3 distinct prognostic groups in hyperdiploidy both for OS and PFS (Figure 1).
Hyperdiploidy is the most common ploidy status in MM. The level of cIg production has a prognostic impact in MM. Clonal heterogeneity as portrayed by the NC in DNA/cIg is a major prognostic factor in MM. When DNA/cIg is combined with GEP in hyperdiploid cases, it is able to stratify them into three distinct prognostic groups.
Variables with known prognostic significance in TT3
| Variable . | n/N (%) . |
|---|---|
| Albumin < 3.5 g/dL | 151/479 (32%) |
| B2M > 5.5 mg/L | 116/477 (24%) |
| Creatinine > 2 mg/dL | 34/479 (7%) |
| CRP > 8 mg/L | 160/478 (33%) |
| Hb < 10 g/dL | 151/479 (32%) |
| LDH > 190 U/L | 124/479 (26%) |
| Cytogenetic abnormalities | 170/475 (36%) |
| GEP 70 high-risk | 77/441 (17%) |
| GEP 80 high-risk | 41/441 (9%) |
| GEP HY subgroup | 137/441 (31%) |
| GEP LB subgroup | 61/441 (14%) |
| GEP MF subgroup | 31/441 (7%) |
| GEP MS subgroup | 58/441 (13%) |
| GEP PR subgroup | 60/441 (14%) |
| GEP CD-2 subgroup | 61/441 (14%) |
| GEP CD-1 subgroup | 33/441 (7%) |
OS for Hyperdiploid Patients According to Risk Factors
PFS for Hyperdiploid Patients According to Risk Factors
PFS for Hyperdiploid Patients According to Risk Factors
No relevant conflicts of interest to declare.
Author notes
Asterisk with author names denotes non-ASH members.


