Abstract
Abstract 3058
Bronchiolitis obliterans syndrome (BOS) is a late, non-infectious pulmonary complication following hematopoietic stem cell transplantation (HSCT). The prevalence is estimated to be between 5–10% after allogeneic HSCT with a significant increase in morbidity and mortality. We were interested in assessing quantitative radiologic characterization of airway remodeling in these subjects.
To examine quantitative measurements of airway morphology and their correlation with lung function in a cohort of patients who underwent HSCT and developed BOS.
All patients who underwent an allogeneic HSCT at the Dana-Farber Cancer Institute/Brigham and Women's Hospital (n=1854) between January 1st 2000 and June 30th2010 were screened for the development of BOS using modified NIH diagnostic criteria. Clinically acquired high resolution CT (HRCT) scans of the chest were collected. Discrete measures of airway wall area were performed in a total of 16 manually selected airways in the right and left upper and lower lobes using Airway Inspector (www.airwayinspector.org). From these measures, the square root of wall area of a 10-mm luminal perimeter (Pi10) was calculated. Spearman correlation was used to assess the relationship between square root of wall area at Pi10 and pulmonary function measures. Paired t-test was used for within group comparisons. Analyses were performed with SAS v. 9.2.
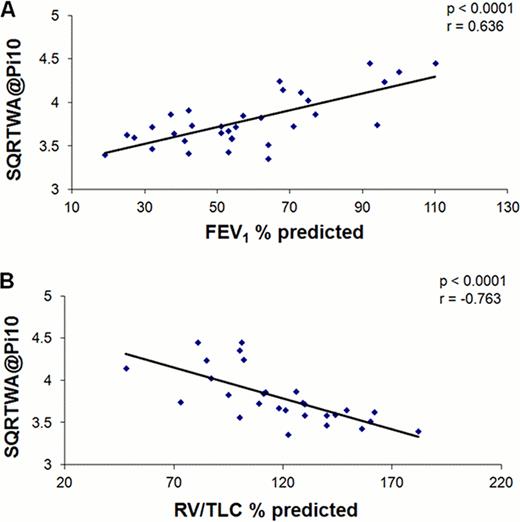
Within our cohort 89 cases of BOS were identified of which 37 patients had HRCT scans available for analysis. 33 patients had pulmonary function tests within 30 days of the HRCT (Table 1). Ten of the 37 BOS patients had a HRCT scan at or prior to transplantation and a HRCT scan available after the diagnosis of BOS. Square root of wall area at Pi10 correlated significantly with FEV1(r = 0.636, p<0.0001), RV/TLC (r = −0.736, p< 0.0001) (Fig. 1), and when adjusted for age, sex and total lung capacity, the correlations remained significant (p<0.0001). There was a significant decline in square root of wall area at Pi10 in BOS cases compared to pre-transplant CT scans (p<0.001) (Fig 2).
On HRCT scan BOS is characterized by central airway dilation, the degree of which is correlated to decrements in lung function. Future studies will examine whether chest CT assessment of central airway dilation can be used as a sensitive and specific tool for diagnosis and staging of BOS.
Correlation coefficients (r Values) of the univariate regression analysis for square root of wall area at Pi10 with pulmonary function tests. FVC indicates forced vital capacity; FEV1, 1-second forced expiratory volume; FEF25–75 %, forced expiratory flow between 25–75%; VC, vital capacity; IC, inspiratory capacity; ERV, end residual volume; TLC, total lung capacity; RV, residual volume; DLCO,carbon monoxide diffusion capacity
| PFT . | r value . | <0.0001 . |
|---|---|---|
| FVC % | 0.546 | 0.001 |
| FEV1 % | 0.636 | <0.0001 |
| FEV1/FVC | 0.343 | NS |
| FEF25–75 % | 0.578 | 0.0004 |
| VC % | 0.595 | 0.002 |
| IC % | 0.602 | 0.002 |
| ERV % | −0.353 | NS |
| TLC % | 0.219 | NS |
| RV % | −0.561 | 0.002 |
| RV/TLC % | −0.736 | <0.0001 |
| DLCO % | –0.175 | NS |
A. Graphs of the relationship between Square root of wall area at Pi10 and FEV1 (r = 0.636, p<0.0001) n=33 and B. RV/TLC (r = -0.736, p<0.0001) n=28. Each graph is shown with a fitted regression line. FEV1and RV/TLC are expressed as a percentage of the predicted normal value.
A. Graphs of the relationship between Square root of wall area at Pi10 and FEV1 (r = 0.636, p<0.0001) n=33 and B. RV/TLC (r = -0.736, p<0.0001) n=28. Each graph is shown with a fitted regression line. FEV1and RV/TLC are expressed as a percentage of the predicted normal value.
A. Ten BOS patients with Pre BOS diagnosis HRCT scans (on or before transplant) and post diagnosis BOS HRCT scan. * Pre BOS vs. BOS p<0.001
B. Representative image of pre-transplant CT scan and post diagnosis BOS CT scan demonstrating airway dilation.
A. Ten BOS patients with Pre BOS diagnosis HRCT scans (on or before transplant) and post diagnosis BOS HRCT scan. * Pre BOS vs. BOS p<0.001
B. Representative image of pre-transplant CT scan and post diagnosis BOS CT scan demonstrating airway dilation.
No relevant conflicts of interest to declare.
Author notes
Asterisk with author names denotes non-ASH members.


