Abstract
There has been recent evidence that lenalidomide, while used in the treatment of myelodysplastic syndromes (MDS), also has been associated with an enhanced risk of secondary malignancies including MDS. Here we are examining the impact of maintenance on the development of metaphase-based MDS-associated cytogenetic abnormalities (MDS-CA), and subsequent development of therapy related MDS (t-MDS) and acute leukemia (t-AL) in the two arms of Total Therapy 2 (TT2) and two successive Total Therapy 3 trials (TT3A, TT3B).
The details of TT2/TT3A/TT3B trials and patient outcomes have been reported previously. TT2 (median follow-up 118 months) patients were then randomized to receive thalidomide maintenance (TT2+Thal) for 3 years versus no thalidomide (TT2-Thal). Maintenance in TT3A (median follow-up 78 moths) consisted of VTD in the first year and TD for years 2 and 3 in TT3A, while TT3B (median follow-up 48 months) employed VRD for all 3 years. The patient populations were as follows: TT2-Thal arm (n=283), TT2+Thal arm (n=270), TT3A (n=279) and TT3B (n=162). Bone marrow examination with conventional cytogenetics was performed at baseline, post-induction, post-transplant and then at least semi-annually from maintenance in all patients prospectively. Chi-square and Fisher's exact tests were used to compare baseline characteristics between protocols. Univariate and multivariate Cox proportional hazard regression were used to model associations between baseline covariates and onset of MDS-CA and t-MDS/t-AL. Kaplan and Meier method was used to model cumulative incidence of MDS-CA and t-MDS/t-AL.
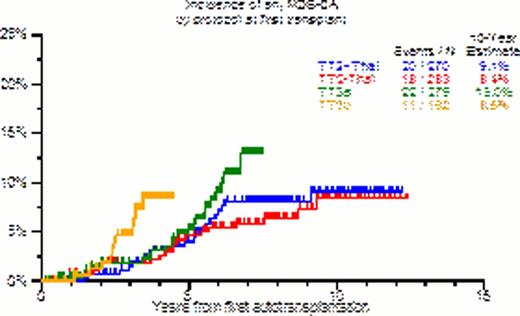
Baseline characteristics were fairly comparable between the two arms of TT2 and the two TT3 studies, except a higher proportion of GEP70 high risk patients in TT3B. Cumulative incidence of MDS-CA was significantly higher in TT3B protocol from time of first transplant (Figure 1), with the most common cytogenetic abnormality being deletion of chromosome 20 (del20, 35%), followed by monosomy/deletion 7 (27%) and monosomy/deletion 5 (17%) across all protocols. Of the 71 patients with an MDS-CA, 29 were also diagnosed with clinical MDS or AML; for these 29 patients, the median time to this diagnosis from first transplant was 58 months. The cumulative incidence of MDS-CA was higher and achieved more statistical significance (Figure 2) in TT3B compared to TT3A when landmarked from the start of maintenance. In univariate analysis for all patients, TT3B emerged as a significant variable in the univariate Cox regression model for MDS-CA, and in both the univariate and multivariate models for del20. Univariate and multivariate modeling within TT3B patient population did not reveal significance with cumulative dosing of different maintenance drugs.
Three randomized phase III trials (IFM-2005-02, CALGB 101104 and MM-015) have demonstrated an increase incidence of second malignancies in patients receiving lenalidomide maintenance after having been exposed to alkylating agent melphalan. In our present study, we are reporting an increased incidence of MDS-CA in the TT3B trial that employed VRD maintenance when compared with predecessor TT3A and TT2 trials. The data suggests that the risk is associated with lenalidomide exposure rather than its cumulative dosing in patients with prior exposure to therapy with alkylating agents.
Pairwise log-rank comparisons:
| TT3B vs. TT3A: | p-value = 0.0206 |
| TT3B vs. TT2-Thal: | p-value = 0.0134 |
| TT3B vs. TT2+Thal: | p-value = 0.0178 |
| TT3A vs. TT2-Thal: | p-value = 0.1502 |
| TT3A vs. TT2+Thal: | p-value = 0.3134 |
| TT2-Thal vs. TT2+Thal: | p-value = 0.8863 |
| TT3B vs. TT3A: | p-value = 0.0206 |
| TT3B vs. TT2-Thal: | p-value = 0.0134 |
| TT3B vs. TT2+Thal: | p-value = 0.0178 |
| TT3A vs. TT2-Thal: | p-value = 0.1502 |
| TT3A vs. TT2+Thal: | p-value = 0.3134 |
| TT2-Thal vs. TT2+Thal: | p-value = 0.8863 |
Cumulative Incidence of MDS-CA from onset of maintenance therapy, TT3A vs. TT3B 4-year p-value = 0.01
Cumulative Incidence of MDS-CA from onset of maintenance therapy, TT3A vs. TT3B 4-year p-value = 0.01
Sawyer:University of Arkansas for Medical Sciences: Employment, under panding process, under panding process Patents & Royalties.

This icon denotes a clinically relevant abstract
Author notes
Asterisk with author names denotes non-ASH members.


