Key Points
Hdac1 and Hdac2 are dosage-dependent tumor suppressors.
Hdac1 and Hdac2 regulate p53-modulating genes as a barrier to prevent Myc-driven tumorigenesis.
Abstract
Histone deacetylases (HDACs) are epigenetic erasers of lysine-acetyl marks. Inhibition of HDACs using small molecule inhibitors (HDACi) is a potential strategy in the treatment of various diseases and is approved for treating hematological malignancies. Harnessing the therapeutic potential of HDACi requires knowledge of HDAC-function in vivo. Here, we generated a thymocyte-specific gradient of HDAC-activity using compound conditional knockout mice for Hdac1 and Hdac2. Unexpectedly, gradual loss of HDAC-activity engendered a dosage-dependent accumulation of immature thymocytes and correlated with the incidence and latency of monoclonal lymphoblastic thymic lymphomas. Strikingly, complete ablation of Hdac1 and Hdac2 abrogated lymphomagenesis due to a block in early thymic development. Genomic, biochemical and functional analyses of pre-leukemic thymocytes and tumors revealed a critical role for Hdac1/Hdac2-governed HDAC-activity in regulating a p53-dependent barrier to constrain Myc-overexpressing thymocytes from progressing into lymphomas by regulating Myc-collaborating genes. One Myc-collaborating and p53-suppressing gene, Jdp2, was derepressed in an Hdac1/2-dependent manner and critical for the survival of Jdp2-overexpressing lymphoma cells. Although reduced HDAC-activity facilitates oncogenic transformation in normal cells, resulting tumor cells remain highly dependent on HDAC-activity, indicating that a critical level of Hdac1 and Hdac2 governed HDAC-activity is required for tumor maintenance.
Introduction
Cancer develops and persists as a result of accumulating genetic and epigenetic changes.1 The reversibility of epigenetic changes has generated increasing interest in the development of agents that target epigenetic regulators such as histone deacetylases (HDACs).2
HDACs are critical epigenetic erasers of lysine-acetyl marks of histones and non-histone substrates.3 They can be classified on the basis of their homology to yeast counterparts. Class I HDACs (HDAC1, −2, −3, and −8) are highly homologous to Saccharomyces cerevisiae Rpd3. Class IIa HDACs (HDAC4, −5, −7, and −9) and class IIb HDACs (HDAC6 and −10) consist of S. cerevisiae Hda1 homologs. HDAC11 is the sole member of the class IV HDACs, based on homology to both class I and class II HDACs.4 While class I, II, and IV HDACs are Zn2+-dependent hydrolases, class III histone deacetylases, which consist of yeast Sir2 homologs (Sirtuins 1-7), form a structurally and mechanistically distinct class of nicotinamide adenine dinucleotide dependent hydrolases.
A classic function of HDACs relates to their role as transcriptional corepressors through deacetylation of lysine residues in histone tails. This results in a closed chromatin structure and diminished accessibility for the basal transcription machinery. Class I HDACs are present in repressor complexes such as SIN3A, NuRD, REST, and N-CoR/SMRT, which acquire their regional activities in part by interacting with sequence-specific transcription factors.
In agreement with a high sequence similarity between class I HDAC1 and HDAC2, genetic studies in mice revealed redundant functions of these enzymes in many cell types.5-10 In addition, many biological processes, such as DNA damage repair, autophagy, hematopoiesis, and cell cycle regulation, are collectively regulated by HDAC1 and HDAC2.5,6,11,12
Nevertheless, Hdac1- and Hdac2-specific functions have been identified. Deletion of Hdac1 results in embryonic lethality as early as E9.5 of development.13 In effector T cells, Hdac1 regulates the inflammatory response in an in vivo allergic airway inflammation model, suggesting that Hdac1 has a specific function in controlling an inflammatory response by modulating cytokine expression.14 In contrast to Hdac1 deficiency, Hdac2 loss of function results in viable mice with reduced body weight.15-17 Others have reported that Hdac2 deficiency is not compatible with life due to cardiac myopathy.7 In addition, Hdac2 plays a specific role in repression of genes involved in synaptogenesis, as evidenced by enhanced synapse formation, learning, and memory in Hdac2-deficient mice.17
The use of pharmacological HDAC inhibition in cancer treatment is rationalized by observations showing high expression of individual HDACs and recruitment of these proteins by oncogenic fusion proteins such as PML-RAR and AML-ETO in various cancer types.18 In contrast, class I HDACs, such as HDAC1 and HDAC2, have been identified in complexes harboring tumor suppressors, such as the retinoblastoma protein (RB1),19 p53,20 BCL11B,21 and RUNX1.22 Hence, inhibition of HDACs may have tumor-promoting and tumor-suppressive consequences. The growing interest in the use of HDACi and other epigenetic drugs as therapeutic agents in the treatment of cancer, acquired drug resistance, HIV, diabetes, and neurological disorders such as Alzheimer disease23-26 necessitate full knowledge of HDACs in normal development to harness the therapeutic potential and future development of novel HDACi.
Methods
Mice
The Hdac1 and Hdac2 cKO alleles as well as MxCre;Hdac1L/L;Hdac2L/L mice have been described elsewhere.5,17 Thymocyte-specific deletion of Hdac1 and Hdac2 was obtained using LckCre transgenic mice27 in combination with Hdac1 and/or Hdac2 cKO alleles. All cohorts were in a mixed FVB/n, C57BL/6, and 129/Sv background. All experiments were approved by a local ethical committee and performed according to national guidelines.
Establishment, culturing, and treatment of mouse thymic lymphoma tumor cell lines
Tumors were dissected from the thorax of LckCre;Hdac1Δ/Δ, LckCre;Hdac1+/Δ;Hdac2Δ/Δ, LckCre;Hdac1Δ/Δ;Hdac2+/Δ, Eμ-Myc, or p53−/− mice. Single cell suspensions were cultured in Dulbecco’s modified Eagle medium or Iscove modified Dulbecco medium medium containing 10% fetal bovine serum, glutamine, penicillin/streptomycin supplemented with 20% Methocult (M3434, Stem Cell Technologies). CD4 and CD8 flow cytometry analysis was used to confirm the T-cell identity of the cell lines. To determine HDACi sensitivity, tumor cell lines were treated with different concentrations of suberoylanilide hydroxamic acid (SAHA; Selleck) for 72 hours. Cell viability was measured using Cell Titer Blue assay (Promega). To infect lymphoma cell lines with lentiviral shRNA constructs, 5 × 10⁵ cells were infected twice with 30 μL of concentrated lentiviral supernatants containing 4 μg/mL polybrene in a total volume of 530 μL for 24 hours and subsequently selected with 2.0 μg/mL puromycin for at least 48 hours. pLKO.1 Jdp2 and nontargeting (NT) shRNA vectors were obtained from the Netherlands Cancer Institute Robotics and Screening facility. Jdp2 mRNA levels were analyzed by quantitative polymerase chain reaction (qPCR) using the following primers: Jdp2_F 5′-CGCTGACATCCGCAACATTG-3′, Jdp2_R 5′-CATCTGGCTGCAGCGACTTT-3′.
In vivo BrdU labeling
Mice were injected intraperitoneally with 200 μL 5-bromo-2'-deoxyuridine (BrdU) solution (10 mg/mL). After 1.5 hours, thymocytes were intracellularly labeled with Bride antibodies (α-BrdU-APC) and with the DNA binding fluorescent dye 7-AAD (BrdU Flow Kit, BD Pharmingen). Subsequently, stained thymocytes were analyzed on a multicolor CyAn flow-cytometer (Beckman Coulter). Data were analyzed with FlowJo software (Treestar).
Histology
Tissues were fixed in ethanol–acetic acid–formol saline for 24 hours and subsequently embedded in paraffin. For immunohistochemistry, sections were preincubated with goat serum (Sanquin) for 30 minutes and subsequently incubated o/n with an Hdac1 antibody (Abcam), Hdac2 (Invitrogen), or p53 (VectorLabs) and secondary poly-HRP-anti-rabbit IgG (Immunologic) for 30 minutes. The slides were washed with phosphate-buffered saline, incubated with 3′3-diamino benzidine substrate chromogen system (Dako), and counterstained with hematoxylin (Merck).
Flow cytometry
Thymocytes and thymic lymphoma cells were stained with Thy1-PE, CD4-PacificBlue, CD8-FITC (fluorescein isothiocyanate), CD25-PerCP-Cy5.5, CD44-APC, TCRβ-APC, and CD24-PE (BD Biosciences). Apoptotic thymocytes were determined using an antibody against annexinV (annexinV apoptosis kit, BD Biosciences) and propidium iodide (PI) counterstain. All experiments were performed using a multicolor CyAn flow cytometer (Beckman Coulter). Data were analyzed with FlowJo software (Treestar).
Western blot analysis
For western blot analysis, tissues and cells were lysed in radioimmunoprecipitation assay buffer (20 mM Tris, pH7.5, 150 mM sodium chloride, 1% Nonidet P-40, 0.5% sodium deoxycholate, 1 mM EDTA, 0.1% sodium dodecyl sulfate), protease inhibitors (Roche), phosphatase inhibitors, 5 μM trichostatin A, and 1 mM nicotinamide. We used 20 μg of total protein for western blotting and incubated it with antibodies against Hdac1 (IMG-337, Imgenex), Hdac2 (SC-7899, Santa Cruz), Hdac3 (Cell Signaling), Hdac8 (Santa Cruz), and γ-tubulin (T6557, Sigma). Protein levels were quantified using IRDye 680/800CW secondary antibodies (Li-Cor). Nitrocellulose membranes were stained and imaged with the LI-COR Odyssey infrared imaging system. Other antibodies used are against p19Arf (Ab80; Abcam), p53 (IMX25, Novocastra), c-Myc (N-262, Santa Cruz), green fluorescent protein (GFP) (11814460001, Roche) acetylated H3 (06599, Millipore), acetylated H4 (06866, Millipore), histone H3 (Ab1791, Abcam), histone H4, and horseradish peroxidase coupled secondary antibodies (Dako). Western blots were stained with enhanced chemiluminescence (Pierce), imaged, and quantified with ChemiDoc software (BioRad).
Southern blot analysis
Genomic DNA (10 μg) of tumor samples or primary thymocytes was digested with EcoRI overnight at 37°C. The DNA fragments were separated on a 0.8% agarose gel and transferred to a nitrocellulose membrane. The blots were hybridized with a 32P-labeled probe harboring the Jβ2 region of the TCRβ locus.
HDAC activity assay
Lysates from fresh thymocytes were assayed for HDAC activity using the HDAC fluorimetric activity assay kit (Enzo life Sciences)
Comparative genomic hybridization
Genomic DNA was isolated from tumor samples using the Puregene purification kit (Qiagen). As a reference, we used genomic tail DNA from the same mouse. Tumor and tail DNA were Cy3 and Cy5 labeled using the Dual Color labeling kit (Nimblegen) according to the manufacturer’s instructions. Labeled DNAs were hybridized onto mouse comparative genome hybridization (CGH) 12 × 135K whole-genome tiling arrays. The arrays were scanned on an Agilent scanner (model G2505B) at a resolution of 2 μm double pass at 100% gain of photo multiplier tubes for both channels. The data were analyzed with NimbleScan software (Nimblegen). aCGH data were deposited at the GEO database: accession number GSE43407
Chromosome spreads
Cells were incubated for 90 minutes in medium with 0.05 μg/mL colcemid (Gibco). Hereafter, the cells were washed with phosphate-buffered saline and resuspended in 75 mM potassium chloride and incubated at 37°C for 10 minutes. Subsequently the cells were fixed in methanol/acetic acid (3:1) and dropped on microscope slides. These slides were dried and cells were mounted with Vectashield/DAPI (Vector Laboratories).
Methylation genomic DNA tumors
Genomic DNA was isolated and digested with methylation-sensitive (HpaII) or -insensitive restriction enzymes (MspI) and analyzed on DNA Southern blots. As a probe for methylation analysis of minor satellites, we used pMR150.
Transcriptome analysis and bioinformatics
For gene expression analysis, total RNA from thymi or tumor tissue was extracted, labeled, and hybridized onto Illumina MouseWG-6 v2.0 Expression BeadChip Arrays by the Netherlands Cancer Institute Central Microarray and Deep Sequencing Core Facility according to the manufacturer’s protocol. We mapped 20 312 MuLV integration sites from 1020 tumors in mice with various genetic backgrounds28 to their putative target genes using a kernel-convolved rule-based mapping approach (KC-RBM)29 and the Ensembl reference genome (build 61). Commonly targeted genes (CTGs) were called based on a threshold of at least 1 insertion per target gene. A set of 547 genes consistently deregulated in Hdac1Δ/Δ;Hdac2Δ/+ thymocytes and lymphomas were mapped to mouse Ensembl gene identifiers. Overlap between the resulting 413 mouse Ensembl identifiers and the CTGs was then assessed by performing a Fisher exact test, using the complete set of Ensembl gene identifiers as a reference. Gene expression data were deposited at the ArrayExpress database: accession number E-MTAB-1448
Tissue Microarray
A tissue microarray (TMA) was generated by collecting 3 cores of tumor or normal tissue, as determined by hematoxylin-eosin–stained paraffin-embedded lymphomas as well as 3-week-old thymi. For control and orientation purposes, cores of paraffin-embedded wild-type liver were included in the TMA. Cores were embedded in a paraffin block and subsequently sectioned in 3-μm slides. Hdac1, Hdac2, and p53 staining were performed as described above. Hdac1 staining and Hdac2 staining were used to confirm the genotype of the lymphoma. Scoring for p53 staining intensity was performed by using a p53-mutant lymphoma as a positive control and wild-type thymus as a negative control. A score was assigned only when all 3 cores showed a consistent staining pattern.
p53 status assessment by sequencing, γ-irradiation, and Nutlin-3 treatment
To determine p53 sequence, genomic DNA of primary thymocytes and tumor cell lines was isolated with a DNeasy Blood & Tissue kit (Qiagen). p53 exon 2-11 were PCR amplified and sequenced on a 3730 DNA analyzer (Applied Biosystems). To determine DNA damage–mediated p53 induction, thymocytes were irradiated with 6 Gy using the Gammacell 40 EXACTOR and tumor cell lines were treated with 8 μM Nutlin-3 (Cayman Chemical). Irradiated thymocytes were cultured for 16 hours and treated with Nutlin-3 for 6 hours and subsequently analyzed for p53 protein expression. For the apoptosis assay, 2 × 10⁶ fresh thymocytes were irradiated with 0, 2, 4, 6, 8, and 10 Gy and cultured for 16 hours. Apoptosis was assayed by staining with annexinV and PI and performing subsequent analysis by flow cytometry (FITC-annexinV apoptosis kit, BD-Biosciences).
Chromatin immunoprecipitation
Chromatin immunoprecipitation was performed by cross-linking chromatin from 5 × 10⁷p53−/− T-cell lymphoma cells expressing GFP, Hdac1-GFP, or Hdac2-GFP (R.H.W and J.-H.D, unpublished results) using 1% formaldehyde for 10 minutes at room temperature. Cross-linking was stopped in 1.25 M glycine for 5 minutes on ice. Chromatin was subsequently sonicated in lysis buffer (50 mM Tris-HCl pH 8.0, 10 mM EDTA, 1% SDS, protease inhibitors [Roche]) using a probe sonicator (Bandelin, cycle 90%, output 8, 15 seconds on/off) and subsequently diluted in dilution buffer (10 mM Tris-HCl pH 8.0, 160 mM NaCl, 5 mM EDTA, 1% Triton X-100, protease inhibitors). Chromatin was incubated overnight with 10 μL of 10% bovine serum albumin–blocked GFP-Trap beads (ChromoTek) in dilution buffer at 4°C. Chromatin-bound beads were washed with radioimmunoprecipitation assay buffer (50 mM Tris-HCl pH 8.0, 150 mM NaCl, 0.1% SDS, 0.5% NaDOC, 1% NP-40, protease inhibitors) and with Tris-EDTA (10 mM Tris-HCl, pH 8.0, 1 mM EDTA). To elute chromatin, the beads were incubated in Tris-EDTA plus 2% SDS at 65°C for 15 minutes while shaking. Cross-links were reverted by incubating chromatin at 68°C overnight with proteinase K. DNA was purified using MinElute PCR purification columns (Qiagen) and subjected to quantitative PCR using the Roche LightCycler system. Primers used for qPCR are Jdp2 5′ UTR: 5′-TGTGAGCTGTCACCCATCAT-3′, 5′-CCACCCCAGATAGAGAAGCA-3′; Jdp2 intron 1-2: 5′-ATGCTATGGCTCTGCGTTCT-3′, 5′-TGACCCCTCAAGACAACCTC-3′.
Results
Spontaneous lymphomagenesis in MxCre+;Hdac1L/L and MxCre+;Hdac1L/L;Hdac2L/L mice
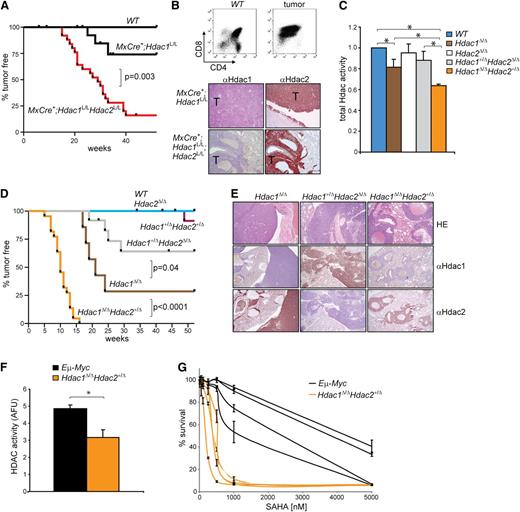
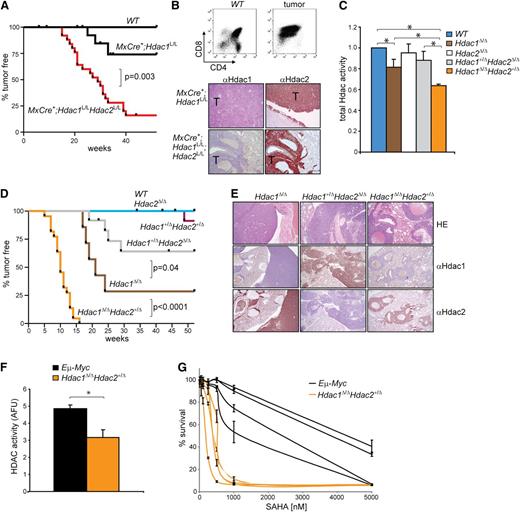
To study HDAC function in vivo, we previously generated conditional knockout alleles for Hdac15 and Hdac2.17 While interferon-inducible MxCre-recombinase–mediated deletion of Hdac1 and Hdac2 in the hematopoietic system resulted in anemia and thrombocytopenia-related death,5 we noted that aging, uninduced, MxCre+;Hdac1L/L and MxCre+;Hdac1L/L;Hdac2L/L mice became lethargic and presented in all cases CD4+CD8+ thymic lymphomas (Figure 1A,B [top panel]). Intriguingly, MxCre+;Hdac1L/L;Hdac2L/L mice developed tumors with a higher incidence (85% vs 25%) and shorter latency (15 weeks vs 25 weeks) compared with MxCre+;Hdac1L/L mice. While Hdac1 expression was absent in lymphomas derived from MxCre+;Hdac1L/L and MxCre+;Hdac1L/L;Hdac2L/L mice, lymphomas derived from both genotypes still expressed Hdac2 (Figure 1B [bottom panel] and supplemental Figure 1A). Interestingly, genetic analysis of MxCre+;Hdac1L/L;Hdac2L/L lymphoma cell lines derived from primary tumors exclusively displayed complete loss of Hdac1, whereas only 1 conditional Hdac2 allele was deleted (supplemental Figure 1B). These results indicate that leaky Cre expression from the Mx promoter resulted in sporadic deletion of Hdac1 and Hdac2. Apparently, loss of Hdac1 or mono-allelic expression of Hdac2 in the absence of Hdac1 conferred a selective advantage in thymocytes, resulting in lymphomagenesis, which uncovers a previously unknown tumor suppressor function for Hdac1 and Hdac2. In addition, the differential lymphoma incidence in MxCre+;Hdac1L/L and MxCre+;Hdac1L/L;Hdac2L/L mice suggests a dosage dependency in tumor suppression by Hdac1 and Hdac2.
Hdac1 and Hdac2 dosage-dependent tumor suppression. (A) Kaplan-Meier tumor-free survival plot of WT, MxCre+;Hdac1L/L and MxCre+;Hdac1L/LHdac2L/L mice. P value was calculated using a χ2 test. (B) CD4/CD8 flow cytometry (top) and Hdac1 and Hdac2 immunohistochemistry (bottom) of tumors from MxCre+;Hdac1L/L and MxCre+;Hdac1L/LHdac2L/L mice. (C) Global HDAC activity in thymocytes with indicated genotypes relative to WT thymocytes. (D) Kaplan-Meier tumor-free survival plot of mice harboring thymocytes with indicated genotypes. P values were calculated using a χ2 test. (E) Representative pictures of Hdac1 and Hdac2 immunohistochemical analysis of lymphomas with indicated genotypes. Magnification: 100×. (F) Global HDAC activity in 4 independent Eμ−Myc and 4 independent Hdac1Δ/Δ;Hdac2Δ/+ tumor cell lines. (G) Dose response curves of 4 independent Eμ−Myc and 4 independent Hdac1Δ/Δ;Hdac2Δ/+ tumor cell lines treated increasing concentrations of suberoylanilide hydroxamic acid (SAHA). Error bars indicate standard deviations of 3 independent experiments per tumor cell line. WT, wild type.
Hdac1 and Hdac2 dosage-dependent tumor suppression. (A) Kaplan-Meier tumor-free survival plot of WT, MxCre+;Hdac1L/L and MxCre+;Hdac1L/LHdac2L/L mice. P value was calculated using a χ2 test. (B) CD4/CD8 flow cytometry (top) and Hdac1 and Hdac2 immunohistochemistry (bottom) of tumors from MxCre+;Hdac1L/L and MxCre+;Hdac1L/LHdac2L/L mice. (C) Global HDAC activity in thymocytes with indicated genotypes relative to WT thymocytes. (D) Kaplan-Meier tumor-free survival plot of mice harboring thymocytes with indicated genotypes. P values were calculated using a χ2 test. (E) Representative pictures of Hdac1 and Hdac2 immunohistochemical analysis of lymphomas with indicated genotypes. Magnification: 100×. (F) Global HDAC activity in 4 independent Eμ−Myc and 4 independent Hdac1Δ/Δ;Hdac2Δ/+ tumor cell lines. (G) Dose response curves of 4 independent Eμ−Myc and 4 independent Hdac1Δ/Δ;Hdac2Δ/+ tumor cell lines treated increasing concentrations of suberoylanilide hydroxamic acid (SAHA). Error bars indicate standard deviations of 3 independent experiments per tumor cell line. WT, wild type.
Thymocyte-specific deletion of Hdac1 and Hdac2 results in an HDAC activity gradient
To test whether Hdac1 and Hdac2 suppress tumorigenesis in a dosage-dependent manner, we generated a thymocyte-specific series of inactivated Hdac1 and Hdac2 alleles using Lck-promoter–driven Cre-recombinase expression. Western blot analysis of isolated thymocytes from these mice indicated efficient deletion of Hdac1 and Hdac2 (supplemental Figure 2A,B). Ablation of Hdac1 resulted in elevated Hdac2 protein levels, while class I Hdac3 and Hdac8 proteins levels were unaffected (supplemental Figure 2B). While Hdac2 deficiency did not result in increased Hdac1 proteins levels, loss of 1 allele of Hdac1 in the absence of Hdac2 resulted in elevated Hdac1 protein levels. These results suggest compensatory regulation of Hdac1 and Hdac2 protein levels in thymocytes (supplemental Figure 2B).
Deletion of combinations of Hdac1 and Hdac2 alleles resulted in differential effects on global HDAC activity, as HDAC-activity measurements in 1-week-old thymocytes revealed a progressive loss of global HDAC activity in wild-type > Hdac1+/Δ;Hdac2Δ/Δ ≥ Hdac1Δ/Δ > Hdac1Δ/Δ;Hdac2+/Δ thymocytes (Figure 1C). Although ablation of Hdac1 resulted specifically in elevated Hdac2 protein levels in Hdac1Δ/Δ thymocytes (supplemental Figure 2B), it could only partially compensate for the loss of global HDAC activity (Figure 1C). Indeed, mono-allelic expression of Hdac2 in Hdac1-deficient (Hdac1Δ/Δ;Hdac2+/Δ) thymocytes resulted in a further reduction of HDAC activity (Figure 1C). These results indicate a dynamic interplay between Hdac1 and Hdac2 in contributing to global HDAC activity in thymocytes in which Hdac1 seems to act as dominant histone deacetylase. In conclusion, we established an in vivo gradient of Hdac1 and Hdac2 activity that provides a unique model to study HDAC-activity dosage in tumor suppression.
Hdac1 and Hdac2 dosage-dependent tumor suppression
To test whether stepwise reduction of HDAC activity resulted in tumorigenesis, we monitored cohorts of mice carrying combinations of inactivated Hdac1 and Hdac2 alleles over time. Intriguingly, a progressive reduction of HDA activity correlated with increased tumorigenesis in mice. Whereas LckCre;Hdac1+/Δ;Hdac2Δ/Δ mice developed tumors with a 25% incidence and a mean latency of >52 weeks, tumor incidence increased significantly in LckCre;Hdac1Δ/Δ mice with a 75% incidence and a 23-week mean latency. Consistent with a further reduction of global HDAC activity, tumorigenesis was drastically accelerated in LckCre;Hdac1Δ/Δ;Hdac2+/Δ mice, with a 100% tumor incidence and a mean latency of 10 weeks (Figure 1D). Tumors across genotypes were identified as thymic lymphomas, which disseminated predominantly to lung, kidney, liver, and lymph nodes (supplemental Figure 2C,D). Mono-allelic expression of Hdac1 and Hdac2 was maintained in Hdac1+/Δ;Hdac2Δ/Δ and Hdac1Δ/Δ;Hdac2+/Δ lymphomas, as evidenced by Hdac1 and Hdac2 immunohistochemical staining on paraffin-embedded primary tumors and genomic analysis of Hdac1 and Hdac2 alleles in lymphoma cell lines (Figure 1E; supplemental Figure 2E). These findings were corroborated by the appearance of a thymic lymphoma in 1 of 10 LckCre;Hdac1+/Δ;Hdac2+/Δ mice at 46 weeks that lost Hdac1 and retained Hdac2 expression (Figure 1D and supplemental Figure 2F). Genetic analysis of this tumor indicated loss of the wild-type Hdac1 allele and maintenance of 1 wild-type Hdac2 copy, thereby recapitulating Hdac1Δ/Δ;Hdac2+/Δ tumors (supplemental Figure 2G). This result suggests that reduced Hdac1 and Hdac2 levels generate a tumor-prone condition that allows in vivo selection for Hdac1 loss of heterozygosity.
In summary, we established, for the first time, a tumor suppressor function for Hdac1 and Hdac2, which act collectively in a dosage-dependent manner.
Complete loss of Hdac1 and Hdac2 abrogates lymphomagenesis
Surprisingly, further reduction of Hdac1 and Hdac2 in LckCre;Hdac1Δ/Δ;Hdac2Δ/Δ (DKO) mice never resulted in tumors lacking both Hdac1 and Hdac2. However, it did result in selection for Hdac1Δ/Δ;Hdac2Δ/+ thymocytes and consequently Hdac1Δ/Δ;Hdac2Δ/+ lymphomas, thereby phenocopying LckCre;Hdac1Δ/Δ;Hdac2Δ/+ mice. In agreement with a selection for Hdac1Δ/Δ;Hdac2Δ/+ thymocytes in DKO mice, the kinetics of tumor development in DKO mice are significantly slower compared with that in LckCre;Hdac1Δ/Δ;Hdac2Δ/+ mice (supplemental Figure 2H). In summary, although Hdac1 and Hdac2 suppress lymphomagenesis in a dosage-dependent manner, complete inactivation of Hdac1 and Hdac2 abrogates lymphomagenesis.
A critical level of HDAC activity is required for tumor maintenance
A complete inactivation of Hdac1 and Hdac2 abrogated lymphomagenesis suggests a requirement for critical HDAC activity to initiate or maintain tumorigenesis. Indeed, pharmacological inhibition of remaining HDAC activity in established Hdac1Δ/Δ;Hdac2Δ/+ lymphoma cell lines resulted in a dose-dependent cell death, indicating that tumor maintenance is dependent on critical HDAC activity levels (Figure 1G). Interestingly, Hdac1Δ/Δ;Hdac2+/Δ lymphoma cell lines, which displayed relatively low HDAC activity compared with Hdac1/2-expressing Eμ−Myc lymphoma cell lines, were 2- to 10-fold more sensitive to HDACi compared with Eμ−Myc lymphoma cell lines (Figure 1F,G). These data show that although reduced HDAC activity facilitates oncogenic transformation in normal cells, the resulting tumor cells remain highly dependent on HDAC activity, thereby exposing a cancer cell vulnerability.
HDAC-activity, dosage-dependent increase of ISP thymocytes in preleukemic thymi
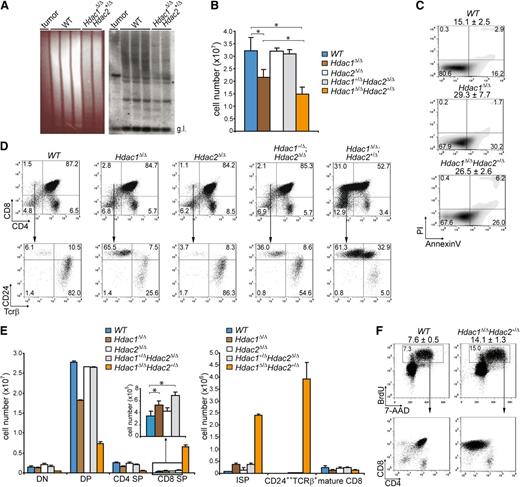
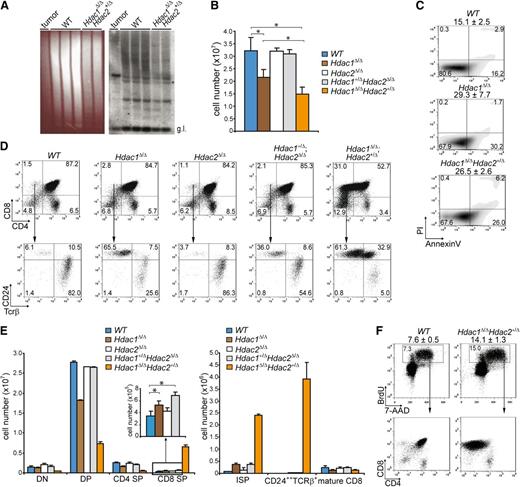
To investigate whether deregulated thymocyte development underlies lymphoma development, we analyzed T-cell differentiation in wild-type LckCre;Hdac2Δ/ΔLckCre;Hdac1+/Δ;Hdac2Δ/Δ, LckCre;Hdac1Δ/Δ, and LckCre;Hdac1Δ/Δ;Hdac2+/Δ mice. T-cell receptor β (Tcrβ) diversity analysis of LckCre;Hdac1Δ/Δ;Hdac2+/Δ thymi revealed a polyclonal population of thymocytes, indicative for preleukemic Hdac1Δ/Δ;Hdac2+/Δ thymocytes (Figure 2A). LckCre;Hdac1Δ/Δ and LckCre;Hdac1Δ/Δ;Hdac2+/Δ mice showed reduced thymocyte numbers that were associated with increased apoptosis and a specific decrease in CD4;CD8 double positive (DP) thymocytes (Figure 2B,C,D [top panel], E [left panel]). Remarkably, LckCre;Hdac1Δ/Δ;Hdac2+/Δ mice displayed a dramatic increase in CD8 single-positive (CD8 SP) thymocytes, which predominantly consisted of immature CD8 SP (ISP) thymocytes, as determined by CD24 and TCRβ surface markers (Figure 2D,E). Moreover, we observed a dosage-dependent expansion of the ISP thymocyte population in all lymphoma-prone genotypes (LckCre;Hdac1+/Δ;Hdac2Δ/Δ, LckCre;Hdac1Δ/Δ and LckCre;Hdac1Δ/Δ;Hdac2+/Δ) that correlated with global HDAC activity levels and tumor incidence (Figure 2D [bottom panel], E [right panel]). In vivo BrdU labeling revealed a twofold increase in the percentage of BrdU-positive cells in 1-week-old LckCre;Hdac1Δ/Δ;Hdac2+/Δ thymi, which consisted primarily of CD8 SP cells (Figure 2F), indicating the proliferative capacity of the expanded ISP population. These data indicate a crucial role for Hdac1 and Hdac2 in the regulation of pre–T-cell development by controlling ISP thymocytes, a T-cell developmental stage that was previously implicated in lymphomagenesis.30 The correlations between global HDAC activity, tumor latency, and tumor incidence and ISP thymocyte numbers strongly suggests that Hdac1 and Hdac2 suppress lymphomagenesis by controlling ISP thymocytes in a dosage-dependent manner.
Hdac1 and Hdac2 control pre–T-cell development in a dosage-dependent manner. (A) Tcrβ repertoire determined in 3-week-old WT and Hdac1Δ/Δ;Hdac2Δ/+ thymi by Southern blot analysis using a Jβ2 probe sequence (right panel). Hdac1Δ/Δ;Hdac2Δ/+ lymphoma DNA was used as a positive control, while ethidium bromide–stained gel served as a loading control (left panel). (B) Quantification of thymocytes from 1-week-old mice of the indicated genotypes (n = 3 per genotype). (C) Apoptosis in thymocytes of 1-week-old WT, LckCre;Hdac1Δ/Δ and LckCre;Hdac1Δ/Δ;Hdac2Δ/+ mice, as determined by annexinV and PI staining. Mean percentages of apoptotic (annexinV+PI-) cells are presented on top (n = 3 mice per genotype). (D) Representative dot plots of CD4/CD8 (top) and CD24/TCRβ (bottom) flow cytometric analyses of thymi from 1-week-old mice with indicated genotypes. (E) Quantification of thymic subsets of 1-week-old mice with indicated genotypes. DN = CD4-CD8-, DP = CD4+CD8+, CD4 SP = CD4+CD8-, CD8 SP = CD4-CD8+ (left); ISP = CD4-CD8+CD24+Tcrβ+/−, mature CD8 = CD4-CD8+CD24+/−Tcrβ+ (right). (F) Dot plots representing BrdU-7-AAD flow cytometric analysis of thymocytes from WT and LckCre;Hdac1Δ/Δ;Hdac2Δ/+ mice 1.5 hours after BrdU injection. Average and standard deviation of BrdU-positive thymocytes are indicated on top (n = 3 mice per group). WT, wild type.
Hdac1 and Hdac2 control pre–T-cell development in a dosage-dependent manner. (A) Tcrβ repertoire determined in 3-week-old WT and Hdac1Δ/Δ;Hdac2Δ/+ thymi by Southern blot analysis using a Jβ2 probe sequence (right panel). Hdac1Δ/Δ;Hdac2Δ/+ lymphoma DNA was used as a positive control, while ethidium bromide–stained gel served as a loading control (left panel). (B) Quantification of thymocytes from 1-week-old mice of the indicated genotypes (n = 3 per genotype). (C) Apoptosis in thymocytes of 1-week-old WT, LckCre;Hdac1Δ/Δ and LckCre;Hdac1Δ/Δ;Hdac2Δ/+ mice, as determined by annexinV and PI staining. Mean percentages of apoptotic (annexinV+PI-) cells are presented on top (n = 3 mice per genotype). (D) Representative dot plots of CD4/CD8 (top) and CD24/TCRβ (bottom) flow cytometric analyses of thymi from 1-week-old mice with indicated genotypes. (E) Quantification of thymic subsets of 1-week-old mice with indicated genotypes. DN = CD4-CD8-, DP = CD4+CD8+, CD4 SP = CD4+CD8-, CD8 SP = CD4-CD8+ (left); ISP = CD4-CD8+CD24+Tcrβ+/−, mature CD8 = CD4-CD8+CD24+/−Tcrβ+ (right). (F) Dot plots representing BrdU-7-AAD flow cytometric analysis of thymocytes from WT and LckCre;Hdac1Δ/Δ;Hdac2Δ/+ mice 1.5 hours after BrdU injection. Average and standard deviation of BrdU-positive thymocytes are indicated on top (n = 3 mice per group). WT, wild type.
Hdac1 and Hdac2 are required for early thymocyte development
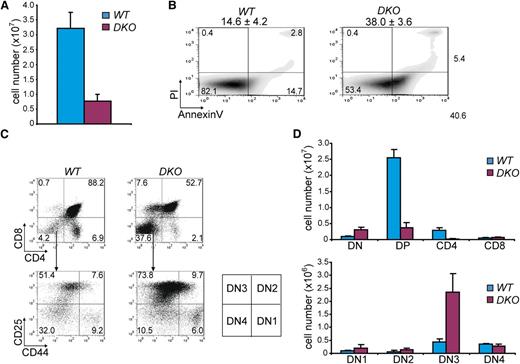
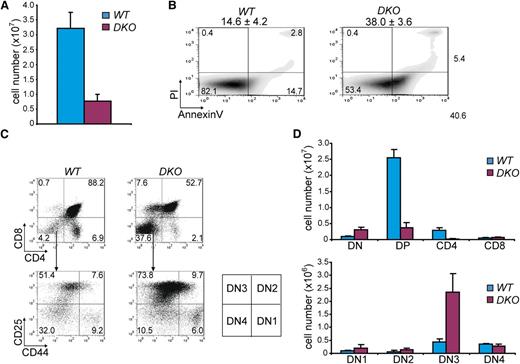
In order to provide a rationale for the absence of Hdac1- and Hdac2-deficient tumors in LckCre;Hdac1Δ/Δ;Hdac2Δ/Δ mice, we analyzed thymi when these mice were 1 week of age. Total thymocyte numbers were dramatically reduced compared with wild-type thymocytes and LckCre;Hdac1Δ/Δ;Hdac2+/Δ thymocytes (Figures 3A and 2A) and associated with increased apoptosis (Figure 3B). Surprisingly, flow cytometric analysis showed a fivefold increase in CD4;CD8 double negative (DN) thymocytes specifically in LckCre;Hdac1Δ/Δ;Hdac2Δ/Δ thymi, which was accompanied by a severe reduction in CD4;CD8 DP thymocytes (Figure 3C,D). Thymic analysis across genotypes revealed specifically in DKO thymi an early developmental block at the CD4-CD8- double negative stage 3 (DN3; Figure 3D and supplemental Figure 3A,B), demonstrating that complete ablation of Hdac1 and Hdac2 is not compatible with developmental progression of early thymocytes and consequently prevents tumorigenesis. Collectively, our results show that a gradual decrease in Hdac1- and Hdac2-governed HDAC-activity predisposes to tumorigenesis, whereas complete loss of Hdac1 and Hdac2 prevents oncogenic transformation.
Hdac1 and Hdac2 collectively show obligate haploinsufficiency in tumor suppression. (A) Quantification of thymocytes in 1-week-old WT and LckCre;Hdac1Δ/Δ;Hdac2Δ/Δ (DKO) mice (n = 3 mice per genotype). (B) Apoptosis in thymi of 1-week-old WT and DKO mice, as determined by annexinV and PI staining. Mean percentages and standard deviations of apoptotic (annexinV+PI-) cells are presented on top (n = 3 mice per genotype). (C) Representative CD4/CD8 (top panel) and CD25/CD44 (bottom) flow cytometry dot plots of thymocytes from 1-week-old WT and DKO mice. Scheme on the right indicates DN stages of thymocyte development. (D) Quantification of thymic subsets in 1-week-old WT and DKO mice. DN = CD4-CD8-; DP = CD4+CD8+; CD4 SP = CD4+CD8-; CD8 SP = CD4-CD8+; DN1 = CD25-CD44+; DN2 = CD25+CD44+; DN3 = CD25+CD44-; DN4 = CD25-CD44-. WT, wild type.
Hdac1 and Hdac2 collectively show obligate haploinsufficiency in tumor suppression. (A) Quantification of thymocytes in 1-week-old WT and LckCre;Hdac1Δ/Δ;Hdac2Δ/Δ (DKO) mice (n = 3 mice per genotype). (B) Apoptosis in thymi of 1-week-old WT and DKO mice, as determined by annexinV and PI staining. Mean percentages and standard deviations of apoptotic (annexinV+PI-) cells are presented on top (n = 3 mice per genotype). (C) Representative CD4/CD8 (top panel) and CD25/CD44 (bottom) flow cytometry dot plots of thymocytes from 1-week-old WT and DKO mice. Scheme on the right indicates DN stages of thymocyte development. (D) Quantification of thymic subsets in 1-week-old WT and DKO mice. DN = CD4-CD8-; DP = CD4+CD8+; CD4 SP = CD4+CD8-; CD8 SP = CD4-CD8+; DN1 = CD25-CD44+; DN2 = CD25+CD44+; DN3 = CD25+CD44-; DN4 = CD25-CD44-. WT, wild type.
Chromosome 15 trisomy is associated with c-Myc overexpression in monoclonal T-cell lymphomas
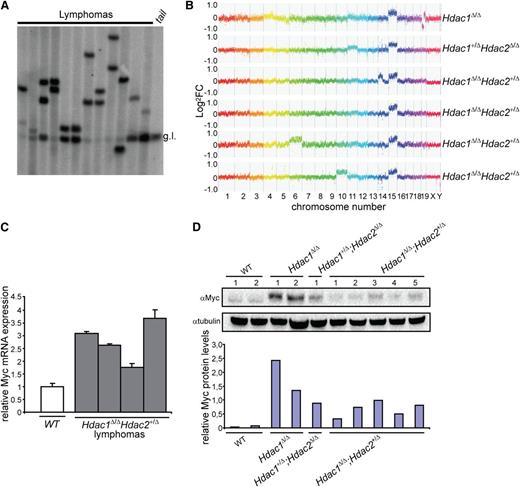
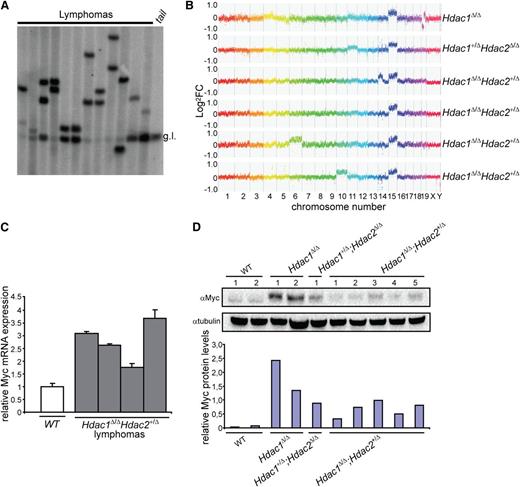
Analysis of Tcrβ diversity revealed a monoclonal origin of Hdac1Δ/Δ;Hdac2+/Δ lymphomas, suggesting a requirement for additional genetic events driving full oncogenic transformation upon reduced HDAC activity (Figure 4A). CGH of normal vs tumor DNA identified, independent of genotype and HDAC activity, trisomy of chromosome 15 as a common and early genetic alteration in all analyzed lymphomas (Figure 4B). Chromosome 15 trisomy was previously observed in murine thymic lymphomas and invariably associated with overexpression of the c-Myc oncogene, a major driver of lymphomagenesis located on chromosome 15.31 Indeed, c-Myc expression levels were increased in Hdac1Δ/Δ, Hdac1+/Δ;Hdac2Δ/Δ and Hdac1Δ/Δ;Hdac2+/Δ tumors (Figure 4C,D), suggesting that during lymphomagenesis, reduced HDAC activity allows the clonal outgrowth of c-Myc overexpressing thymocytes.
c-Myc overexpression–associated chromosome 15 trisomy in monoclonal T-cell lymphoma. (A) Tcrβ diversity in 12 independent Hdac1Δ/ΔHdac2Δ/+ lymphomas analyzed by Southern blot, using a Jβ2 region-specific probe, g.l. = germline Tcrβ. (B) Representative CGH plots of 6 independent lymphomas with indicated genotypes. (C) c-Myc levels in WT thymocytes and Hdac1Δ/ΔHdac2Δ/+ tumors analyzed by qPCR. (D) c-Myc protein levels in wild-type thymi as well as Hdac1Δ/Δ, Hdac1+/Δ;Hdac2Δ/Δ and Hdac1Δ/Δ;Hdac2+/Δ lymphoma cell lines. Bottom panel shows quantification of c-Myc protein levels relative to tubulin. WT, wild type.
c-Myc overexpression–associated chromosome 15 trisomy in monoclonal T-cell lymphoma. (A) Tcrβ diversity in 12 independent Hdac1Δ/ΔHdac2Δ/+ lymphomas analyzed by Southern blot, using a Jβ2 region-specific probe, g.l. = germline Tcrβ. (B) Representative CGH plots of 6 independent lymphomas with indicated genotypes. (C) c-Myc levels in WT thymocytes and Hdac1Δ/ΔHdac2Δ/+ tumors analyzed by qPCR. (D) c-Myc protein levels in wild-type thymi as well as Hdac1Δ/Δ, Hdac1+/Δ;Hdac2Δ/Δ and Hdac1Δ/Δ;Hdac2+/Δ lymphoma cell lines. Bottom panel shows quantification of c-Myc protein levels relative to tubulin. WT, wild type.
Cytogenetic analysis of Hdac1Δ/Δ, Hdac1+/Δ;Hdac2Δ/Δ and Hdac1Δ/Δ;Hdac2+/Δ lymphoma cell lines displayed mild aneuploidy and increased centromeric attachment of multiple chromosomes (supplemental Figure 4A,B), suggesting that reduced HDAC activity may result in chromosome missegregation and generate chromosomal instability. However, analysis of preleukemic thymocytes from 1-week-old Hdac1Δ/Δ;Hdac2+/Δ mice revealed no chromosomal abnormalities nor altered DNA methylation of pericentric minor satellite sequences (supplemental Figure 4C,D), indicating that gradual loss of HDAC activity does not drive tumorigenesis by inducing massive, acute chromosomal instability.
Hdac1/2 dosage-dependent alleviation of p53 inactivation in lymphomagenesis
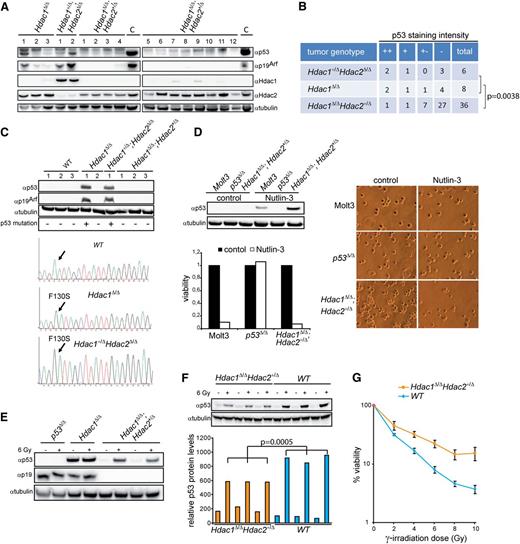
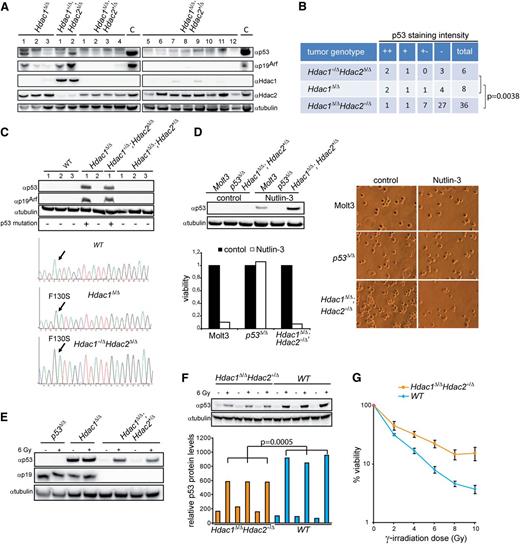
Myc-driven tumorigenesis requires inactivation of the p19Arf-Mdm2-p53 pathway through either activating Notch1 mutations, Mdm2 amplification, inactivating p53 mutations or deletion of the Cdkn2a locus encoding p16Ink4a and p19Arf33. Hdac1Δ/Δ;Hdac2+/Δ lymphomas did not harbor Notch1 PEST domain mutations, and no transcriptional changes were found in Notch1 targets (data not shown, supplemental Figure 5A). Furthermore, no amplification or overexpression of the p53 antagonists Mdm2 and Mdmx was observed in these lymphomas (Figure 4B and supplemental Figure 5A). Western blot analysis of Hdac1+/Δ;Hdac2Δ/Δ and Hdac1Δ/Δ lymphomas revealed elevated p53 in combination with high p19Arf expression, indicative for inactivating mutations in p53.33,34 Remarkably, this was not observed in Hdac1Δ/Δ;Hdac2+/Δ lymphomas (Figure 5A). p53 immunohistochemical analysis of a TMA containing 50 lymphomas revealed a statistically significant decreased number of Hdac1Δ/Δ;Hdac2+/Δ tumors with high p53 expression compared with Hdac1+/Δ;Hdac2Δ/Δ and Hdac1Δ/Δ tumors (P = .0038; Fishers test; Figure 5B and supplemental Figure 5B). Moreover, sequencing of p53 exons 2-11 revealed p53 wild-type sequences in Hdac1Δ/Δ;Hdac2+/Δ lymphoma cell lines, while only missense mutations in the p53 DNA binding domain, a hotspot for tumor-relevant p53 mutations were found in Hdac1+/Δ;Hdac2Δ/Δ and Hdac1Δ/Δ lymphoma cell lines, which displayed p53 protein stabilization and p19Arf expression (Figure 5C). Consistently, inhibition of Mdm2-p53 interaction using the small molecule inhibitor Nutlin-3 resulted in stabilization of p53 protein levels and cell death only in Hdac1Δ/Δ;Hdac2+/Δ lymphoma cell lines similar to a wild-type p53 carrying human lymphoma cell line (MOLT-3) (Figure 5D). In addition, γ-irradiation of Hdac1Δ/Δ;Hdac2+/Δ lymphoma cell lines resulted in increased p53 protein levels, indicative for nonmutated p53 (Figure 5E). These results indicate an Hdac1 and Hdac2 dosage dependency for inactivation of the p19Arf-Mdm2-p53 tumor suppressor pathway by p53 inactivating mutations during Myc-driven lymphomagenesis.
Hdac1 and Hdac2 dosage-dependent requirement for p53 inactivation. (A) Western blot of protein lysates from tumors with indicated genotypes using Hdac1, Hdac2, p19Arf, and p53 antibodies. α-tubulin served as loading control. (B) Summary of p53 staining intensity, indicative for stabilized/mutant p53, of a tissue micro-array containing Hdac1+/Δ;Hdac2Δ/Δ (n = 6), Hdac1Δ/Δ (n = 8), and Hdac1Δ/Δ;Hdac2+/Δ (n = 36) tumors, revealed a significant decrease of mutant p53 in Hdac1Δ/Δ;Hdac2+/Δ tumors (Fisher test, P = .0038; bottom table). (C) Western blot analysis of Hdac1+/Δ;Hdac2Δ/Δ, Hdac1Δ/Δ and Hdac1Δ/Δ;Hdac2+/Δ lymphoma cell lines as well as wild-type thymocytes for expression of p53 and p19Arf. Tubulin served as a loading control (top). p53 DNA binding domain missense mutations (F130S) in Hdac1Δ/Δ and Hdac1+/Δ;Hdac2Δ/Δ tumor cell lines. p53 sequence of wild-type thymocytes served as reference (bottom). (D) Western blot analysis of Nutlin-3–treated Hdac1Δ/Δ;Hdac2Δ/+ lymphoma cell line for expression of p53. Human MOLT-3 T-ALL cell line harboring wild-type p53 and a murine p53Δ/Δ T-cell lymphoma served as controls. Tubulin served as a loading control. Nutlin-3 treatment resulted only in wild-type p53 bearing lymphoma cell lines in loss of viability, as determined by cell-titer blue assay (lower panel) and visual inspection of cell cultures (right panel; magnification 200×). (E) Western blot analysis of protein lysates of p53Δ/Δ, Hdac1Δ/Δ, and Hdac1Δ/Δ;Hdac2+/Δ tumor cell lines treated with ionizing radiation (6 Gy) for p53 and p19Arf. Hdac1Δ/Δ;Hdac2+/Δ tumor cell lines showed radiation-induced p53 in contrast to an Hdac1Δ/Δ lymphoma cell line expressing mutant p53. (F) Western blot analysis (top panel) of p53 protein levels in 1-week-old WT and Hdac1Δ/Δ;Hdac2Δ/+ thymocytes, 6 hours after mock or 6 Gy γ-irradiation. Tubulin served as loading control. Bottom panel shows quantification of p53 levels relative to tubulin. Error bars indicate standard deviations of thymocyte cultures isolated from 3 independent mice per genotype. (G) Percentage of viable cells in 3 independent WT and Hdac1Δ/Δ;Hdac2Δ/+ thymocyte cultures 24 hours after indicated doses of γ-irradiation. WT, wild type.
Hdac1 and Hdac2 dosage-dependent requirement for p53 inactivation. (A) Western blot of protein lysates from tumors with indicated genotypes using Hdac1, Hdac2, p19Arf, and p53 antibodies. α-tubulin served as loading control. (B) Summary of p53 staining intensity, indicative for stabilized/mutant p53, of a tissue micro-array containing Hdac1+/Δ;Hdac2Δ/Δ (n = 6), Hdac1Δ/Δ (n = 8), and Hdac1Δ/Δ;Hdac2+/Δ (n = 36) tumors, revealed a significant decrease of mutant p53 in Hdac1Δ/Δ;Hdac2+/Δ tumors (Fisher test, P = .0038; bottom table). (C) Western blot analysis of Hdac1+/Δ;Hdac2Δ/Δ, Hdac1Δ/Δ and Hdac1Δ/Δ;Hdac2+/Δ lymphoma cell lines as well as wild-type thymocytes for expression of p53 and p19Arf. Tubulin served as a loading control (top). p53 DNA binding domain missense mutations (F130S) in Hdac1Δ/Δ and Hdac1+/Δ;Hdac2Δ/Δ tumor cell lines. p53 sequence of wild-type thymocytes served as reference (bottom). (D) Western blot analysis of Nutlin-3–treated Hdac1Δ/Δ;Hdac2Δ/+ lymphoma cell line for expression of p53. Human MOLT-3 T-ALL cell line harboring wild-type p53 and a murine p53Δ/Δ T-cell lymphoma served as controls. Tubulin served as a loading control. Nutlin-3 treatment resulted only in wild-type p53 bearing lymphoma cell lines in loss of viability, as determined by cell-titer blue assay (lower panel) and visual inspection of cell cultures (right panel; magnification 200×). (E) Western blot analysis of protein lysates of p53Δ/Δ, Hdac1Δ/Δ, and Hdac1Δ/Δ;Hdac2+/Δ tumor cell lines treated with ionizing radiation (6 Gy) for p53 and p19Arf. Hdac1Δ/Δ;Hdac2+/Δ tumor cell lines showed radiation-induced p53 in contrast to an Hdac1Δ/Δ lymphoma cell line expressing mutant p53. (F) Western blot analysis (top panel) of p53 protein levels in 1-week-old WT and Hdac1Δ/Δ;Hdac2Δ/+ thymocytes, 6 hours after mock or 6 Gy γ-irradiation. Tubulin served as loading control. Bottom panel shows quantification of p53 levels relative to tubulin. Error bars indicate standard deviations of thymocyte cultures isolated from 3 independent mice per genotype. (G) Percentage of viable cells in 3 independent WT and Hdac1Δ/Δ;Hdac2Δ/+ thymocyte cultures 24 hours after indicated doses of γ-irradiation. WT, wild type.
Although Hdac1Δ/Δ;Hdac2+/Δ lymphomas harbor wild-type p53 sequence, preleukemic Hdac1Δ/Δ;Hdac2+/Δ thymocytes showed significantly reduced p53 levels upon γ-irradiation compared with wild-type thymocytes (Figure 5F). In agreement with impaired p53 function, survival of Hdac1Δ/Δ;Hdac2+/Δ thymocytes was increased upon differential doses of γ-irradiation (Figure 5G). These findings suggest that reduced Hdac1- and Hdac2-governed HDAC activity in thymocytes resulted in an impaired p53 pathway, which bypasses the requirement for p53 mutations in c-Myc–induced lymphomagenesis. Consequently, impaired p53 function may allow clonal outgrowth of c-Myc overexpressing thymocytes but also tolerate mitotic slippage resulting in chromosome 15 trisomy.
Hdac1 and Hdac2 regulate Myc-collaborating genes
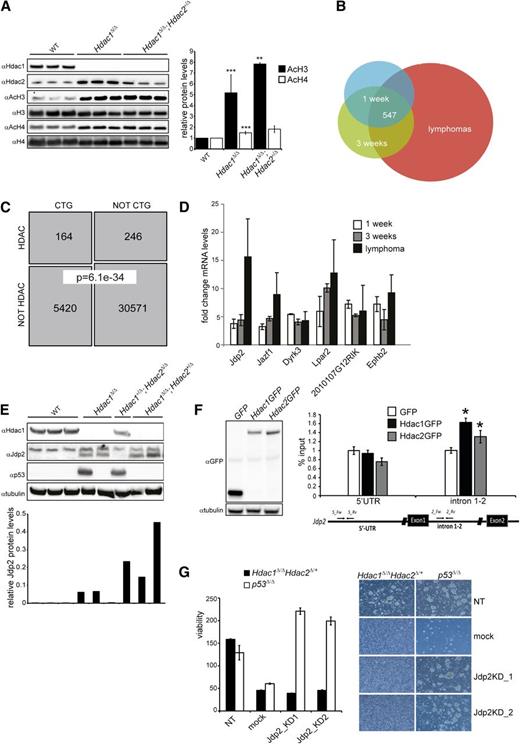
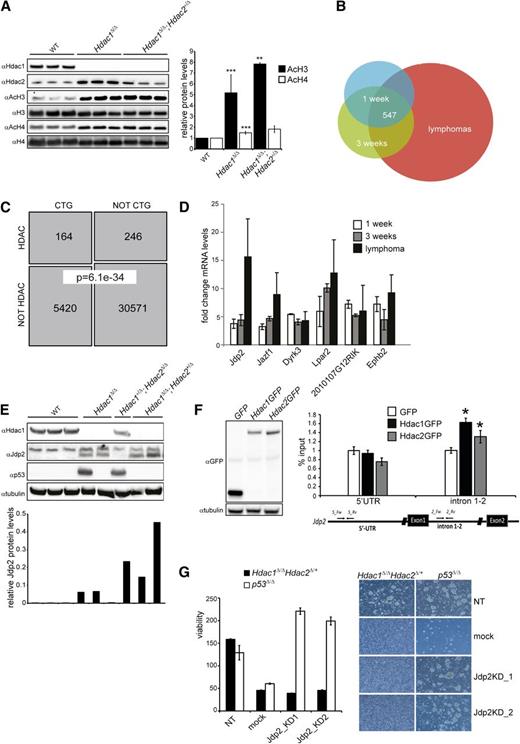
As transcriptional regulation is a prime function of Hdac1 and Hdac2, we used Hdac1 and Hdac2 transcriptomes in thymoyctes and lymphomas to obtain insight into Hdac1/2-mediated suppression of lymphomagenesis. In agreement with reduced HDAC activity (Figure 1C), Hdac1Δ/Δ and Hdac1Δ/Δ;Hdac2+/Δ thymocytes displayed increased levels of acetylated histone H4 and a dosage-dependent increase in acetylated histone 3H, a hallmark of transcriptional activation (Figure 6A). Transcriptomic analysis of preleukemic thymocytes from 1- and 3- week-old LckCre;Hdac1Δ/Δ;Hdac2+/Δ mice and Hdac1Δ/Δ;Hdac2+/Δ tumors revealed consistent transcriptional deregulation of 547 transcripts throughout lymphomagenesis, of which 238 transcripts were also found deregulated in Hdac1+/Δ;Hdac2Δ/Δ and Hdac1Δ/Δ tumors (Figure 6B and supplemental Tables 1 and 2). In correlation with HDAC activity, tumor incidence, and tumor latency, we observed a dosage-dependent fold change in mRNA levels of many deregulated genes in Hdac1Δ/Δ and Hdac1Δ/Δ;Hdac2+/Δ thymocytes, providing a rationale for the observed dosage dependency in tumor suppression (supplemental Figure 6A and Figure 1D). Since chromosome 15 trisomy and Myc overexpression was a common feature of Hdac1/2 lymphomas, we investigated whether genes deregulated in these lymphomas were enriched for genes able to collaborate with Myc in oncogenic transformation. Among the deregulated genes we identified, a significant enrichment (164 of 410 mapped transcripts; Fisher exact test, P = 6.13e-34) of CTGs previously found in insertional mutagenesis screens aimed at identifying Myc collaborating genes in lymphomagenesis28,29 (Figure 6C and supplemental Table 3). These data indicate that Hdac1 and Hdac2, in a dosage-dependent manner, regulate the expression of genes able to synergize with c-Myc in oncogenic transformation of thymocytes.
Jdp2, a Myc-collaborating gene is a direct target of Hdac1/2 and is required for the survival of Hdac1Δ/Δ; Hdac2+/Δ lymphomas. (A) Western blot analysis of histone H3 and H4 acetylation in nuclear lysates of preleukemic thymocytes from 3 independent 1-week-old wild-type, LckCre+;Hdac1Δ/Δ and LckCre+;Hdac1Δ/Δ;Hdac2+/Δ mice (left). Acetylated H3 and H4 signals were quantified over total H3 and H4 signal, respectively. While AcH3/H4 levels were significantly higher in LckCre+;Hdac1Δ/Δ and LckCre+;Hdac1Δ/Δ;Hdac2+/Δ thymocytes compared with wild-type thymocytes, only AcH3 levels were increased in LckCre+;Hdac1Δ/Δ;Hdac2+/Δ thymocytes compared with LckCre+;Hdac1Δ/Δ counterparts. (B) Venn diagram demonstrating the overlap between sets of differentially expressed genes (adjusted P value < 0.05, fold change ≥1.5×, n ≥3 independent mice per group) in 1-week-old and 3-week-old Hdac1Δ/Δ;Hdac2Δ/+ thymocytes and lymphomas. (C) Schematic representation of the overlap between CTGs identified in insertional mutagenesis screens and genes deregulated in Hdac1Δ/Δ;Hdac2Δ/+ thymocytes and lymphomas (“HDAC”; Fisher exact test, P = 6.36e-10). (D) Fold changes in mRNA of Myc-collaborating genes Jdp2, Jazf1, Dyrk3, Lpar2, 2010107G12RIK, and Ephb2 in 1-week-old and 3-week-old Hdac1Δ/Δ;Hdac2Δ/+ thymocytes and Hdac1Δ/Δ;Hdac2Δ/+ lymphomas, relative to age-matched wild-type thymi. (E) Western blot analysis of protein lysates of lymphomas of indicated genotypes for Hdac1, Jdp2 (lower band), and p53. Tubulin served as a loading control. (F) Western blot analysis (left) and chromatin immunoprecipitation analysis (right) of GFP, Hdac1-GFP, or Hdac2 GFP expressing p53−/− T-cell lymphoma cell lines for the Jdp2 intron 1-2 and 5′ UTR. (G) Cell viability assessed by cell titer blue assay (left) and representative images (right; magnification 100×) of Hdac1Δ/Δ;Hdac2Δ/+ and p53−/− lymphoma cell lines infected with independent lentiviral Jdp2 shRNA constructs (Jdp2_KD1 or Jdp2_KD2), a lentiviral nontargeting shRNA (NT) construct, or mock infection. WT, wild type.
Jdp2, a Myc-collaborating gene is a direct target of Hdac1/2 and is required for the survival of Hdac1Δ/Δ; Hdac2+/Δ lymphomas. (A) Western blot analysis of histone H3 and H4 acetylation in nuclear lysates of preleukemic thymocytes from 3 independent 1-week-old wild-type, LckCre+;Hdac1Δ/Δ and LckCre+;Hdac1Δ/Δ;Hdac2+/Δ mice (left). Acetylated H3 and H4 signals were quantified over total H3 and H4 signal, respectively. While AcH3/H4 levels were significantly higher in LckCre+;Hdac1Δ/Δ and LckCre+;Hdac1Δ/Δ;Hdac2+/Δ thymocytes compared with wild-type thymocytes, only AcH3 levels were increased in LckCre+;Hdac1Δ/Δ;Hdac2+/Δ thymocytes compared with LckCre+;Hdac1Δ/Δ counterparts. (B) Venn diagram demonstrating the overlap between sets of differentially expressed genes (adjusted P value < 0.05, fold change ≥1.5×, n ≥3 independent mice per group) in 1-week-old and 3-week-old Hdac1Δ/Δ;Hdac2Δ/+ thymocytes and lymphomas. (C) Schematic representation of the overlap between CTGs identified in insertional mutagenesis screens and genes deregulated in Hdac1Δ/Δ;Hdac2Δ/+ thymocytes and lymphomas (“HDAC”; Fisher exact test, P = 6.36e-10). (D) Fold changes in mRNA of Myc-collaborating genes Jdp2, Jazf1, Dyrk3, Lpar2, 2010107G12RIK, and Ephb2 in 1-week-old and 3-week-old Hdac1Δ/Δ;Hdac2Δ/+ thymocytes and Hdac1Δ/Δ;Hdac2Δ/+ lymphomas, relative to age-matched wild-type thymi. (E) Western blot analysis of protein lysates of lymphomas of indicated genotypes for Hdac1, Jdp2 (lower band), and p53. Tubulin served as a loading control. (F) Western blot analysis (left) and chromatin immunoprecipitation analysis (right) of GFP, Hdac1-GFP, or Hdac2 GFP expressing p53−/− T-cell lymphoma cell lines for the Jdp2 intron 1-2 and 5′ UTR. (G) Cell viability assessed by cell titer blue assay (left) and representative images (right; magnification 100×) of Hdac1Δ/Δ;Hdac2Δ/+ and p53−/− lymphoma cell lines infected with independent lentiviral Jdp2 shRNA constructs (Jdp2_KD1 or Jdp2_KD2), a lentiviral nontargeting shRNA (NT) construct, or mock infection. WT, wild type.
Expression of Jdp2 is critical for survival of Hdac1Δ/Δ;Hdac2+/Δ tumors
Myc collaborating genes have been shown to synergize with c-Myc by inactivating the tumor-protective p53 pathway35 and Hdac1Δ/Δ;Hdac2+/Δ preleukemic thymocytes display reduced p53 protein levels upon γ-irradiation. Consequently, we searched for deregulated genes in Hdac1Δ/Δ;Hdac2+/Δ preleukemic thymocytes known to suppress p53 function. Indeed, several Myc collaborating genes were identified that have been implicated in suppression of p53 function. These included Jun dimerization partner 2 (Jdp2), Juxtaposed with another zinc finger protein 1 (Jazf1), Dual specificity tyrosine-phosphorylation-regulated kinase 3 (Dyrk3), LPA receptor 2 (Lpar2), a transcript with unknown function 2010107G12RIK, and Ephrin type-B receptor 2 (Ephb2)36-38 (Figure 6D). The Jdp2 gene specifically drew our interest as Jdp2 is targeted in insertional mutagenesis screens with high frequency in Myc overexpressing lymphomas.28,29 In addition, Jdp2 was preferentially activated by insertional mutagens in murine p53+/− lymphomas that retained the p53 wild-type allele and was shown to suppress p53 expression.37 Indeed, we observed an Hdac1/2 dosage-dependent derepression of Jdp2 in Hdac1Δ/Δ and Hdac1Δ/Δ;Hdac2+/Δ preleukemic thymocytes, which increased further during lymphomagenesis. Moreover, Jdp2 levels inversely correlated with the presence of stabilizing p53 mutations (supplemental Figure 6A and Figure 6D,E). These data suggest that Hdac1/2 levels directly regulate Jdp2 that subsequently, in a dosage-dependent manner, represses p53. Indeed, chromatin immunoprecipitation experiments using T-cell lymphoma cell lines expressing GFP-tagged versions of Hdac1 and Hdac2 revealed a direct binding of Hdac1 and Hdac2 to a Jdp2 intron 1-2 promoter region in contrast to a more 5′ UTR region of the Jdp2 locus (Figure 6F). Moreover, downregulation of Jdp2 using 2 independent Jdp2 shRNAs resulted in rapid cell death of Hdac1Δ/Δ;Hdac2+/Δ lymphoma cells but did not affect the survival of a p53−/− lymphoma cell line (Figure 6G and supplemental Figure 6B), suggesting that Jdp2 is critical for the survival of lymphoma cells in a p53-dependent manner. Collectively, the data presented here demonstrate that Hdac1 and Hdac2 function in a dosage-dependent manner as a p53-dependent barrier to prevent oncogenic transformation of Myc overexpressing thymocytes through transcriptional regulation of p53 suppressors like Jdp2.
Discussion
In summary, using a unique mouse model displaying a gradient of Hdac1 and Hdac2 governed HDAC activity, we provide genetic evidence for a previously unknown dosage-dependent tumor suppressor function for Hdac1 and Hdac2.
In contrast to HDAC-activity–independent chromosome 15 trisomy associated c-Myc upregulation, we observed HDAC-activity–dependent histone 3H hyperacetylation and associated gene deregulation in preleukemic thymocytes. The significant enrichment of Myc-collaborating genes (MCGs) among the deregulated genes attest to the importance of Hdac1 and Hdac2 as critical regulators of genes that determine cellular fate upon oncogenic insults such as Myc overexpression. MCGs have been shown to synergize with c-Myc in tumorigenesis by inactivating the tumor-protective p19Arf-Mdm2-p53 pathway.35 Indeed, preleukemic thymocytes harboring relatively low HDAC activity (Hdac1Δ/Δ;Hdac2+/Δ) displayed a dysfunctional p53 response and showed no inactivating mutations in p53. Consistently, several deregulated MCGs in preleukemic Hdac1Δ/Δ;Hdac2+/Δ thymocytes were shown to suppress p53 function. Although the pleiotropic effect caused by loss of HDAC activity suggests that multiple MCGs contributed to lymphomagenesis, Jun dimerization partner 2 (Jdp2, also known as Jundm2) seemed to play a critical role. Jdp2 was upregulated in an HDAC-activity–dependent manner in primary thymocytes as well as lymphomas and Jdp2 levels inversely correlated with p53 mutations (Figure 6E). A rationale for the latter observation is provided by the known p53 suppressing activity of Jdp2,37 which alleviates the need to inactivate p53 upon an oncogenic insult and may also explain why activating retroviral insertions in Jdp2 strongly accelerated Myc-driven lymphomagenesis.28,39 This explanation is further supported by observations that p53+/− tumors harboring Jdp2-activating transposon insertions retained wild-type p53.37 Finally, ablation of Jdp2 in Hdac1Δ/Δ;Hdac2+/Δ lymphoma cells resulted in rapid cell death while p53−/− lymphoma cells remained unaffected, attesting to the p53-dependent role of Jdp2 in maintenance of tumor cells harboring wild-type p53.
We identified deregulated expression of other MCGs regulating p53 function next to Jdp2 Dyrk3 was shown to impair p53 activity through phosphorylation of Sirt1.36 In addition, Lpar2 was shown to collaborate with c-Myc oncogenic transformation and allowed bypass of p53-induced senescence in the presence of wild-type p53, suggesting a role for Lpar2 in regulating the p53 fail-safe function.38,40 Although we cannot exclude that these Hdac1/2–regulated genes also contributed to lymphomagenesis, the fact that these MCGs do not regulate p53 transcription suggests that Jdp2 is a crucial contributor to the tumor phenotype. Together these results indicate a role for Hdac1- and Hdac2-governed HDAC activity in preventing “transcriptional instability.” Gradual loss of HDAC activity will result in a gradual increas in transcriptional instability, providing the cell with a repertoire of misexpressed proteins. Upon encountering an oncogenic insult, such as c-Myc overexpression, selection from the misexpressed protein repertoire for the most advantageous combination, including proteins inactivating p53 function, will generate a volatile situation that facilitates tumorigenesis (supplemental Figure 6C).
Previously, we showed that loss of Hdac1 and Hdac2 in mouse embryonic fibroblasts resulted in a senescence-like growth arrest independent of p16Inka/p19Arf and p53, suggesting that other pathways are involved in mediating the loss of Hdac1 and Hdac2.5 Although the mechanism underlying the developmental block during T-cell differentiation in DKO mice remains elusive, it is tempting to speculate that similar pathways are activated upon loss of Hdac1 and Hdac2 in thymocytes. Identification of these pathways may also provide insights into the early thymocyte block in DKO mice.
Our findings provide a cautionary note on the use of HDACi in the clinic as these agents may enable therapy-induced tumorigenesis. Although constitutive genetic inactivation of HDACs is different from temporal, chemical inactivation of HDAC activity using HDACi, the progression of Hdac1+/Δ;Hdac2+/Δ thymocytes into a full-blown lymphoma suggests that prolonged subtle changes in HDAC activity may generate a tumor-prone condition that can result in lymphomagenesis. Prolonged treatment of patients with HDACi may recapitulate the partial HDAC-activity reduction as observed in LckCre;Hdac1Δ/Δ mice and LckCre;Hdac1+/Δ;Hdac2Δ/Δ mice. Most notably, somatic mutations in HDAC1 were identified in 8.3% of dedifferentiated liposarcoma, providing support for a tumor-suppressive function of HDAC1 in humans.41 Moreover, several studies have shown that inactivation of epigenetic regulators may result in adverse effects such as tumorigenesis. Genetic inactivation of the epigenetic regulators DNA methyltransferase 1 (Dnmt1), histone deacetylase 3 (Hdac3), and Sirtuin 2 (Sirt2) resulted in tumor formation in mouse models.31,42,43 Moreover, cancer genome sequencing projects have revealed recurrent mutations in methyltransferase EZH244 and DNA methyl transferase DNMT3A,45 underscoring the potential adverse effects of small molecule inhibitors on these enzymes in the treatment of (cancer) patients.
Although genetic alterations affecting HDAC1 and/or HDAC2 in human T-cell acute lymphoblastic lymphomas (T-ALL) have not been identified, full genome sequencing identified mutations affecting known HDAC1 and HDAC2 interactors, such as BCL11B46 and RUNX1.22,47 The identification of HDAC1- and HDAC2-negative tumor specimen in various other tumor types48,49 encourages the analysis of T-cell lymphomas for HDAC1 or HDAC2 expression.
Despite the concerns raised by our studies regarding HDACi treatment, they simultaneously revealed that reduced HDAC activity generates a cancer cell vulnerability. Since critical HDAC activity levels are required to sustain tumor cells, one can envision increased HDACi sensitivity of tumors displaying reduced HDAC activity. Less remaining HDAC activity needs to be inactivated to reach the HDAC-activity threshold that is critical for viability. Indeed, our data showed an increased responsiveness of tumors displaying relatively low HDAC activity toward pharmacological inhibition of HDACs. Therefore, identification of tumors with low HDAC levels, as has been observed in some tumor types,48,49 in contrast to high HDAC expression, may be used as a biomarker to predict HDACi responsiveness and to stratify cancer patient populations.
The online version of this article contains a data supplement.
There is an Inside Blood commentary on this article in this issue.
The publication costs of this article were defrayed in part by page charge payment. Therefore, and solely to indicate this fact, this article is hereby marked “advertisement” in accordance with 18 USC section 1734.
Acknowledgments
The authors are grateful to Dr F. Gounari for providing the Jβ2 probe, Dr A. Aronheim for providing the Jdp2 antibody and Dr A. Peters for providing the pMR150 plasmid. The authors thank Ton Schrauwers, Corine van Langen, Auke Zwerver, Cor Spaan, and Dienke Jonkers for excellent animal care; Shan Baban and Marja Nieuwland for help with gene expression profiling; Wim Brugman for CGH analysis; Ernst-Jan Geutjes for help with cell toxicity assays; Tibor van Welsem and Fred van Leeuwen for histone H4 antibodies; Hilda de Vries for p53 reagents; and Roelof Pruntel for assistance with p53 sequencing. The authors are grateful to Renate de Groot and Annegien Broeks for generating the tissue micro-array and to Martin van der Valk for histology review. The authors thank Drs Reuven Agami, Anton Berns, Fred van Leeuwen, and Bas van Steensel for critical reading of this manuscript and suggestions.
This work was supported by grants from the Nederlandse organisatie voor Wetenschappenlijk Onderzoek (NWO) to J.-H.D. (NWO-VIDI 864.07.008) and H.J. (NWO-VIDI 917.56.328) and the Dutch Cancer Society to J.-H.D. (KWF-2007-3978).
Authorship
Contribution: M.R.H., R.H.W., H.J., R.M.K., L.F.W., and J.-H.D. designed and planned experiments. M.R.H., R.H.W., E.Y., A.V., J.d.J., and J.-H.D. performed experiments and analyzed data. M.R.H. and J.-H.D. wrote the manuscript.
Conflict-of-interest disclosure: The authors declare no competing financial interests.
Correspondence: Jan-Hermen Dannenberg, Division of Gene Regulation, Netherlands Cancer Institute, Plesmanlaan 121, 1066 CX, Amsterdam, The Netherlands; e-mail: j.dannenberg@nki.nl.

