Abstract
While the emergence of WT1-specific cytotoxic T lymphocytes (WT1-CTL) has been correlated with better relapse-free survival after allogeneic stem cell transplantation in patients with myeloid leukemias, little is known about the role of these cells in multiple myeloma (MM). We examined the significance of WT1-CTL responses in patients with relapsed MM and high-risk cytogenetics who were undergoing allogeneic T cell–depleted hematopoietic stem cell transplantation (alloTCD-HSCT) followed by donor lymphocyte infusions. Of 24 patients evaluated, all exhibited WT1-CTL responses before allogeneic transplantation. These T-cell frequencies were universally correlated with pretransplantation disease load. Ten patients received low-dose donor lymphocyte infusions beginning 5 months after transplantation. All patients subsequently developed increments of WT1-CTL frequencies that were associated with reduction in specific myeloma markers, in the absence of graft-versus-host disease. Immunohistochemical analyses of WT1 and CD138 in bone marrow specimens demonstrated consistent coexpression within malignant plasma cells. WT1 expression in the bone marrow correlated with disease outcome. Our results suggest an association between the emergence of WT1-CTL and graft-versus-myeloma effect in patients treated for relapsed MM after alloTCD-HSCT and donor lymphocyte infusions, supporting the development of adoptive immunotherapeutic approaches using WT1-CTL in the treatment of MM (registered at http://clinicaltrials.gov, ID: NCT01131169).
Key Points
WT1 expression by malignant plasma cells correlates with outcome in multiple myeloma.
WT1-specific CTL elicit a graft-versus-myeloma effect after allogeneic T cell–depleted stem cell transplantation and donor lymphocyte infusions.
Introduction
The emergence of tumor-specific T cells targeting the Wilms' tumor 1 (WT1) protein correlates with better relapse-free survival in patients with hematologic malignancies after allogeneic stem cell transplantation (alloSCT).1,2 Still, little is known about the capacity of WT1 to induce the development of spontaneous T-cell responses in multiple myeloma (MM).3 We hypothesized that a population of WT1-specifc effector cells may mediate a graft-versus-myeloma (GVM) effect in MM patients after alloSCT.
The WT1 gene was originally identified in the childhood renal neoplasm, Wilms' tumor.4 The nonmutated form of WT1 was initially categorized as a tumor-suppressor gene, with roles in the transcriptional regulation of early growth factor gene promoters.4,5 More recently, WT1 has been described as an oncogene. WT1 is overexpressed in various hematologic malignancies, including up to 70% of patients with acute myeloid leukemia (AML), acute lymphoblastic leukemia, chronic myeloid leukemia, and myelodysplastic syndrome.6 A high level of WT1 expression by leukemic blasts in AML is associated with poor response to chemotherapy, greater risk of relapse, and reduced probability of extended disease-free survival. For these reasons, WT1 expression serves as a prognostic marker, with several research groups using quantitative PCR methods to monitor disease response and minimal residual disease.7
Only limited data are available regarding WT1 expression in MM.8-10 One study correlated bone marrow (BM) expression of WT1 with numerous prognostic factors including disease stage and M protein ratio.8 MM cells are highly susceptible to perforin-mediated cytotoxicity by WT1-specific cytotoxic T lymphocytes (WT1-CTL), and WT1 expression is sufficient to induce interferon-γ (IFN-γ) production by CTL.9 Isolated minimal clinical responses have been reported with WT1 peptide-based immunotherapy, which correlated with the expansion of functional WT1-CTL and their migration to the BM.10
In this study, we examined the clinical significance of WT1-CTL in patients with relapsed MM and high-risk cytogenetics undergoing allogeneic T cell–depleted hematopoietic stem cell transplantation (alloTCD-HSCT). These patients received dose-escalating donor lymphocyte infusions (DLI) after transplantation. We report that WT1-CTL responses were detected in the peripheral blood (PB) of all 24 MM patients examined before allotransplantation. We further observed increments in PB WT1-CTL frequencies in all 10 patients serially monitored after alloTCD-HSCT and DLI. The emergence of WT1-CTL after DLI was associated with reduction or stabilization of specific myeloma markers. Clinically relevant disease responses were observed in the 8 patients who developed marked WT1-CTL responses. In addition, the coexpression of WT1 and CD138 was demonstrated by immunohistochemistry (IHC) in BM specimens from all MM patients tested, and WT1 expression appeared to correlate with disease course in those 10 patients monitored longitudinally.
Methods
Patients
After obtaining written informed consent, we collected PB and BM samples from MM patients pre- and post-alloTCD-HSCT. Patients with high-risk cytogenetics presenting with refractory or relapsed disease who had previously undergone autologous transplantation for MM were eligible for this study. After cytoreduction therapy with busulfan, melphalan, fludarabine, and antithymocyte globulin preparative therapy, patients received alloTCD-HSCT from HLA-compatible donors. Patients did not receive immunosuppressive therapy posttransplantation. DLI were administered at 5 × 10⁵ CD3+/kg for the first and second infusions, with subsequent doses administered at 1 × 10⁶ CD3+/kg.
Response criteria
Responses to alloTCD-HSCT and DLI were assessed according to criteria of the European Group for Blood and Marrow Transplantation (EBMT).11
WT1 peptides
Overlapping pentadecapeptides (15 mer) spanning the entire WT1 protein were purchased from Research Genetics. Peptides were manufactured to specifications of validity of sequence, 95% purity and sterility. A total pool of 141 synthetic pentadecapeptides, each overlapping the next by 11 amino acids and spanning the entire 576 amino acid sequence of the WT1 protein, was prepared and stored. To identify peptides eliciting T-cell responses, subpools containing 11-12 pentadecapeptides were established to form a mapping matrix in which each peptide is included in only 2 overlapping subpools (see Figure 4C).
Quantitation of functional WT1-CTL and analysis of epitope recognition by intracellular IFN-γ production
The proportion and phenotype (CD8/CD4) of T cells producing IFN-γ in response to secondary stimulation with the WT1 total pool or WT1 subpools loaded onto autologous PBMC were measured by FACS analysis, as previously described.12,13 Epitope mapping was performed by quantifying T-cell responses to each subpool. The mapping grid (see Figure 4C) was used to identify the immunodominant epitopes of WT1 eliciting IFN-γ responses.14
Determination and characterization of WT1 peptide-specific frequencies by MHC-tetramer analyses
WT1-CTL frequencies were quantified and phenotyped in patients expressing the HLA alleles A*0201 and A*0301 by staining with the appropriate A*0201/RMFPNAPYL and A*0301/RMFPNAPYL MHC tetramers, as previously described.13,15,16 PBMC and bone marrow mononuclear cells (BMMC) were stained with anti–CD3-PE-Cy7, anti-CD8–PerCP, anti–CD45RA-allophycocyanin, anti–D62L-FITC (all BD Pharmingen), and PE-labeled tetrameric complex (Memorial Sloan-Kettering Cancer Center [MSKCC] tetramer core facility) for 20 minutes at 4°C. Appropriate control stains with HLA-mismatched CMV tetramers were also performed.
Correlating WT1-CTL frequencies with disease status
The ability of WT1-CTL to mediate in vivo antimyeloma cytotoxicity was measured indirectly by correlating T-cell emergence with myeloma markers. Absolute numbers of WT1-CTL/μL PB were calculated by multiplying the percentage of IFN-γ–producing or tetramer-positive (tet+) WT1-CTL by the absolute numbers of CD8+ or CD4+ cells, derived from the absolute lymphocyte count (ALC). Levels of standard individual myeloma-specific markers in the PB, such as M-spike or IgA, were monitored and used to determine disease response or progression.
Flow cytometric analyses
Data acquisition was performed with a LSR-II flow cytometer (BD Biosciences). Data analyses were performed using FlowJo software (TreeStar).
Immunohistochemistry
For morphologic in situ expression analysis of CD138 and WT1, a sequential double-staining technique was used. Formalin-fixed paraffin-embedded samples of BM biopsies were obtained from the archives of the Department of Pathology at MSKCC. IHC was performed as described previously.17 Briefly, slides were subjected to a heat-based antigen retrieval procedure (30 minutes, 98°C) followed by the application of the first primary antibody (CD138, MI-15; DAKO) overnight at 4°C. A biotinylated horse-anti-mouse secondary antibody (1:200; Vector Laboratories) was used to detect the primary antibody, followed by an avidin-biotin-complex system with peroxidase as a reporter enzyme (elite ABC kit; Vector Laboratories); 3,3-diaminobenzidine tetrahydrochloride (liquid DAB; Biogenex) served as chromogen for the visualization of CD138 expression. A second round of antigen retrieval was performed, followed by an avidin-biotin blocking step (avidin/biotin blocking kit; Vector Laboratories) to prevent cross-reactivity between the 2 detection steps. The primary monoclonal antibody to WT1 (6F-H2; DAKO) was then applied for 1 hour at 20°C, followed by the biotinylated horse anti–mouse secondary. As tertiary reagent, an alkaline-phosphatase–linked streptavidin (Boehringer Mannheim) was used. A new fuchsin-based chromogen (Permanent Red; DAKO) was used for the visualization of WT1. Morphologic evaluation of antigen coexpression was based on the membranous expression pattern of CD138 and the cytoplasmic presence of WT1 in myeloma cells. To control for appropriate double staining, each case was also subjected to a conventional staining protocol using anti-WT1 and anti-CD138 on separate slides. Appropriate negative controls omitting the primary reagent were included for each case. The extent of WT1 staining was estimated on the basis of CD138-positive tumor cells and graded as follows: focal, approximately < 5%; +, 5%-25%; ++, > 25%-50%; +++, > 50%-75%; and ++++, > 75%.
Results
Patients
Ten patients with high-risk and multiply relapsed MM were serially monitored after alloTCD-HSCT at MSKCC, after obtaining institutional ethical approval and informed consent per the Declaration of Helsinki. Patient characteristics are indicated in Table 1. All patients had high-risk cytogenetics and/or relapsed disease, and had previously received at least one autologous transplantation. Of the 10 patients, 7 were male and 3 female. The median age at transplantation was 48 years (range, 32-68). Six patients underwent transplantation from an HLA-matched sibling, 3 from a matched unrelated donor, and 1 from a mismatched unrelated donor. The conditioning regimen at the time of alloTCD-HSCT comprised busulfan, melphalan, fludarabine, and antithymocyte globulin. Calculated doses of donor-derived CD3+ cells were subsequently administered, generally beginning 5 months after transplantation, at doses of 5 × 10⁵ to 1 × 10⁶ CD3+/kg. The median time from transplantation to first DLI was 7 months (range 4-18). Four patients received chemotherapy before the administration of one or more DLI because of high disease load or disease progression (UPN5/6/8/10). Median follow-up after alloTCD-HSCT was 34.6 months (range, 23.3-58.8). All patients were alive at time points shown, with the exception of UPN6 who recently expired.
WT1-CTL frequencies increase post-alloTCD-HSCT and after DLI
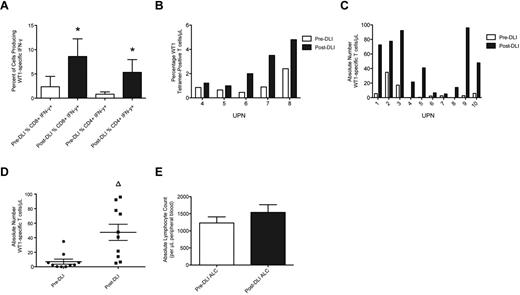
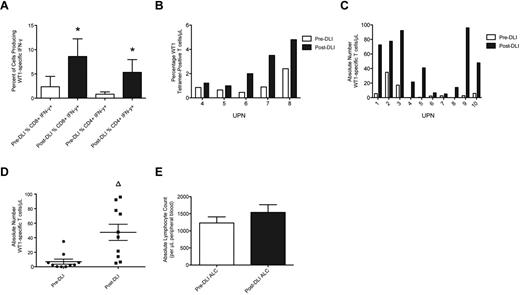
WT1-CTL frequencies were determined posttransplantation, before DLI administration, and at multiple time points post-DLI, by MHC-tetramer or IFN-γ analyses. Maximum responses to DLI were compared with pre-DLI T-cell frequencies. Significant increases in the percentages of both IFN-γ–producing and tet+ WT1-CTL were detected in all patients post-DLI (Figure 1A-B). These increases translated to increments in the absolute numbers of WT1-CTL in each patient, which did not appear dependent on the number of WT1-CTL present before infusion (Figure 1C). Overall, a highly significant 6.7-fold increase in the absolute number of WT1-CTL was observed in response to DLI (47 WT1-CTL/μL PB, compared with 7 pre-DLI, P = .0011 by the 2-tailed Mann-Whitney test; Figure 1D). The time to best response to DLI was measurable in 6 patients, at a median of 85.5 days (range, 28-194) post-DLI. The time to complete remission (CR) after first DLI was measurable in 2 patients, with intervals of 28 and 99 days recorded (UPN4 and UPN7, respectively). No significant increase in average ALC occurred post-DLI (Figure 1E). Therefore, the augmented frequencies of WT1-CTL observed post-DLI are not purely the consequence of an elevated ALC, but result from the specific expansion and increased effector functions of WT1-CTL.
WT1-CTL frequencies increase after DLI. Ten patients received 2 or more DLI after transplantation, after which WT1-CTL responses continued to be monitored. (A) Percentages of CD8 and CD4 T cells producing IFN-γ in response to WT1 peptides were determined after transplantation, before administration of DLI (pre-DLI; □), and at multiple time points after DLI, by intracellular IFN-γ analyses. ■ indicates the maximum IFN-γ response observed post-DLI. (B) Percentages of CD8-positive WT1-CTL were also quantified in pre-DLI samples and post-DLI by MHC-tetramer analyses in HLA-A*0201/0301–expressing patients, by staining with the HLA-A2/A3-RMF tetramers. (C) Absolute numbers of WT1-CTL present pre-DLI and post-DLI were quantified by multiplying the percentages of WT1-CTL determined by MHC-tetramer or IFN-γ analyses (presented in panels A and B), by each patient's ALC. (D) Comparing the absolute number of WT1-CTL pre- and post-DLI reveals a 6.6-fold increase in WT1-CTL. (E) Comparison of each patient's ALC recorded pre-DLI and post-DLI reveals no significant difference between the 2 time points. *P < .04 by Wilcoxon matched-pairs signed rank test. Δ P = .0011 by 2-tailed Mann-Whitney test.
WT1-CTL frequencies increase after DLI. Ten patients received 2 or more DLI after transplantation, after which WT1-CTL responses continued to be monitored. (A) Percentages of CD8 and CD4 T cells producing IFN-γ in response to WT1 peptides were determined after transplantation, before administration of DLI (pre-DLI; □), and at multiple time points after DLI, by intracellular IFN-γ analyses. ■ indicates the maximum IFN-γ response observed post-DLI. (B) Percentages of CD8-positive WT1-CTL were also quantified in pre-DLI samples and post-DLI by MHC-tetramer analyses in HLA-A*0201/0301–expressing patients, by staining with the HLA-A2/A3-RMF tetramers. (C) Absolute numbers of WT1-CTL present pre-DLI and post-DLI were quantified by multiplying the percentages of WT1-CTL determined by MHC-tetramer or IFN-γ analyses (presented in panels A and B), by each patient's ALC. (D) Comparing the absolute number of WT1-CTL pre- and post-DLI reveals a 6.6-fold increase in WT1-CTL. (E) Comparison of each patient's ALC recorded pre-DLI and post-DLI reveals no significant difference between the 2 time points. *P < .04 by Wilcoxon matched-pairs signed rank test. Δ P = .0011 by 2-tailed Mann-Whitney test.
The emergence of WT1-CTL after DLI coincides with disease regression
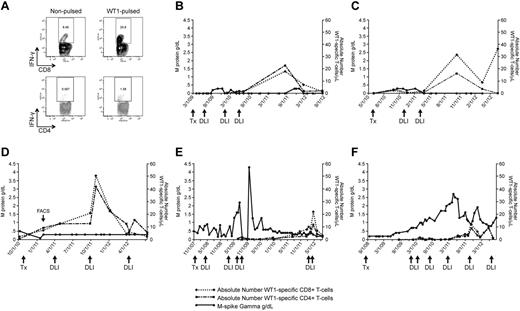
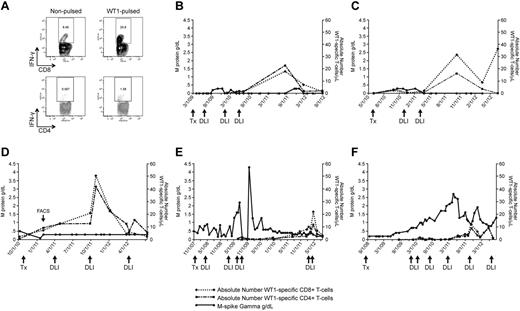
The clinical significance of the elevated WT1-CTL frequencies detected post-DLI was measured indirectly by correlating T-cell emergence with myeloma load. To monitor the kinetics of WT1-CTL responses and disease regression after alloTCD-HSCT, absolute numbers of WT1-CTL were compared with individual myeloma-specific disease markers. In the 6 representative patient plots shown, absolute numbers of CD8+ and CD4+ WT1-CTL were sequentially quantified by IFN-γ assay in freshly isolated PBMC (Figure 2) or by MHC-tetramer analysis (Figure 3).
WT1-CTL emergence is associated with disease reduction and stabilization. WT1-CTL frequencies in the PB generally increase after DLI and fluctuate over the course of disease. WT1-CTL frequencies were quantified by intracellular IFN-γ assay in freshly isolated PBMCs. Absolute numbers of WT1-CTL were then computed and compared with the clinical marker of disease, M-spike gamma. (A) Representative FACS plots of intracellular IFN-γ production by CD8+ and CD4+ T cells against autologous nonpulsed and WT1 peptide-pulsed target PBMC (UPN1, time point indicated by “FACS” arrow in panel D). (B) UPN9; (C) UPN4; (D) UPN1; (E) UPN8; (F) UPN10.
WT1-CTL emergence is associated with disease reduction and stabilization. WT1-CTL frequencies in the PB generally increase after DLI and fluctuate over the course of disease. WT1-CTL frequencies were quantified by intracellular IFN-γ assay in freshly isolated PBMCs. Absolute numbers of WT1-CTL were then computed and compared with the clinical marker of disease, M-spike gamma. (A) Representative FACS plots of intracellular IFN-γ production by CD8+ and CD4+ T cells against autologous nonpulsed and WT1 peptide-pulsed target PBMC (UPN1, time point indicated by “FACS” arrow in panel D). (B) UPN9; (C) UPN4; (D) UPN1; (E) UPN8; (F) UPN10.
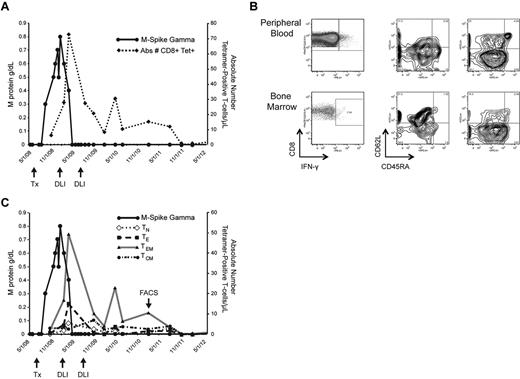
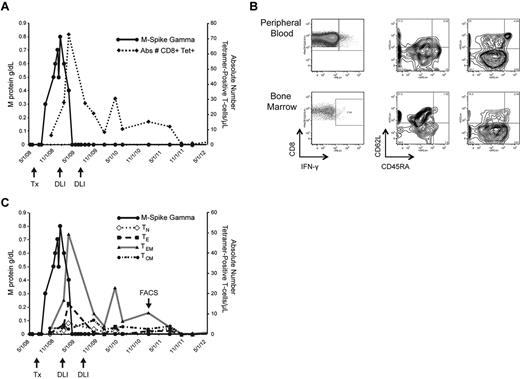
Kinetics and characterization of WT1-CTL. Monitoring the emergence of WT1-CTL post-DLI in UPN7. (A) Absolute number of WT1-CTL determined by HLA-A*0201/RMF MHC-tetramer staining. (B) Frequency and phenotypes of PB and BM-resident WT1-CTL in UPN7 from time point indicated by “FACS” arrow in panel C. Effector memory T cells dominate the PB, whereas BM-resident T cells are predominantly central memory in phenotype. (C) Longitudinal phenotypic analysis of WT1-CTL over the course of the disease in UPN7. TN indicates naive T cells; TE, effector T cells; TEM, effector memory T cells; and TCM, central memory T cells.
Kinetics and characterization of WT1-CTL. Monitoring the emergence of WT1-CTL post-DLI in UPN7. (A) Absolute number of WT1-CTL determined by HLA-A*0201/RMF MHC-tetramer staining. (B) Frequency and phenotypes of PB and BM-resident WT1-CTL in UPN7 from time point indicated by “FACS” arrow in panel C. Effector memory T cells dominate the PB, whereas BM-resident T cells are predominantly central memory in phenotype. (C) Longitudinal phenotypic analysis of WT1-CTL over the course of the disease in UPN7. TN indicates naive T cells; TE, effector T cells; TEM, effector memory T cells; and TCM, central memory T cells.
The elevated WT1-CTL frequencies that occurred post-DLI were associated with reductions or stabilization of myeloma disease load of varying durations in all patients. Representative FACS plots showing T cells generating intracellular IFN-γ in response to WT1 peptides are shown in Figure 2A (data derived from UPN1, at time point indicated by “FACS” arrow in Figure 2D). In UPN9 (Figure 2B), the increase in WT1-CTL frequencies observed after the third DLI coincided with the achievement of durable CR, with WT1-CTL persisting long after DLI. UPN4 (Figure 2C) also achieved a durable CR approximately 4 weeks after receiving her second DLI. UPN1 (Figure 2D) has maintained a very good partial response (VGPR) and progression-free disease status for more than 2 years despite an otherwise very aggressive myeloma, with WT1-CTL frequencies transiently increasing after each of 2 DLI and persisting to date. In contrast, in UPN8 and UPN10, more limited clinical responses were achieved despite multiple DLI (Figure 2E-F, respectively). We began monitoring WT1-CTL frequencies in UPN8 shortly before the administration of the third DLI. At this time, the patient received therapy with lenalidomide/dexamethasone to control rapidly progressive disease. Delayed expansion of WT1-CTL was observed, with the peak T-cell response coinciding with the achievement of VGPR. This patient is now more than 5 years out from transplantation, remaining in stable VGPR. A WT1-CTL response was also not detected in UPN10 until therapy with lenalidomide/bortezomib was administered before his fourth DLI. This T-cell response coincided with a short-lived partial response (PR). Full donor chimerism was observed in each of these patients at the time of the peak WT1-CTL response. Patients who failed to develop or maintain detectable WT1-CTL responses exhibited progressive disease courses (UPN5 and UPN6; Table 1-2). Interestingly, preliminary analyses revealed that these patients possessed the greatest frequencies of Tregs in the PB, and particularly the BM, compared with patients in CR/VGPR (data not shown).
There was no clear correlation between the absolute number of WT1-CTL present after DLI and the degree of disease response observed. For example, UPN6 achieved only a PR despite reaching a peak of 94.94 WT1-CTL/μL PB. In contrast, UPN2 and UPN3 both achieved CR although only low frequencies of 6.66 and 5.05 WT1-CTL/μL, respectively, were observed (Table 2). Moreover, the emergence of WT1-CTL was consistently associated with disease regression or stabilization.
Characterization of WT1-CTL responses
T-cell kinetics were also monitored in patients by longitudinal tetramer analyses, when appropriate MHC-tetramer complexes were available. In UPN7, CD8+ WT1-CTL were quantified by staining with the HLA-A*0201/RMF tetramer. The peak T-cell response of 72.5 WT1-CTL/μL PB occurred 70 days after administration of the first therapeutic DLI, and coincided with disease regression to CR. This patient received a second consolidative DLI and has remained in CR for more than 3 years, with fluctuating levels of CD8+ WT1-CTL persisting (Figure 3A). Findings from molecular chimerism studies conducted on isolated T cells 4 weeks post-alloTCD-HSCT indicate that the WT1-CTL are of donor origin. Phenotypic analysis of tet+ WT1-CTL was conducted by costaining for the surface markers CD45RA and CD62L. Representative FACS plots compare PB and BM-derived T cells isolated from UPN7 ∼ 3 years posttransplantation (Figure 3B; time point indicated by “FACS” arrow in Figure 3C). In the PB, effector memory (TEM; CD45RA− CD62L−) WT1-CTL showed the greatest prevalence, with a small fraction of central memory (TCM; CD45RA− CD62L+) cells also persisting (Figure 3B-C). In contrast, the majority of tet+ cells in the BM were TCM.
Phenotypic analyses of the tetramer-negative fraction of BMMC revealed this phenomenon is not observed because of generalized homing of TCM to the marrow because TEM dominate the tetramer-negative population (Figure 3B). Expansion of memory tet+ WT1-CTL was observed in all patients after allo-TCD-HSCT and DLI, with naive and effector WT1-CTL showing greater presence pretransplantation (supplemental Figure 1, available on the Blood Web site; see the Supplemental Materials link at the top of the online article). It is likely that the development of a predominantly memory response favors optimal antimyeloma activity.
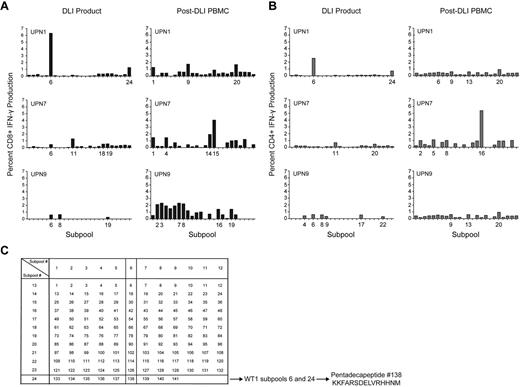
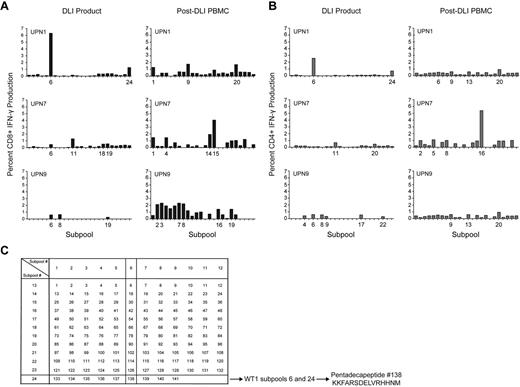
The diversity of the WT1-CTL response was further examined in 3 selected patients from whom DLI products were also available for analyses. The DLI products demonstrated only limited responses against subpools of overlapping WT1 pentadecapeptides, while enhanced diversity of CD8+ and CD4+ subpool responses, greater magnitude of IFN-γ responsiveness, and the existence of more, distinct, immunodominant epitopes were detected in patients post-DLI. These findings are suggestive of epitope spreading after DLI (Figure 4).
WT1 epitope spreading occurs after DLI. Immunogenic epitopes were identified in 3 healthy donor lymphocyte products and in the 3 patients who received those DLI, at varying time points after T-cell infusion. Epitopes inducing IFN-γ responses were mapped using the grid shown, whereby subpools inducing dominant responses intersect to reveal the single common peptide containing the immunodominant epitope. (A) CD8+ T-cell production of IFN-γ in response to WT1 peptide subpools, in DLI products for, and PBMC isolated from UPN1, UPN7, and UPN9 post-DLI. (B) CD4+ T-cell production of IFN-γ in response to WT1 peptide subpools, in DLI products for, and PBMC isolated from UPN1, UPN7, and UPN9 post-DLI. (C) Epitope mapping grid outlining subpool peptide compositions. The mapping grid consisting of 24 subpools each containing up to 12 WT1-derived pentadecapeptides. Each peptide is uniquely contained within 2 intersecting subpools. For example, subpools 6 and 24, to which CD8+ and CD4+ T cells from the DLI product for UPN1 both react, uniquely share peptide 138.
WT1 epitope spreading occurs after DLI. Immunogenic epitopes were identified in 3 healthy donor lymphocyte products and in the 3 patients who received those DLI, at varying time points after T-cell infusion. Epitopes inducing IFN-γ responses were mapped using the grid shown, whereby subpools inducing dominant responses intersect to reveal the single common peptide containing the immunodominant epitope. (A) CD8+ T-cell production of IFN-γ in response to WT1 peptide subpools, in DLI products for, and PBMC isolated from UPN1, UPN7, and UPN9 post-DLI. (B) CD4+ T-cell production of IFN-γ in response to WT1 peptide subpools, in DLI products for, and PBMC isolated from UPN1, UPN7, and UPN9 post-DLI. (C) Epitope mapping grid outlining subpool peptide compositions. The mapping grid consisting of 24 subpools each containing up to 12 WT1-derived pentadecapeptides. Each peptide is uniquely contained within 2 intersecting subpools. For example, subpools 6 and 24, to which CD8+ and CD4+ T cells from the DLI product for UPN1 both react, uniquely share peptide 138.
WT1 is expressed in malignant plasma cells in the BM of MM patients
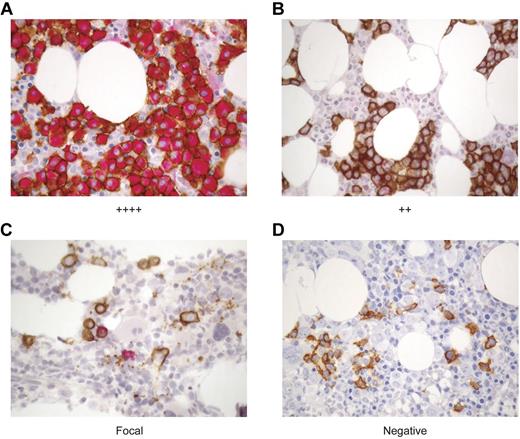
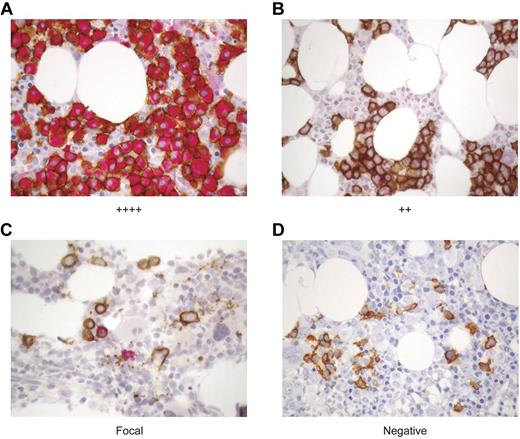
Because WT1-CTL were detected in all patients tested, and their emergence correlated with myeloma disease responses, we proceeded to examine the degree to which WT1 was expressed in these patients' myeloma cells, and whether clinical responses correlated with depletion of WT1-positive plasma cells (PC). To this end, a dual staining protocol was established to examine the expression of WT1 (clone 6F-H2; red) in neoplastic CD138-positive PC (clone MI15; brown) by IHC. WT1 was present in CD138-positive myeloma cells in all 15 patients tested. Representative IHC stains of archival paraffin-embedded BM specimens from patients with varying degrees of WT1 expression are shown in Figure 5.
WT1 is expressed in CD138+ plasma cells in the BM of MM patients. The expression of WT1 in MM cells was longitudinally assessed over the course of disease in MM patients before and after alloTCD-HSCT and DLI. Paraffin-fixed BM biopsies from MM patients were double stained with monoclonal antibodies to CD138 (MI15; DAB, brown) and WT1 (6F-H2; nFu, red). Immunohistochemical analysis of WT1 expression was performed and biopsies were graded negative, focal, +, ++, +++, or ++++ based on the percentage of CD138+ PC staining positive for WT1. Representative biopsy stains are shown. (A) ++++ > 75% of CD138+ PC stain positive for WT1; UPN5. (B) ++ > 25%-30% of CD138+ cells are WT1+; UPN10. (C) Focal < 5% of CD138+ cells are WT1+; UPN10. (D) Negative, no CD138+ are positive for WT1; UPN10 (20×).
WT1 is expressed in CD138+ plasma cells in the BM of MM patients. The expression of WT1 in MM cells was longitudinally assessed over the course of disease in MM patients before and after alloTCD-HSCT and DLI. Paraffin-fixed BM biopsies from MM patients were double stained with monoclonal antibodies to CD138 (MI15; DAB, brown) and WT1 (6F-H2; nFu, red). Immunohistochemical analysis of WT1 expression was performed and biopsies were graded negative, focal, +, ++, +++, or ++++ based on the percentage of CD138+ PC staining positive for WT1. Representative biopsy stains are shown. (A) ++++ > 75% of CD138+ PC stain positive for WT1; UPN5. (B) ++ > 25%-30% of CD138+ cells are WT1+; UPN10. (C) Focal < 5% of CD138+ cells are WT1+; UPN10. (D) Negative, no CD138+ are positive for WT1; UPN10 (20×).
WT1 expression in the BM was monitored longitudinally in the 10 patients listed in Table 1. Pretransplantation biopsy specimens were available from 9 of these patients, with WT1 expression detected in 8 of 9 patients. Longitudinal analyses revealed an association between WT1 expression and disease persistence and progression. Of the 5 patients who achieved CR in response to DLI (UPN2/3/4/7/9), the maximum WT1 expression level detected in the BM before or after transplantation and DLI was graded “+,” with 4 of 5 patients showing WT1 presence in only a minor fraction (< 5%) of CD138+ cells. Three of these patients have maintained durable CR. Two patients with low levels of WT1 expression (IHC grades focal to +) achieved stable VGPR (UPN1/8). In contrast, only a PR was achieved after multiple DLI were administered in combination with chemotherapy to a patient in whom WT1 was expressed in 25%-50% (++) of the CD138+ cells (UPN10). Disease progression was ultimately observed in 2 patients with expression of WT1 in > 75% of PC (++++), despite short-lived partial responses to multiple DLI administered after lenalidomide/bortezomib/dexamethasone therapy (UPN5/6; Tables 1–2). WT1 expression diminished in 4 of 8 evaluable patients after transplantation and DLI. As WT1 expression declined, disease levels declined also. In the remaining 4 of 8 evaluable patients, WT1 expression levels remained unchanged after transplantation and DLI (Table 2).
We further assessed whether there was a correlation between WT1-CTL frequencies and WT1 expression in the marrow after transplantation. Figure 5B through D describe sequential BM biopsies from UPN10. WT1 expression regressed from ++ to focal to negative over a period of 7 months. This coincided with both a reduction in PC infiltrating the marrow, and with an increase in circulating PB WT1-CTL frequencies (Figure 2F). Reductions in BM WT1 expression (and disease load) also correlated with increasing WT1-CTL frequencies in UPN4/5/6/8.
WT1-CTL exist in MM patients pre-alloTCD-HSCT
We also examined the frequencies of WT1-CTL in 24 MM patients before alloTCD-HSCT. All patients had long-lasting disease and had undergone several courses of chemotherapy and autologous transplantation. Frequencies were examined in freshly isolated PB specimens from 20 patients by IFN-γ assay. MHC-tetramer analyses were performed in 4 patients where freshly isolated samples were not available. WT1-specific IFN-γ production was detected in all 20 patients tested pre-allotransplantation, with a significant 4.7-fold increase in the percentage of cells producing IFN-γ in response to WT1-pulsed PBMC, compared with nonpulsed control targets (Figure 6A-B). In contrast, significant WT1 reactivity was not detected in healthy donor T-cell products (Figure 6A). By calculating the absolute numbers of WT1-CTL, we determined a mean of 14.6 WT1-CTL/μL PB preallogeneic transplantation (range, 0.1-56.78 WT1-CTL/μL; Figure 6B).
WT1-CTL are detected in MM patients pretransplantation and are negatively associated with disease severity. Pretransplantation frequencies of WT1-CTL in the PB of MM patients were quantified by intracellular IFN-γ assay or MHC-tetramer analyses. (A) Percentage of CD3+ cells in healthy donors and MM patients producing IFN-γ in response to nonpulsed autologous PBMC, or PBMC pulsed with WT1 peptide pools. (B) Absolute numbers of CD3+ cells producing IFN-γ in response to nonpulsed or WT1 peptide pool–pulsed PBMC were quantified by multiplying the percentage of cells producing IFN-γ by the patient's absolute lymphocyte count. (C) Comparing disease severity in patients with greater or less than 10 WT1-CTL/μL of PB. Absolute numbers of WT1-CTL were determined by IFN-γ or MHC-tetramer analyses and compared with pretransplantation M-Spike gamma levels. *P ≤ .0003, 2-tailed Wilcoxon matched pairs signed rank test; Δ, P ≤ .0303, 2-tailed Mann-Whitney test.
WT1-CTL are detected in MM patients pretransplantation and are negatively associated with disease severity. Pretransplantation frequencies of WT1-CTL in the PB of MM patients were quantified by intracellular IFN-γ assay or MHC-tetramer analyses. (A) Percentage of CD3+ cells in healthy donors and MM patients producing IFN-γ in response to nonpulsed autologous PBMC, or PBMC pulsed with WT1 peptide pools. (B) Absolute numbers of CD3+ cells producing IFN-γ in response to nonpulsed or WT1 peptide pool–pulsed PBMC were quantified by multiplying the percentage of cells producing IFN-γ by the patient's absolute lymphocyte count. (C) Comparing disease severity in patients with greater or less than 10 WT1-CTL/μL of PB. Absolute numbers of WT1-CTL were determined by IFN-γ or MHC-tetramer analyses and compared with pretransplantation M-Spike gamma levels. *P ≤ .0003, 2-tailed Wilcoxon matched pairs signed rank test; Δ, P ≤ .0303, 2-tailed Mann-Whitney test.
We were interested to assess whether these WT1-CTL frequencies correlated with disease status pretransplantation. Pretransplantation T-cell frequencies from all 24 patients were compared with pretransplantation levels of M-spike Gamma. Interestingly, 75% of patients (9 of 12) with frequencies > 10 cells/μL of blood had no disease pretransplantation, compared with only 25% of patients (3 of 12) with < 10 cells/μL of blood (Figure 6C).
Discussion
Multiple myeloma is a plasma cell malignancy that accounts for approximately 20% of deaths from hematologic malignancies and 2% of deaths from all cancers.18 Currently available therapies provide a 5-year survival rate of ∼ 35%.19 MM patients with high-risk cytogenetics experience a particularly poor outcome with a median progression-free survival of only 6-11 months.20,21 AlloSCT constitutes a potentially curative therapy for a proportion of patients with MM. However, both conventional and nonmyeloablative allotransplantations are associated with high morbidity and mortality resulting from GVHD and infectious complications, and disease relapse rates remain high.22 Depletion of T cells from the graft before transplantation reduces the risks of GVHD and transplantation-related mortality, but carries a potentially greater risk of relapse from the abrogation of immunologic antimyeloma activity. On the other hand, alloTCD-HSCT, which does not require posttransplantation immunosuppressive therapy, provides a platform for immunotherapy with DLI or antigen-specific CTL infusions. In the posttransplantation setting, lymphopenia-induced homeostatic proliferation facilitates the expansion and activation of adoptively transferred T cells.23
An immune-mediated GVM effect has been demonstrated in several clinical studies that used DLI postallogeneic transplantation.24,25 Response rates of 30%-40% have been reported in myeloma patients who received DLI after disease relapse after allotransplantation.25-28 Data regarding the therapeutic value of prophylactic DLI are more limited.29-31 Two major limitations of DLI are high incidences of acute and chronic GVHD, and short response durations. In both the relapse and prophylactic settings, a strong association between GVHD and the GVM effect was observed, with GVHD reported as the major predictive factor for response to DLI.32-34 This led to the assumption that the targets for GVHD and GVM are identical, and that an allogeneic GVM effect could not be achieved in the absence of clinically significant GVHD.35 However, several lines of evidence dispute this. The occurrence of disease remissions in the absence of GVHD suggests that separate immunologic events are occurring in GVHD and GVM.26,36 In addition, longitudinal molecular analysis of the TCR Vβ repertoire in MM patients revealed the emergence of clearly distinguishable T-cell clones post-DLI that were temporally associated with GVM or GVHD.37 In our study, GVHD was not observed in any patient after the adoptive transfer of escalating low doses of donor-derived lymphocytes, demonstrating the selective induction of a GVM response.
The GVM effect observed in this study was associated with the emergence of WT1-CTL. Elevated WT1-CTL frequencies were observed in all 10 patients monitored serially after alloTCD-HSCT and DLI. This potentiation of WT1-CTL populations resulted from cell-specific expansion, rather than as a consequence of general immune reconstitution. The lymphopenic host environment in the early posttransplantation setting may have promoted the expansion of low numbers of WT1-CTL contained within the DLI product.7,38-40 No apparent correlation between the frequencies of WT1-specific T cells determined by intracellular IFN-γ and MHC-tetramer analyses was detected. This may be explained by differences inherent to the 2 approaches; whereas the intracellular IFN-γ production assay provides broad functional analyses of multiple epitope-specific T cells, MHC-tetramer analyses are limited to phenotypic detection of single epitope-restricted responses.
Some patients only developed WT1-CTL responses and concurrent disease responses when DLI were administered shortly after chemotherapy. In this setting, chemotherapy-induced apoptosis of myeloma cells likely caused release of the myeloma cells' antigenic contents, and cross-presentation of WT1 peptides to the adoptively transferred T cells. This expansion may have been promoted further by chemotherapy-mediated elimination of various suppressor cell subsets.
The capacity of WT1-CTL to mediate in vivo antimyeloma activity was indirectly assessed by correlating T-cell emergence in the PB with specific myeloma markers. While there was no clear correlation between the absolute number of WT1-CTL present after DLI and disease response, the emergence of WT1-CTL appeared to correlate with reduction of myeloma markers and achievement of CR. These results suggest that the minimum number of WT1-CTL required to induce a clinical response varies by patient. Such a “T-cell threshold” would likely depend on multiple factors, including but not limited to the extent of myeloma disease, the level of WT1 expression by myeloma cells, and the host immune environment.
The majority of tet+ WT1-CTL mediating disease regression post-DLI were TEM in the PB. These findings suggest an ongoing immunologic response, and are consistent with WT1-CTL responses observed in leukemia patients after allotransplantation.1 The immunodominant T cells detected in the PB post-DLI recognized distinct epitopes from those found in the concordant DLI products, suggesting that intramolecular epitope spreading may play a role in the GVM response. These findings corroborate previous reports of distinct patterns of WT1 epitope recognition by patients with hematologic malignancies and healthy donors.40,41 In contrast, the majority of WT1-CTL detected in the BM were TCM. The homing of TCM WT1-CTL to the BM in myeloma may reflect their concentration in sites of disease because such differences in PB and BM-derived CD8+ WT1-CTL subsets have not been observed in solid malignancies.38
The failure to develop or expand populations of WT1-CTL was characteristic of DLI nonresponders. Furthermore, the loss of WT1-CTL responses was associated with disease progression. Many factors may have contributed to the failure to develop or maintain WT1-CTL frequencies seen in certain of our patients. The DLI product may not have contained WT1-CTL or their precursors. Failure to develop WT1-CTL responses could also result if the WT1 peptides generated and presented from isoforms of WT1 expressed by MM cells differ from those recognized by T cells from healthy donors, or if the concentration of these peptides on presenting HLA alleles in patients is low. In addition, the myeloma cells themselves, as well as the host immune environment, may play immunomodulatory roles in preventing the outgrowth of self-antigen–specific T cells. Elevated levels of inhibitory cytokines including IL-6, TGF-β, and IL-1 have been reported in MM patients.42 Populations of dendritic cells, Treg, and myeloid-derived suppressor cells (MDSC), and/or their functions, may also be altered in MM patients, potentially limiting antitumor activity.43 Higher levels of functionally competent Treg could be responsible for the inability of some patients to respond to DLI, particularly in cases of progressive disease. Preliminary results from our laboratory show a general trend toward increasing PB and BM Treg frequencies with worsening disease status, concordant with recent findings that increased Treg frequencies in MM patients are associated with a reduced overall survival.44-46 More recently, Th17 cells have been shown to play an immunomodulatory role in the pathogenesis of MM, by promoting the outgrowth of MM cells while inhibiting immune function.47 The administration of chemotherapy may eliminate populations of immunosuppressive cells such as Treg, MDSC, and Th17 cells, while promoting the generation and cross-presentation of MM-derived WT1 peptides, and enhancing the sensitization of incoming donor lymphocytes against those WT1 peptides.
Longitudinal analysis of WT1 expression in the BM of MM patients revealed an apparent association between the extent of WT1-expressing myeloma cells and disease persistence and progression. Presence of WT1 protein in a high number of myeloma cells was associated with poor prognosis, while WT1 expression in fewer malignant cells was associated with a better outcome. A reduction in WT1 expression in the marrow and concurrent disease regressions were observed in 5 patients, along with increasing frequencies of WT1-CTL. WT1 expression in the BM has previously been correlated with numerous prognostic factors in MM, including disease stage and M protein ratio.8,48 Our data provide further evidence to support the use of WT1 protein expression levels in the BM as an additional marker for risk assessment in MM.8
This study further demonstrates the presence of WT1-CTL in MM patients pre-alloTCD-HSCT. Pretransplantation WT1-CTL frequencies were negatively associated with disease severity, suggesting an immunologic role in MM control in the pretransplantation setting. Thus, vaccination strategies to expand preexisting frequencies of WT1-CTL may offer therapeutic potential in this patient population.
The present study indicates that reduced-intensity conditioning with alloTCD-HSCT followed by dose escalation with DLI is a promising treatment strategy for patients with high-risk and multiply relapsed MM, and supports the development of adoptive immunotherapeutic approaches targeting WT1 in patients with MM. The adoptive transfer of donor-derived WT1-CTL in place of DLI may provide further dissociation of GVM from GVHD.
The online version of this article contains a data supplement.
The publication costs of this article were defrayed in part by page charge payment. Therefore, and solely to indicate this fact, this article is hereby marked “advertisement” in accordance with 18 USC section 1734.
Acknowledgments
The authors thank Lorna Barnett, Megan Holz, and Denise Frosina for their technical assistance, and Dr Aisha Hasan for her input and support.
This work was funded in part by the Cancer Research Institute Predoctoral Fellowship in Tumor Immunology (E.M.T.). G.K. is the recipient of a research grant from Otsuka Pharmaceuticals Inc.
Authorship
Contribution: E.M.T. processed samples, performed experiments, analyzed data, collected patient data, and wrote the manuscript; A.A.J. performed experiments, analyzed data, and commented on the manuscript; R.J.O. advised on study design and commented on the manuscript; and G.K. performed the study, provided clinical care, supervised experiments, data collection, and analyses, and wrote the manuscript.
Conflict-of-interest disclosure: The authors declare no competing financial interests.
Correspondence: Guenther Koehne, MD, PhD, Adult Allogeneic Bone Marrow Transplantation Service, Division of Hematologic Oncology, Department of Medicine, Memorial Sloan-Kettering Cancer Center, 1275 York Ave, New York, NY 10065; e-mail: koehneg@mskcc.org.

