Abstract
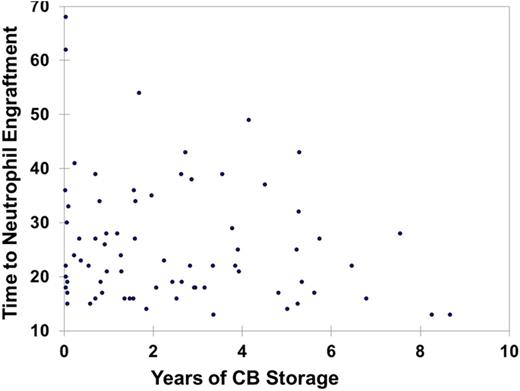
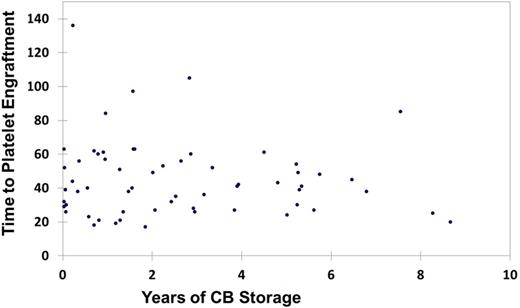
Little is known about the impact of storage duration of an umbilical cord blood unit (CBU) on its’ long term engraftment potency in a clinical setting. We hypothesized that the longevity of storage would not affect CBU engraftment kinetics, when stored under standard conditions. A total of 86 patients undergoing single CB transplants were identified and impact of CBU age was analyzed on transplant outcomes including engraftment and survival. Based on age of the CBU, 4 quartiles were identified: (Q1: Age < 0.7 years (median: 0.07; n=21); Q2: 0.71-1.96 years (median: 1.3 years; n=22); Q3: 1.97-3.87 years (median: 2.8 years; n=22) and Q4: 3.88-12.2 years (median: 5.3 years; n=21)) (Table 1). We also performed analysis on dichotomous distribution of Old CBU (age ≥ 5 years; n=15) vs. New CBU (age < 5 years; n=71). No significant differences in the baseline patient characteristics were seen in any of the subgroups (Table 2). Engraftment was comparable across all quartiles. When comparing quartile Q1, Q2, Q3, Q4, the distribution of outcomes was: median time to neutrophil engraftment: 24, 24, 21, 22 days and median time to platelet engraftment: 42, 54, 41, 42 days, respectively (Figure1 A, B). No differences were observed in the duration of hospitalization: median 43, 48, 43 and 44 days, respectively for the 4 quartiles. For the dichotomous comparison, median time to neutrophil engraftment was 19 vs. 22 days; median time to platelet engraftment was 41 vs. 44 days; and median duration of hospitalization was 41 vs. 46 days, respectively, for Old CBU vs. New CBU. Acute GVHD rates and overall survival rates were also similar. We conclude that old CBUs remain a viable source for stem cell transplant.
CB Characteristics
| . | QUARTILES . | Old vs. New CBU . | ||||||
|---|---|---|---|---|---|---|---|---|
| . | Q1 (n=21) . | Q2 (n=22) . | Q3 (n=22) . | Q4 (n=21) . | P value . | Old CBU (n=15) . | New CBU (n=71) . | P value . |
| Duration of Storage (yrs) (median, range) | 0.07 (0-0.7) | 1.3 (0.71-1.96) | 2.8 (1.97-3.87) | 5.3 (3.88-12.2) | 5.7 (5-12) | 1.5 (0.03-4.8) | <0.0001 | |
| Cryo_vol (ml) | 30 (25-170) | 32.6 (25-351) | 44.4 (11-300) | 37 (24-340) | 0.2 | 37 (24-205) | 34 (11-351) | 0.8 |
| TNC (x106) | 1200 (42.5-6192) | 1720 (220-3432) | 1539 (305.8-2979.2) | 1175 (360-2720) | 0.6 | 1107 (260-2331) | 1380 (42.5 – 6192) | 0.1 |
| TNC (x106)/Kg | 40.1 (2.36-564) | 37.7 (6.5-174.7) | 35.6 (4.5-146.4) | 45.2 (17.6-107) | 0.5 | 41.9 (17.6-107) | 40.2 (2.4-564) | 0.6 |
| CD34x106/kg | 0.14 (0-2.4) | 0.15 (0-1.1) | 0.08 (0-0.6) | 0.14 (0-1.1) | 0.7 | 0.16 (0.08-0.68) | 0.1 (0-2.4) | 0.9 |
| Processing | 19 (91%) | 14 (64%) | 16 (73%) | 19 (91%) | 0.1 | 14 (93%) | 54 (76%) | 0.3 |
| None | 1 (5%) | 3 (14%) | 2 (9%) | 1 (5%) | 1 (7%) | 6 (8%) | ||
| RBC Depletion | ||||||||
| Sex Mismatch | 10 (48%) | 9 (41%) | 12 (55%) | 11 (52%) | 0.9 | 7 (47%) | 35 (49%) | 0.5 |
| No Mismatch | 5 (24%) | 4 (18%) | 3 (14%) | 5 (24%) | 5 (33%) | 12 (17%) | ||
| Male to Female | 5 (24%) | 3 (73%) | 6 (27%) | 5 (24%) | 3 (20%) | 16 (23%) | ||
| Female to Male | ||||||||
| HLA match | 6 (29%) | 10 (45%) | 10 (46% | 10 (48%) | 0.6 | 5 (33%) | 31 (44%) | 0.7 |
| ≥ 2 AG MM | 10 (47%) | 7 (32%) | 10 (46%) | 7 (33%) | 6 (40%) | 28 (40%) | ||
| 1 AG MM | 5 (24%) | 3 (14%) | 1 (5%) | 3 (14%) | 3 (20%) | 9 (13%) | ||
| No mismatch | ||||||||
Patient Characteristics
| . | QUARTILES . | Old vs. New CBU . | ||||||
|---|---|---|---|---|---|---|---|---|
| . | Q1 (n=21) . | Q2 (n=22) . | Q3 (n=22) . | Q4 (n=21) . | P value . | Old CBU (n=15) . | New CBU (n=71) . | P value . |
| Weight, Kg | 25 (5-76) | 24 (8-76) | 55 (10-78) | 24 (9-93) | 0.1 | 24 (9-80) | 31 (5-93) | 0.3 |
| Age, years | 8.6 (0.3-41) | 7.3 (0.8-57) | 18.4 (1.7-54) | 7.3 (1-53) | 0.08 | 7.3 (1.5-52.6) | 8.8 (0.4-56.5) | 0.3 |
| Diagnosis | 9 (43%) | 9 (41%) | 10 (45%) | 8 (38%) | 0.2 | 5 (33%) | 31 (44%) | 0.03 |
| ALL | 5 (24%) | 10 (45%) | 8 (36%) | 3 (14%) | 3 (20%) | 23 (32%) | ||
| AML/MDS | 1 (5%) | 0 | 1 (5%) | 2 (10%) | 1 (7%) | 3 (4%) | ||
| CML | 6 (28%) | 3 (14%) | 3 (14%) | 8 (38%) | 6 (40%) | 14 (20%) | ||
| Others | ||||||||
| Bone Marrow Blasts at Time of Transplant (%) | 4 (0-90) | 2 (0-90) | 3 (0-38) | 3 (0-73) | 1.0 | 3 (1-73) | 2 (0-90) | 0.8 |
| Rac | 16 (76%) | 13 (59%) | 14(64%) | 8 (38%) | 0.05 | 6 (40%) | 45 (63%) | <0.0001 |
| Caucasian | 1 (5%) | 1 (5%) | 2 (9%) | 4 (19%) | 3 (20%) | 5 (7%) | ||
| Black | 4 (19%) | 8 (36%) | 6 (27%) | 9 (43%) | 6 (40%) | 21 (30%) | ||
| Other | ||||||||
| Gender (Female) | 11 (52%) | 9 (41%) | 9 (41%) | 11 (52%) | 0.8 | 8 (53%) | 32 (45%) | 0.6 |
| Myeloablative Regimen | 20 (95%) | 20 (91%) | 15 (68%) | 11 (52%) | 0.002 | 7 (47%) | 59 (83%) | 0.005 |
| ATG Use | 3 (14%) | 4 (18%) | 7 (32%) | 5 (24%) | 0.6 | 5 (33%) | 14 (20%) | 0.5 |
No relevant conflicts of interest to declare.
Author notes
Asterisk with author names denotes non-ASH members.


