Key Points
This is the first time-resolved quantitative phosphoproteomic analysis of thrombin signaling in human endothelial cells.
We provide 2224 phosphosites regulated by thrombin as a unique resource for future studies on thrombin and PAR signaling.
Abstract
Thrombin is the key serine protease of the coagulation cascade and a potent trigger of protease-activated receptor 1 (PAR1)-mediated platelet aggregation. In recent years, PAR1 has become an appealing target for anticoagulant therapies. However, the inhibitors that have been developed so far increase bleeding risk in patients, likely because they interfere with endogenous PAR1 signaling in the endothelium. Because of its complexity, thrombin-induced signaling in endothelial cells has remained incompletely understood. Here, we have combined stable isotope amino acids in cell culture, affinity-based phosphopeptide enrichment, and high-resolution mass spectrometry and performed a time-resolved analysis of the thrombin-induced signaling in human primary endothelial cells. We identified 2224 thrombin-regulated phosphorylation sites, the majority of which have not been previously related to thrombin. Those sites were localized on proteins that are novel to thrombin signaling, but also on well-known players such as PAR1, Rho-associated kinase 2, phospholipase C, and proteins related to actin cytoskeleton, cell-cell junctions, and Weibel-Palade body release. Our study provides a unique resource of phosphoproteins and phosphorylation sites that may generate novel insights into an intimate understanding of thrombin-mediated PAR signaling and the development of improved PAR1 antagonists that affect platelet but not endothelial cell function.
Introduction
Thrombin is a plasma protein and the key enzyme involved in the coagulation cascade. In addition to its physiologic function in hemostasis, thrombin plays a role in a variety of pathologic conditions, including arterial and venous thrombosis, cancer, sepsis, disseminated intravascular coagulation, angiogenesis, inflammation, and wound healing.1,2 The pleiotropic actions of thrombin are mediated by the cleavage of protease-activated transmembrane receptors (PARs).3 The PAR family consists of 4 members called PAR1, PAR2, PAR3, and PAR4, which are expressed by a variety of cell types, including vascular cells (endothelial cells [ECs] and smooth muscle cells) and circulating cells (blood platelets, monocytes, and T lymphocytes).4 These receptors are irreversibly activated by cleavage of the extracellular loop which results in the formation of a novel N terminus that serves as a tethered ligand and folds back into the ligand-binding pocket of the receptor.3,5
In recent years, thrombin signaling has become a key target for antithrombotic therapies, and novel PAR1 inhibitors such as vorapaxar and atopaxar have been developed for anticoagulant therapies. However, these inhibitors increase bleeding risks, which have been suggested to result from the interference of endogenous PAR1 signaling in the endothelium.6,7 PAR1 is the predominant thrombin receptor in ECs,8 and its thrombin-mediated cleavage induces conformational changes that initiate heterotrimeric G-protein signaling, which activates a plethora of intracellular events,3 including cytoskeletal rearrangements, opening of the EC-cell junctions, and the release of storage organelles called Weibel-Palade bodies that contain various vasoactive substances.9,10 Eventually, this results in increased vascular permeability and release of proinflammatory, hemostatic, and vasoactive substances.11 In addition, thrombin regulates blood vessel diameter by nitric oxide–dependent vasodilation and upregulates surface adhesion molecules that recruit neutrophils and leukocytes.11,12 Each of these individual processes is the subject of intensive research. However, because of the complexity of the induced signal transduction networks, the extent of crosstalk between these processes and how thrombin-induced EC signaling events are orchestrated at the molecular level have remained undefined.
Traditionally, studies of EC signaling events have mostly focused on single proteins or have been addressed by using unbiased approaches at the gene expression level. However, protein functions and signaling networks are regulated by rapid and reversible protein phosphorylation.13 In recent years, mass spectrometry (MS) has greatly evolved and can now be used to identify thousands of phosphorylation sites. In combination with appropriate quantitative approaches, such as stable isotope labeling with amino acids in cell culture (SILAC),14 phosphorylation dynamics can be assessed in an unbiased manner.15-17 Despite the fact that robust workflows have been developed to perform quantitative MS proteomic analysis and extensively used to study phosphorylation dynamics in cell cultures, global phosphoproteomics has only very recently been successfully applied to primary ECs.18-21 In this study, we have performed a system-wide and time-resolved characterization of thrombin-induced signaling in primary human blood outgrowth ECs (BOECs). BOECs are ECs derived from human peripheral blood and are a bona fide EC culture model with superior expansion capacity over traditional EC culture models.22 Furthermore, they represent a promising cell model for studying EC signaling defects in different patient populations. Regulated phosphorylations were measured for a vast proportion of the BOEC phosphoproteome. Therefore, our study provides a unique resource to better understand the complexity of thrombin signaling and opens new possibilities for developing improved pharmacologic approaches for controlling thrombotic disorders.
Materials and Methods
EC culture
BOECs were isolated and SILAC-labeled as previously described with minor modifications.22,23 For the proteomic analysis, BOECs were starved for 2 hours in SILAC endothelial basal medium 2 and stimulated with 1 U/mL high-activity thrombin (Sigma) for 2, 5, 10, or 30 minutes. Light, medium, and heavy SILAC cells were lysed with sodium dodecyl sulfate (SDS) lysis buffer, 4% SDS, 100 mM dithiothreitol, 100 mM tris(hydroxymethyl)aminomethane (pH 7.4), and phosphatase and protease inhibitor cocktail (Thermo Scientific). Experiments were performed in triplicate.
Immunofluorescence
SILAC BOECs were grown to confluence, stimulated with thrombin as described above, and fixed with 3.7% paraformaldehyde. Immunofluorescence analysis was performed as previously described24 using monoclonal CLB-Rag20 (immunoglobulin G2b [IgG2b])25 and CLB-HEC75 (IgG1)26 to stain von Willebrand factor (VWF) and platelet/EC adhesion molecule 1 (PECAM-1), respectively.
Western blots
Cells were stimulated with thrombin as described above and lysed with 2× SDS polyacrylamide gel electrophoresis buffer (0.125 M tris(hydroxymethyl)aminomethane [pH 6.8], 4% SDS, 20% glycerol, 0.02% bromophenol blue) supplemented with 100 mM dithiothreitol, and phosphatase and protease inhibitor cocktail (Thermo Scientific). The following antibodies were used: anti–p-myosin light chain 2 (Thr18, Ser19) (Cell Signaling), anti-pERK (E-4) (Tyr204) (Santa Cruz) and anti–phospho-p38 MAP kinase (Thr180/Tyr182) (Cell Signaling). Mouse anti–α-tubulin (Sigma) was used as a loading control.
Phosphoproteome
Equal amounts of light, medium, and heavy SILAC-labeled lysates were mixed together and processed as previously described.16,17 Briefly, mixed proteins were digested by using the filter-aided sample preparation method,27 peptides were separated with strong cation exchange chromatography, and phosphopeptides were enriched by using TiO2 beads (GL Sciences) in the presence of 2,5-dihydroxybenzoic acid.28 Phosphorylated peptides were eluted with 15% ammonium hydroxide and 40% acetonitrile (ACN), loaded onto Empore-C18 StageTips,29 eluted with 80% ACN and 0.5% acetic acid, and stored at −80°C until MS analysis.
Secretome
The light, medium, and heavy supernatants were combined. Proteins were isolated by using silica-based resin (J.R.H.-F., M.v.d.B., and S.Z., manuscript in preparation) and in-gel digested.30 Peptides were loaded onto Empore-C18 StageTips,29 eluted with 80% ACN and 0.5% acetic acid, and stored at −80°C until MS analysis.
MS analysis
Digested peptides were separated by nanoscale reverse chromatography (Thermo Scientific) coupled on line to a linear trap quadrupole Orbitrap Elite mass spectrometer (Thermo Scientific) via a nanoelectrospray ion source (Thermo Scientific). Full-scan MS spectra were acquired in the Orbitrap analyzer with a resolution of 120 000 at 400 m/z, and a target value of 1 000 000 charges. The 10 most intense ions were selected for high collision dissociation fragmentation with a target value of 40 000 charges and acquired in the Orbitrap with resolution of 15 000 at 400 m/z. All data were acquired with Xcalibur software and were analyzed by using the MaxQuant computational platform.31
More details and a detailed description of the MS data analysis can be found in the supplemental Materials and Methods, available on the Blood Web site.
Results
Quantitative phosphoproteomics of thrombin-stimulated ECs
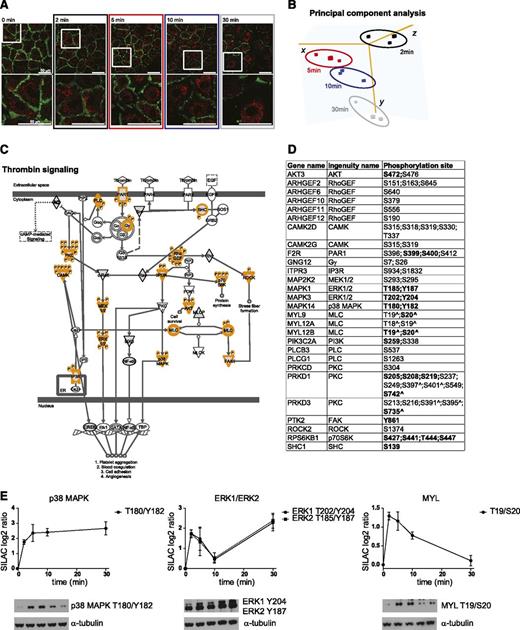
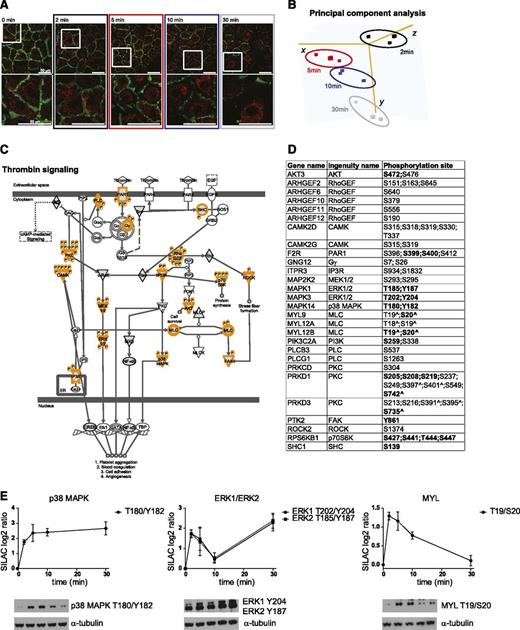
To investigate the dynamics of thrombin signaling, we performed a time-resolved phosphoproteomic analysis of thrombin-stimulated BOECs by using a three-way reverse SILAC labeling strategy (supplemental Figure 1A). First, BOECs were fully metabolically labeled with light, medium, or heavy arginine and lysine. SILAC labeling did not affect the cobblestone morphology and the presence of EC markers including VWF-containing Weibel-Palade bodies and PECAM-1 (supplemental Figure 1B-D). Then, we stimulated SILAC-labeled BOECs with thrombin for 2, 5, 10, or 30 minutes, which resulted in a clear disruption of cell-cell junctions as shown by reduced PECAM-1 staining using immunofluorescence analysis (Figure 1A). Finally, we applied a robust workflow that combines strong cation exchange chromatography peptide separation, affinity-based phosphopeptide enrichment, and high-resolution Orbitrap-based MS17 (supplemental Figure 1A). MS data were analyzed by using the MaxQuant computational platform,31 which identified 10 343 accurately localized (class I16 ) phosphorylation sites (referred to as phosphosites) (supplemental Table 1), containing 9366 serine (90.6%), 934 threonine (9%), and 43 tyrosine (0.4%) residues (supplemental Table 1). Of note, a substantial number (17%) of those sites has not been reported previously (supplemental Table 1). For 7791 phosphosites, a SILAC ratio (calculated as phosphorylation level between stimulated and nonstimulated BOECs) was accurately measured in at least 2 of the 3 replicates at each time point and used to calculate the correlation between experiments. This clearly indicated a high reproducibility between replicates (average correlation of 0.8). Conversely, lower correlation was measured between time points (supplemental Figure 1E), suggesting that increasing phosphoproteomic changes occur in BOECs stimulated with thrombin in time. This observation was further emphasized by a principle component analysis of the SILAC ratios, which clearly separated the EC phosphoproteomes according to the duration of thrombin stimulation (Figure 1B). To identify the regulated phosphosites, we required the SILAC ratio (log2) for at least 2 replicates of the same time point to be higher than 0.75, which approaches 1 standard deviation from the mean of the measured SILAC ratios (supplemental Figure 1F). This identified 2224 phosphosites localized on 1172 proteins (supplemental Table 1). Because of the short time course analyzed (30 minutes), we did not expect changes in protein levels (eg, due to protein degradation) to have an impact on the measurements of the phosphorylation levels. This assumption was supported by a standard deviation lower than 20% for the SILAC ratio measured for the proteins identified by using the nonphosphorylated peptides of the phosphoproteomic study16 (supplemental Figure 2).
Phosphoproteomic data recapitulate canonical thrombin signaling. (A) Immunostaining for PECAM-1 (green) and VWF (red) of SILAC BOECs treated with 1 U/mL thrombin for the indicated time. The bottom panels show zoomed-in areas (boxed) in the top panels. Bar = 50 µm. LSM510 confocal laser scanning microscopy (Carl Zeiss), ×63/1.4 oil objective. (B) Three principal components that captured 67.8% of the total variance of the BOEC phosphoproteome changes during thrombin stimulation are shown. Principle component analysis was performed on the SILAC ratios of the phosphosites quantified in all experiments. Colors are as in (A). (C) Thrombin signaling according to Ingenuity. MS-identified phosphoproteins are shown in gray, and those for which significantly regulated phosphosites were measured are indicated with an orange border. Each P indicates a distinct regulated phosphosite, reported in (D). (D) Detailed list of the phosphosites depicted in (C). Bold, functional phosphosite (according to PhosphoSitePlus); ^, redundant site. The reported amino acid position refers to the protein within the protein group for which a reference number (referred to as UniProtKB) was found in the PhosphoSitePlus database. (E) Mean and standard deviation for the MS-based quantifications. Western blot analysis for phospho mitogen-activated protein kinase (MAPK)1/ERK2 (Y187), phospho MAPK3/ERK1 (Y204), phospho MAPK14/p38 MAPK (T180/Y182), and phospho MYL/MLC (T19/S20). Time points are as indicated in (A). α-tubulin was used as loading control.
Phosphoproteomic data recapitulate canonical thrombin signaling. (A) Immunostaining for PECAM-1 (green) and VWF (red) of SILAC BOECs treated with 1 U/mL thrombin for the indicated time. The bottom panels show zoomed-in areas (boxed) in the top panels. Bar = 50 µm. LSM510 confocal laser scanning microscopy (Carl Zeiss), ×63/1.4 oil objective. (B) Three principal components that captured 67.8% of the total variance of the BOEC phosphoproteome changes during thrombin stimulation are shown. Principle component analysis was performed on the SILAC ratios of the phosphosites quantified in all experiments. Colors are as in (A). (C) Thrombin signaling according to Ingenuity. MS-identified phosphoproteins are shown in gray, and those for which significantly regulated phosphosites were measured are indicated with an orange border. Each P indicates a distinct regulated phosphosite, reported in (D). (D) Detailed list of the phosphosites depicted in (C). Bold, functional phosphosite (according to PhosphoSitePlus); ^, redundant site. The reported amino acid position refers to the protein within the protein group for which a reference number (referred to as UniProtKB) was found in the PhosphoSitePlus database. (E) Mean and standard deviation for the MS-based quantifications. Western blot analysis for phospho mitogen-activated protein kinase (MAPK)1/ERK2 (Y187), phospho MAPK3/ERK1 (Y204), phospho MAPK14/p38 MAPK (T180/Y182), and phospho MYL/MLC (T19/S20). Time points are as indicated in (A). α-tubulin was used as loading control.
Quantitative MS-based phosphoproteomics recapitulates known thrombin signaling
PAR1 activation induces a plethora of proteins and cellular processes, including heterotrimeric G proteins, phospholipase C β, calcium mobilization, protein kinase C (PKC), calcium-regulated kinase (CAMK), small guanosine triphosphate enzymes (GTPases), including Rho and rac, Rho-associated kinase 2 (ROCK2), focal adhesion kinase (PTK2/FAK), myosin light chain (MYL/MLC), nonreceptor tyrosine kinases of the Src family, and members of MAPK family.3 Our quantitative MS approach identified regulated phosphorylation levels on most of these proteins (Figure 1C-D), and western blot analysis largely confirmed the phosphorylation dynamics of MAPK1/ERK2, MAPK2/ERK1, MAPK14/p38 MAPK, and MYL/MLC (Figure 1E). A unique exception was the dephosphorylation profile of the T180/Y182 of MAPK14/p38 MAPK after prolonged stimulation with thrombin. This may be a result of other posttranslational modifications on amino acids surrounding the phosphorylated sites that may prevent the binding of the antibody. However, altogether this suggests the potential of our dataset as a resource of dynamically regulated thrombin-induced phosphosites. We next performed bioinformatic analysis on the regulated phosphosites.
Distinct temporal phosphoproteomic profiles are identified in thrombin-stimulated BOECs
To gain more insight into the temporal phosphoproteomic regulation of BOECs stimulated with thrombin, we performed a hierarchical clustering, preprocessed with k-mean, of the 2224 regulated phosphosites. This identified (1) 4 clusters of sites with increased phosphorylation levels (1652 sites; clusters 1 to 4) and 2 clusters of sites with decreased phosphorylation levels (572 sites; clusters 5 and 6); (2) clusters with distinct temporal profiles: early- (clusters 1, 2, and 5) and late- (clusters 3, 4, and 6) regulated phosphosites; and (3) clusters with different strengths of induced signaling, in which clusters 1 and 3 showed higher changes in phosphorylation levels compared with the other clusters (Figure 2A). To investigate whether specific categories of phosphoproteins belong to each cluster, we performed an enrichment analysis which identified specific sets of gene ontology biologic processes,32 gene ontology cellular components,32 and gene ontology molecular functions33 associated with the 6 clusters (Figure 2B; supplemental Table 3). These included general categories, such as membrane part and cytoskeletal part, but also specific categories, including cytoplasmic vesicle membrane and regulation of Rho protein signal transduction, which were enriched immediately after thrombin stimulation, regulation of microtubule depolymerization, and activation of MAPK activity, which were enriched only after prolonged thrombin stimulation and adherens junction. Although all these categories have already been associated with thrombin signaling, many of the individual proteins and phosphosites are novel to this pathway.
Thrombin induces phosphoproteomic changes with distinct temporal profiles. (A) Heat map and hierarchical clustering (with k-means) based on the SILAC ratio (log2) of 2224 thrombin-regulated phosphosites. The 6 clusters discriminate between early- (clusters 1, 2, and 5) and late- (clusters 3, 4, and 6) induced phosphorylation changes, and between upregulated (clusters 1-4) and downregulated (clusters 5 and 6) phosphosites. Heat map colors are based on the SILAC ratio (log2) reported in supplemental Table 2. (B) Heat map of the gene ontology category enrichment analysis of the 6 clusters in (A). Colors are based on the calculated enrichment factor. Black, not significant. (C) Heat map of the linear amino acid kinase motifs enriched in the 6 clusters in (A) according to Motif-X. Colors are based on the score calculated by Motif-X. Black, not significant. (D) List of the kinases with predicted activity (based on the motifs reported in supplemental Table 2). The dots in the first 4 columns (clusters 1-4 in [A]) refer to kinases with predicted increased activity because they correspond to clusters 1 to 4, which contain phosphosites upregulated upon thrombin stimulation; the dots in the last 2 columns (clusters 5 and 6 in [A]) refer to kinases with predicted decreased activity because they correspond to clusters 5 and 6, which contain phosphosites downregulated upon thrombin stimulation. The colors of the dots are the same as the colors of the clusters in (A). No dot, not significant.
Thrombin induces phosphoproteomic changes with distinct temporal profiles. (A) Heat map and hierarchical clustering (with k-means) based on the SILAC ratio (log2) of 2224 thrombin-regulated phosphosites. The 6 clusters discriminate between early- (clusters 1, 2, and 5) and late- (clusters 3, 4, and 6) induced phosphorylation changes, and between upregulated (clusters 1-4) and downregulated (clusters 5 and 6) phosphosites. Heat map colors are based on the SILAC ratio (log2) reported in supplemental Table 2. (B) Heat map of the gene ontology category enrichment analysis of the 6 clusters in (A). Colors are based on the calculated enrichment factor. Black, not significant. (C) Heat map of the linear amino acid kinase motifs enriched in the 6 clusters in (A) according to Motif-X. Colors are based on the score calculated by Motif-X. Black, not significant. (D) List of the kinases with predicted activity (based on the motifs reported in supplemental Table 2). The dots in the first 4 columns (clusters 1-4 in [A]) refer to kinases with predicted increased activity because they correspond to clusters 1 to 4, which contain phosphosites upregulated upon thrombin stimulation; the dots in the last 2 columns (clusters 5 and 6 in [A]) refer to kinases with predicted decreased activity because they correspond to clusters 5 and 6, which contain phosphosites downregulated upon thrombin stimulation. The colors of the dots are the same as the colors of the clusters in (A). No dot, not significant.
We exploited our data further to predict the kinase activity responsible for the above described phosphoproteomic regulation. We used two approaches based on the amino acid sequence surrounding the regulated phosphosites: (1) Motif-X,33 which identifies enriched linear kinase motif (Figure 2C) and (2) enrichment analysis for predicted kinase activity (Figure 2D and supplemental Table 3) in which kinases identified in clusters 1 to 4 represent those with increased activity, while those in clusters 5 and 6 represent those with decreased activity. The results of these analyses corroborated each other. Motif-X identified enriched motifs with an arginine at position −3 (referred to as arginine-directed) or a hydrophobic amino acid at position +1 immediately after thrombin activation (Figure 2C; clusters 1 and 2). Accordingly, the kinase activity analysis predicted early increased activity of the arginine-directed kinases CAMKs, PKA, PKC, RPS6KB1/p70 S6 kinase, and PAK2. Furthermore, Motif-X identified motifs with a proline at position +1 (referred to as proline-directed) after prolonged thrombin stimulation (Figure 2C; clusters 3 and 4) and, accordingly, late regulated activity was predicted for the proline-directed kinases CDK1, CDK2, CDK4, and CDK6 as well as MAPK3/ERK1, MAPK1/ERK2, GSK3, and CDK5 (Figure 2D). Of note, the latter ones were enriched in clusters containing upregulated and downregulated phosphosites. For MAPK3/ERK1, MAPK1/ERK2, RPS6KB1/p70 S6 kinase, and CDK2, the functional sites were regulated, supporting the predicted increased or decreased activity upon thrombin stimulation. Furthermore, regulated phosphorylation levels on not yet characterized sites were measured on kinases with predicted activity, including PRKCD/PKC, CAMK2D, and CAMK2G, which are known to play a role in thrombin signaling, and PRKAA1/AMP-activated protein kinase and PAK2 (Table 1).
Next, we analyzed the thrombin signaling in the context of the global kinome, which is composed of 518 kinases (according to Manning et al34 and reported in Pfam as “pkinase”), and 224 phosphatases (according to the DEPOD database35 ). Thrombin induced phosphosite regulation on 65 kinases and 9 protein phosphatases (Table 1). For 16 of the kinases, significant regulation was measured for the functional sites; of those, 8 are kinases with an established role in thrombin signaling: AKT3, MAPK1/ERK2, MAPK3/ERK1, MAPK14/p38 MAPK, PRKD1, PRKD3, PTK2/FAK, and RPS6KB1/p70 S6 kinase (Figure 1C and Table 1), and for 3 of them, our analysis predicted increased activity (Figure 2D). The other 8 are kinases for which little or no information is available related to thrombin: ADRPK1, EPHA2, FYN, ILK, LATS1, PRKD2, RPS6KA3, and TAOK3. The 48 kinases with regulated sites that have not yet been functionally characterized included additional kinases known to play a role in thrombin signaling, including CAMK2D, CAMK2G, MAP2K2, PRKCD, and ROCK2 (Figure 2D).
Phosphoproteome regulation of known thrombin-induced pathways
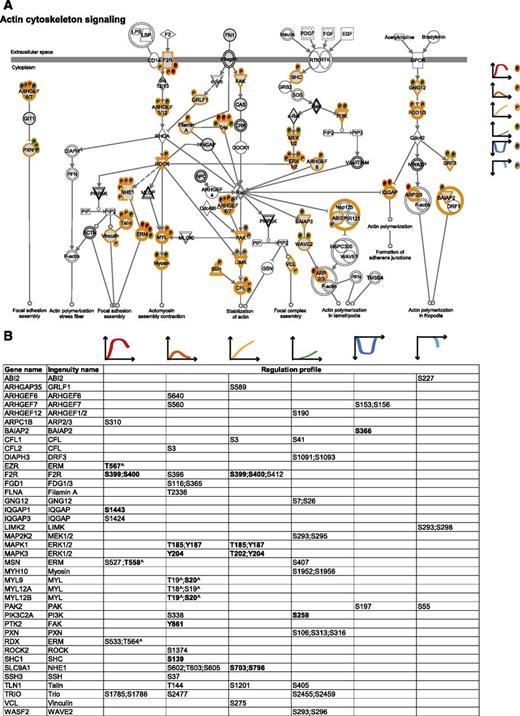
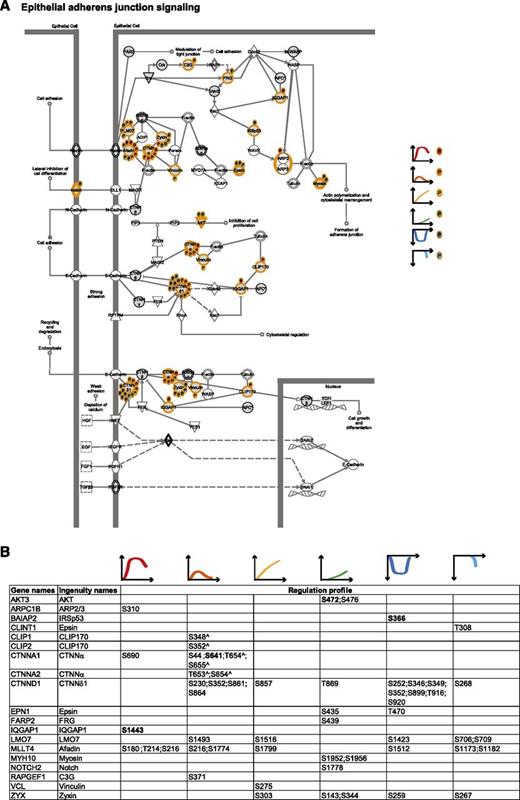
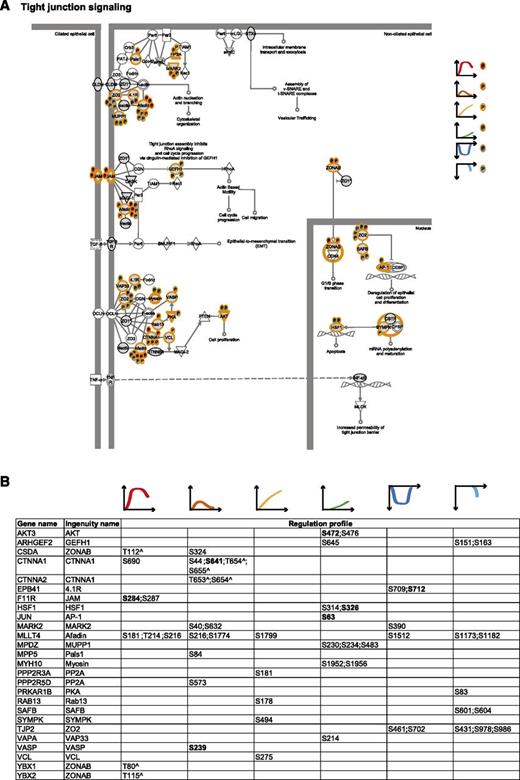
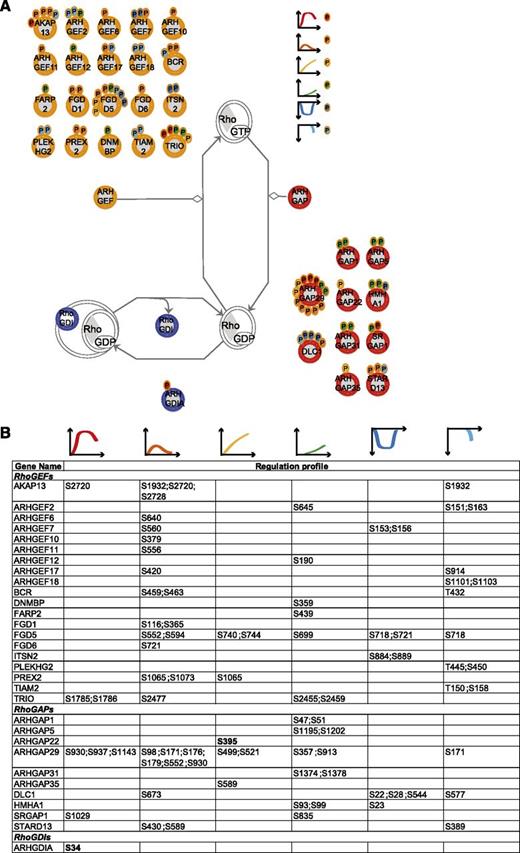
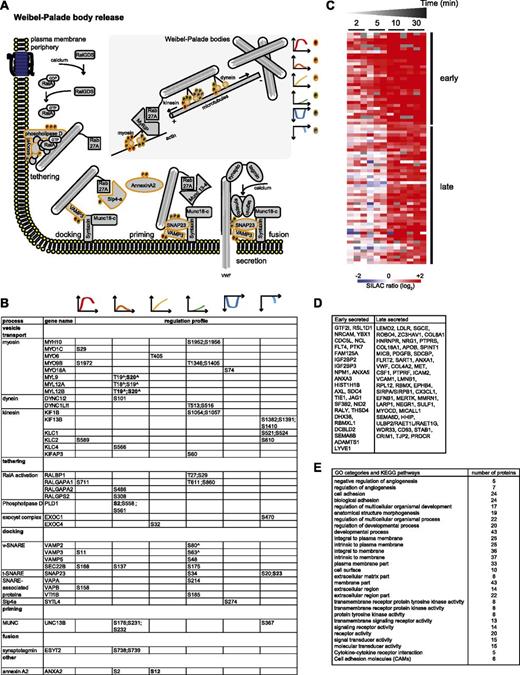
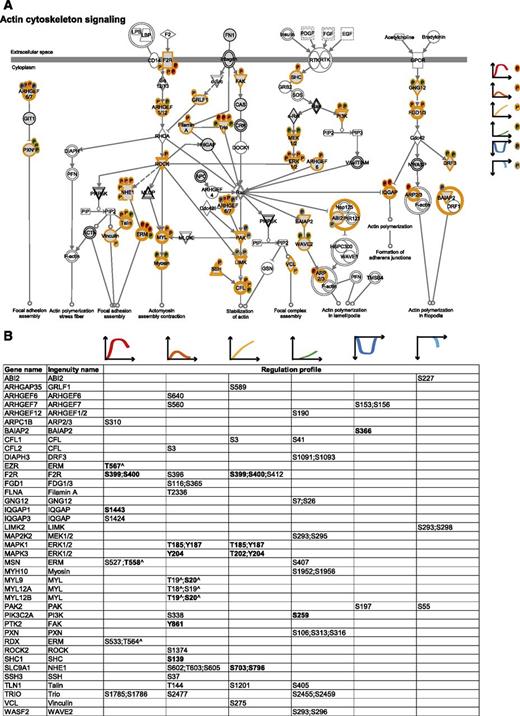
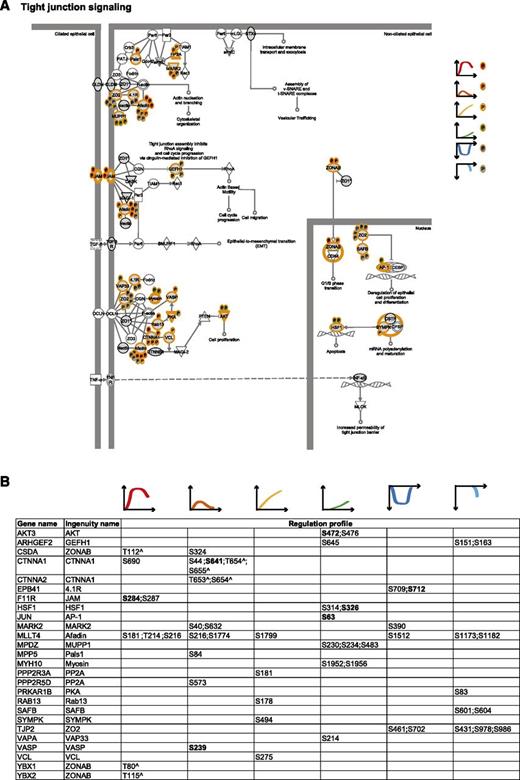
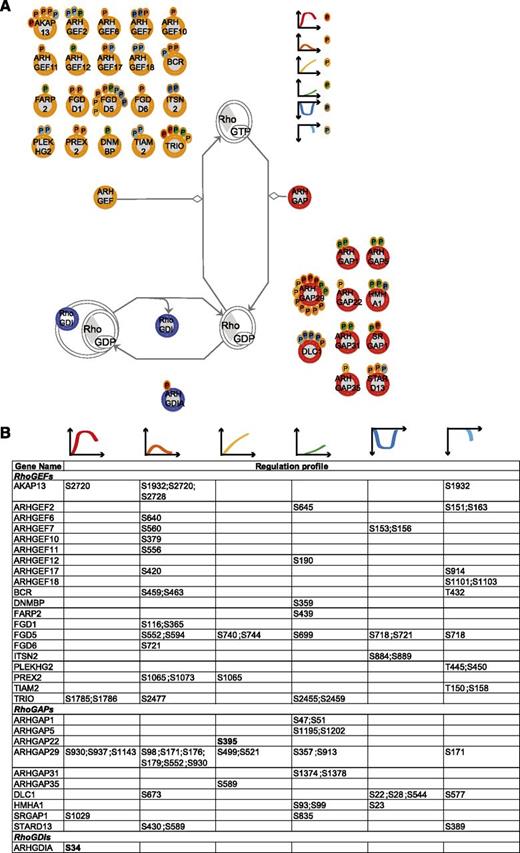
To integrate our phosphoproteomic data into the known thrombin signaling pathways and make this information easily accessible, we exploited Ingenuity software and mapped the regulated phosphosites on the following predefined pathways: actin cytoskeleton signaling (Figure 3), epithelial adherence and tight junctions signaling (Figures 4 and 5), and RhoGDI signaling (Figure 6).36 This showed the striking impact of thrombin stimulation on the endothelial phosphoproteome with the majority of the identified phosphoproteins containing regulated phosphosites. Furthermore, our data revealed a complex phosphorylation pattern at the single protein level, whereby proteins such as CTNND1/p120 and ARHGAP29 contained multiple phosphosites with different regulation profiles. We additionally built up a literature-based secretory machinery pathway (Figure 7A-B)37-41 and complemented these data with a detailed list of proteins whose secreted levels were regulated upon thrombin stimulation. SILAC MS proteomic analysis quantified 1744 proteins, of which 77 showed a consistent increased secretion (SILAC ratio [log2] ≥ 1.5-fold compared with nonstimulated cells; Figure 7C-D) upon short or prolonged thrombin stimulation (supplemental Table 4). Among them was the major component of Weibel-Palade bodies, VWF. Category enrichment analysis (supplemental Table 5) additionally pointed out 22 proteins belonging to the category “extracellular region part” and 20 in the category “receptor activity” (Figure 7E), which includes the protein tyrosine kinase receptor Tie-1, the vascular endothelial growth factor receptor 3 (FLT4), the hepatocyte growth factor receptor and endothelial protein C receptor (Figure 7D).
The cytoskeletal machinery. (A) Actin cytoskeleton signaling. MS-identified phosphoproteins are shown in gray, and those for which significantly regulated phosphosites were measured are indicated with an orange border. Each P indicates a distinct regulated phosphosite, and the color is the same as the cluster it belongs to, according to Figure 2A. (B) Detailed list of the phosphosites depicted in (A). The reported amino acid position refers to the protein within the protein group for which a reference number (referred to as UniProtKB) was found in PhosphoSitePlus database. Bold, functional phosphosite (according to PhosphoSitePlus); ^, a redundant site.
The cytoskeletal machinery. (A) Actin cytoskeleton signaling. MS-identified phosphoproteins are shown in gray, and those for which significantly regulated phosphosites were measured are indicated with an orange border. Each P indicates a distinct regulated phosphosite, and the color is the same as the cluster it belongs to, according to Figure 2A. (B) Detailed list of the phosphosites depicted in (A). The reported amino acid position refers to the protein within the protein group for which a reference number (referred to as UniProtKB) was found in PhosphoSitePlus database. Bold, functional phosphosite (according to PhosphoSitePlus); ^, a redundant site.
Adherens junction signaling. (A) Epithelial adherens junction signaling. MS-identified phosphoproteins are shown in gray, and those for which significantly regulated phosphosites were measured are indicated with an orange border. Each P indicates a distinct regulated phosphosites, and the color is the same as that of the cluster it belongs to, according to Figure 2A. (B) Detailed list of the phosphosites depicted in (A). The reported amino acid position refers to the protein within the protein group for which a reference number (referred to as UniProtKB) was found in PhosphoSitePlus database. Bold, functional phosphosite (according to PhosphoSitePlus); ^, a redundant site.
Adherens junction signaling. (A) Epithelial adherens junction signaling. MS-identified phosphoproteins are shown in gray, and those for which significantly regulated phosphosites were measured are indicated with an orange border. Each P indicates a distinct regulated phosphosites, and the color is the same as that of the cluster it belongs to, according to Figure 2A. (B) Detailed list of the phosphosites depicted in (A). The reported amino acid position refers to the protein within the protein group for which a reference number (referred to as UniProtKB) was found in PhosphoSitePlus database. Bold, functional phosphosite (according to PhosphoSitePlus); ^, a redundant site.
Tight junction signaling. (A) Tight junction signaling. MS-identified phosphoproteins are shown in gray, and those for which significantly regulated phosphosites were measured are indicated with an orange border. Each P indicates a distinct regulated phosphosite, and the color is the same as that of the cluster it belongs to, according to Figure 2A. (B) Detailed list of the phosphosites depicted in (A). The reported amino acid position refers to the protein within the protein group for which a reference number (referred to as UniProtKB) was found in PhosphoSitePlus database. Bold, functional phosphosite (according to PhosphoSitePlus); ^, a redundant site.
Tight junction signaling. (A) Tight junction signaling. MS-identified phosphoproteins are shown in gray, and those for which significantly regulated phosphosites were measured are indicated with an orange border. Each P indicates a distinct regulated phosphosite, and the color is the same as that of the cluster it belongs to, according to Figure 2A. (B) Detailed list of the phosphosites depicted in (A). The reported amino acid position refers to the protein within the protein group for which a reference number (referred to as UniProtKB) was found in PhosphoSitePlus database. Bold, functional phosphosite (according to PhosphoSitePlus); ^, a redundant site.
RhoA regulators. (A) Identified RhoGEFs, RhoGAPs, and RhoGDIs (according to the HUGO Gene Nomenclature Committee Rho GTPase activating proteins (ARHGAP), Rho guanine nucleotide exchange factors (ARHGEF), and Rho GDP dissociation inhibitor (ARHGDIA, ARHGDIB, ARHGDIG) with their regulated phosphosites. The scheme is based on Ingenuity pathway. Each P indicates a distinct regulated phosphosite, and the color is the same as that of the cluster it belongs to, according to Figure 2A. (B) Detailed list of the phosphosites depicted in (A). The reported amino acid position refers to the protein within the protein group for which a reference number (referred to as UniProtKB) was found in PhosphoSitePlus database. Bold, functional phosphosite (according to PhosphoSitePlus); ^, a redundant site.
RhoA regulators. (A) Identified RhoGEFs, RhoGAPs, and RhoGDIs (according to the HUGO Gene Nomenclature Committee Rho GTPase activating proteins (ARHGAP), Rho guanine nucleotide exchange factors (ARHGEF), and Rho GDP dissociation inhibitor (ARHGDIA, ARHGDIB, ARHGDIG) with their regulated phosphosites. The scheme is based on Ingenuity pathway. Each P indicates a distinct regulated phosphosite, and the color is the same as that of the cluster it belongs to, according to Figure 2A. (B) Detailed list of the phosphosites depicted in (A). The reported amino acid position refers to the protein within the protein group for which a reference number (referred to as UniProtKB) was found in PhosphoSitePlus database. Bold, functional phosphosite (according to PhosphoSitePlus); ^, a redundant site.
The secretory machinery. (A) Drawing representing the mechanisms involved in Weibel-Palade body release, based on literature data. MS-identified phosphoproteins for which significantly regulated phosphosites were measured are indicated with an orange border. Each P indicates a distinct regulated phosphosite, and the color is the same as that of the cluster it belongs to, according to Figure 2A. (B) Detailed list of the phosphosites depicted in (A). The reported amino acid position refers to the protein within the protein group for which a reference number (referred to as UniProtKB) was found in PhosphoSitePlus database. Bold, functional phosphosite (according to PhosphoSitePlus); ^, a redundant site. (C) Heat map of the SILAC (log2) ratio of 77 proteins of the BOEC secretome with increased abundance upon thrombin stimulation. The black lines indicate 2 groups of proteins with increased levels measured after 2 to 5 minutes (early) or 10 to 30 minutes (late). Colors are based on the SILAC ratio (log2) reported in supplemental Table 4. (D) List of the gene names of the proteins represented in the heat map in (C). (E) Enriched gene ontology and Kyoto Encyclopedia of Genes and Genomes categories (see also supplemental Table 5) for the proteins with increased secretion upon thrombin stimulation and reported in (D).
The secretory machinery. (A) Drawing representing the mechanisms involved in Weibel-Palade body release, based on literature data. MS-identified phosphoproteins for which significantly regulated phosphosites were measured are indicated with an orange border. Each P indicates a distinct regulated phosphosite, and the color is the same as that of the cluster it belongs to, according to Figure 2A. (B) Detailed list of the phosphosites depicted in (A). The reported amino acid position refers to the protein within the protein group for which a reference number (referred to as UniProtKB) was found in PhosphoSitePlus database. Bold, functional phosphosite (according to PhosphoSitePlus); ^, a redundant site. (C) Heat map of the SILAC (log2) ratio of 77 proteins of the BOEC secretome with increased abundance upon thrombin stimulation. The black lines indicate 2 groups of proteins with increased levels measured after 2 to 5 minutes (early) or 10 to 30 minutes (late). Colors are based on the SILAC ratio (log2) reported in supplemental Table 4. (D) List of the gene names of the proteins represented in the heat map in (C). (E) Enriched gene ontology and Kyoto Encyclopedia of Genes and Genomes categories (see also supplemental Table 5) for the proteins with increased secretion upon thrombin stimulation and reported in (D).
Discussion
Thrombin has rapid and profound effects on ECs, but so far, thrombin-induced signaling at the global phosphorylation level has remained poorly understood. Here, we report the most comprehensive phosphoproteomic study to date of thrombin signaling with 2224 dynamically regulated phosphosites, which clearly highlights that phosphorylations are a substantial component of the EC response to thrombin.
Time-resolved phosphoproteomics of thrombin signaling
By combining clustering and enrichment analyses of the phosphoproteomic data, we identified 6 distinct temporal profiles and thus added a temporal dimension to the phosphoregulation of cellular processes induced by thrombin. For example, our data show a complex phosphoregulation of cell-cell junction proteins, which were regulated throughout the entire time course (clusters 1, 2, 4, and 5). Conversely, the actin cytoskeletal proteins were found highly phosphorylated early after thrombin stimulation (clusters 1 and 2) and phosphoproteins related to the microtubules were generally dephosphorylated after prolonged thrombin stimulation, thus suggesting that thrombin may redirect the kinase machinery to specific subcellular components. Furthermore, similar to what has previously been observed upon vascular endothelial growth-factor stimulation,18 the temporal regulation of the phosphoproteome mirrored changes in the spatial distribution of the signaling within the cells, which started at the plasma membrane and reached the nucleus. Plasma membrane–related categories were enriched immediately after thrombin stimulation (cluster 1) as well as those related to small GTPases (including Rho) (cluster 2), which are generally activated in their membrane-bound state.42 Conversely, a multitude of different processes were found regulated after longer stimulation (clusters 3 and 4). Furthermore, when we looked at proteins related to transcription factor activity (according to gene ontology molecular function), a category that was not found significantly enriched but is representative of the signaling in the nuclear compartment, we observed that 80% (69 of the 86 phosphoproteins belonging to that category) had significantly regulated phosphosites after prolonged stimulation (belong to clusters 3, 4, and 6) (supplemental Table 6). Fifteen of those proteins were phosphoregulated at functional sites, including transcription regulators previously related to thrombin, such as JUN/Jun-b,43 but also completely novel in the thrombin field, including the histone deacetylase (HDAC1/2) and the high mobility group protein HMG-I/HMG-Y (HMGA1) (supplemental Table 2). The measured SILAC ratio allowed distinguishing between proteins with high and low phosphorylation levels (clusters 1 and 2). This highlighted low phosphorylation levels for phosphoproteins involved in the regulation of the small GTPases, which may reflect their fast and transient regulation.44 As a key example, RhoA, the master regulator of thrombin-induced actin cytoskeleton signaling, has a complex and still largely uncharacterized regulatory mechanism which involves a multitude of proteins of the RhoGEF, RhoGAP, and RhoGDI families. Our study has been able to capture a temporal regulation of 86 phosphosites on members of these protein families (Figure 6) and therefore opens new possibilities for unraveling the complexity of RhoA regulation.
Thrombin-regulated kinome
Protein kinases are targets successfully exploited by the pharmaceutical industry to develop drugs.45 The broad regulation of the EC phosphoproteome induced by thrombin suggests that kinases might be appealing targets to be investigated further in the context of thrombotic disorders, and our global phosphoproteomic data provide a unique opportunity to pinpoint the regulated kinases. The combined MS and bioinformatic analyses revealed altered phosphorylation levels of regulatory sites and predicted activity of many of the kinases which are the usual suspects in thrombin signaling, such as CAMK, PKA, and PKC, which regulate cytoskeletal protein reorganization46 and rho kinase activity.47 The kinase activity analysis also revealed a distinct temporal activation pattern, in which arginine-directed phosphorylations precede proline-directed ones. Interestingly, the latter ones, which include MAPK3/ERK1, MAPK1/ERK2, GSK3, and CDK5, were predicted with both increased (clusters 3 and 4) and decreased activity (cluster 6). A simple explanation for this opposite prediction is that within this group of kinases only some were activated by thrombin while others were not. For example, we could measure increased phosphorylation of the active site of MAPK3/ERK1 and MAPK1/ERK2, but no regulation was measured for the GSK3 regulatory site (Tyr216; supplemental Table 2). An alternative explanation is that, while in nonstimulated cells, those kinases, in combination with phosphatases, maintain basal levels of phosphorylation on a variety of substrates, upon stimulation this balance is differently altered for specific categories of proteins (eg, toward increased phosphorylation in actin cytoskeletal proteins and decreased in microtubule-related proteins).
Known thrombin-regulated signaling pathways
We integrated our phosphoproteomic data into well-defined pathways of the Ingenuity platform (Figures 4-6), and because secretory events are a key feature in thrombin signaling and are the historical interest of our laboratory, we built up a literature-based pathway of the Weibel-Palade bodies release (Figure 7). This analysis led us to the following observations: (1) the majority of the phosphoproteins within each pathway have at least one phosphosite regulated upon thrombin stimulation, which highlights that phosphorylation is a prominent component of thrombin signaling and that cellular responses to stimuli are the result of the combined effect of phosphorylations on many proteins rather than a single phosphorylation event. For example, we report dynamically regulated phosphosites on proteins within the different layers of the cell-cell junctions48 (Figures 4 and 5) and on a large number of proteins involved in Weibel-Palade body secretion, including some involved in vesicle transport, tethering, docking, priming, and fusion (Figure 7); and (2) several proteins contain multiple regulated phosphosites with distinct temporal profiles, suggesting that it is not a single but rather a combination of phosphorylation and dephosphorylation events that regulate protein function. It is tempting to speculate that these highly regulated proteins might be key hubs of the thrombin-induced signaling and therefore the most promising candidates to be investigated further.
Novel thrombin-regulated phosphoproteins
Our phosphoproteomic data provide insights on proteins that have not previously been associated with thrombin signaling. There are several interesting candidates for future studies. First, there are proteins for which we found significant changes in phosphorylation levels on functional sites, such as the epigenetic regulators HDAC1/2 (Ser421 HDAC1 and Ser422 HDAC2, supplemental Table 2) and a key enzyme of the pyrimidine synthesis pathway, glutamine-dependent carbamoyl-phosphate synthase (Ser1859 and Ser1406 CAD, supplemental Table 2). Second, there are protein kinases (Table 1), promising targets in a clinical context. Third, there are proteins that are very upstream in thrombin signaling (phosphoregulated soon after thrombin activation). One example is KIAA1462, for which we identified 15 upregulated phosphorylation sites immediately after thrombin stimulation (clusters 1 and 2) and which has been associated with coronary artery disease49 and EC-cell junctions.50 In addition, our secretome analysis revealed enrichment of membrane proteins, including the tyrosine kinase receptors Tie-1, FLT4, and hepatocyte growth factor receptor and the endothelial protein C receptor, in the supernatant of thrombin-stimulated ECs. This suggests that either protein ectodomain shedding or secretion of membrane receptors is a previously unrecognized mechanism associated with the thrombin response. Alternatively, it is tempting to speculate that thrombin itself may induce the cleavage and possibly activation of transmembrane receptors other than PARs.
Future directions
Here, we have unveiled thrombin-induced signaling in ECs. PAR1 is the predominant thrombin receptor in ECs,8 and EC activation using a PAR1 agonist peptide mimics the effects of thrombin. Therefore, we expect that the majority of the regulated phosphorylation sites that were identified in this study are mediated via PAR1 cleavage. However, PAR1-independent phosphorylations by thrombin cannot be excluded. It would be interesting to learn whether PAR1 accounts completely for the observed phosphoproteomic changes. Phosphoproteomic analysis of endothelial thrombin signaling in the presence of PAR1 inhibition may provide information about additional PARs or other receptors cleaved and activated by thrombin. In addition, similar MS-based approaches could be used to investigate the signaling induced by different PAR1 agonists, including activated protein C51 and matrix metalloproteinase 1,52 which can cleave PAR1 at different positions than thrombin and trigger differential downstream signaling. This is very relevant from a therapeutic perspective for developing PAR1 agonists and antagonists selective for specific signaling pathways with the ultimate goal of preventing coagulation without promoting bleeding.53
This article contains a data supplement.
The publication costs of this article were defrayed in part by page charge payment. Therefore, and solely to indicate this fact, this article is hereby marked “advertisement” in accordance with 18 USC section 1734.
Acknowledgments
We thank Prof Dr J. Voorberg and Dr R. Bierings for critical reading of the manuscript.
This work was supported by Cancer Research UK and Sanquin (PPOC11-037). The .raw MS files and search/identification files obtained with MaxQuant have been deposited in the ProteomeXchange Consortium (http://proteomecentral.proteomexchange.org/cgi/GetDataset) via the PRIDE partner repository54 with the dataset identifier PXD000597.
Authorship
Contribution: M.d.v.B., J.R.H.-F., B.L.v.d.E., and L.J.N. performed experiments; A.B.M., K.M., M.v.d.B. and S.Z. designed the research; and M.v.d.B. and S.Z. analyzed results, made the figures, and wrote the paper.
Conflict-of-interest disclosure: The authors declare no competing financial interests.
Correspondence: Sara Zanivan, Vascular Proteomics Laboratory, Cancer Research UK Beatson Institute, Switchback Rd, G61 1BD, Glasgow, United Kingdom; e-mail: s.zanivan@beatson.gla.ac.uk; and Maartje van den Biggelaar, Department of Plasma Proteins, Sanquin Research, Plesmanlaan 125, 1066 CX, Amsterdam, The Netherlands; e-mail: m.vandenbiggelaar@sanquin.nl.

![Figure 2. Thrombin induces phosphoproteomic changes with distinct temporal profiles. (A) Heat map and hierarchical clustering (with k-means) based on the SILAC ratio (log2) of 2224 thrombin-regulated phosphosites. The 6 clusters discriminate between early- (clusters 1, 2, and 5) and late- (clusters 3, 4, and 6) induced phosphorylation changes, and between upregulated (clusters 1-4) and downregulated (clusters 5 and 6) phosphosites. Heat map colors are based on the SILAC ratio (log2) reported in supplemental Table 2. (B) Heat map of the gene ontology category enrichment analysis of the 6 clusters in (A). Colors are based on the calculated enrichment factor. Black, not significant. (C) Heat map of the linear amino acid kinase motifs enriched in the 6 clusters in (A) according to Motif-X. Colors are based on the score calculated by Motif-X. Black, not significant. (D) List of the kinases with predicted activity (based on the motifs reported in supplemental Table 2). The dots in the first 4 columns (clusters 1-4 in [A]) refer to kinases with predicted increased activity because they correspond to clusters 1 to 4, which contain phosphosites upregulated upon thrombin stimulation; the dots in the last 2 columns (clusters 5 and 6 in [A]) refer to kinases with predicted decreased activity because they correspond to clusters 5 and 6, which contain phosphosites downregulated upon thrombin stimulation. The colors of the dots are the same as the colors of the clusters in (A). No dot, not significant.](https://ash.silverchair-cdn.com/ash/content_public/journal/blood/123/12/10.1182_blood-2013-12-546036/4/m_e22f2.jpeg?Expires=1765902475&Signature=2WE3bhYrxjyhmYySbamVLgANbrgRRdR0u5moSM29LImJrdnL6RrsgSiWEY-ivjtedkNcrdyi56vhEj-Ri-Dmtn9a8M7y6CyrQOiEmoncSCTb6Mig8z4S3auwZeaaqpQW4ddNU3ub9CWu4kxCDJMteYWpGh8pK8I70TjUIGhH9yVbT6stGCGfrujIIXqUKhlyONgv4Faq7W~mtltSmTCpdK1ZFHIlv9-LdYjwGaqaGAGDIpFPo6iYEdEJf9rikZA16c5MncIFHhHa5o1He2RLO0B-dn8yk-SNsJ2uuyQAo-STe1EefdVblsjzjst5Uh6qs5GHqAssjLKTHOy5jI6vDw__&Key-Pair-Id=APKAIE5G5CRDK6RD3PGA)



![Figure 2. Thrombin induces phosphoproteomic changes with distinct temporal profiles. (A) Heat map and hierarchical clustering (with k-means) based on the SILAC ratio (log2) of 2224 thrombin-regulated phosphosites. The 6 clusters discriminate between early- (clusters 1, 2, and 5) and late- (clusters 3, 4, and 6) induced phosphorylation changes, and between upregulated (clusters 1-4) and downregulated (clusters 5 and 6) phosphosites. Heat map colors are based on the SILAC ratio (log2) reported in supplemental Table 2. (B) Heat map of the gene ontology category enrichment analysis of the 6 clusters in (A). Colors are based on the calculated enrichment factor. Black, not significant. (C) Heat map of the linear amino acid kinase motifs enriched in the 6 clusters in (A) according to Motif-X. Colors are based on the score calculated by Motif-X. Black, not significant. (D) List of the kinases with predicted activity (based on the motifs reported in supplemental Table 2). The dots in the first 4 columns (clusters 1-4 in [A]) refer to kinases with predicted increased activity because they correspond to clusters 1 to 4, which contain phosphosites upregulated upon thrombin stimulation; the dots in the last 2 columns (clusters 5 and 6 in [A]) refer to kinases with predicted decreased activity because they correspond to clusters 5 and 6, which contain phosphosites downregulated upon thrombin stimulation. The colors of the dots are the same as the colors of the clusters in (A). No dot, not significant.](https://ash.silverchair-cdn.com/ash/content_public/journal/blood/123/12/10.1182_blood-2013-12-546036/4/m_e22f2.jpeg?Expires=1765934680&Signature=IdlAVoNWJibMqa3cwKLz44HILUyysS5lOBad1L1Hf5ZONEj2wUqdVBZ7DujZ12iXeHKVMgslChuCIJmaOQ67s1MhFUGgGSUfIrGC1aVLlwZKX42WM6QETrfk-qJLDAMA9PIPTYhOOQX~GslEOkrXIJ7xIms3oyPP2CP9m5mECRcMTcFdHT6mWKheSxg0MR-z~KmiK6z0Wp4t-XX9sEUWdS~evbj1oFccDbY9m4ha83Uustrs2Tp~5fvWOEAuWVK48KgEaE0tzMqxyzo9i23ie0EOKWJ1O7Hjvin57PGFsuamqQ-1IJhEWZ9MmItZ0EuvrafkX~cDEoBpx6271kTZPQ__&Key-Pair-Id=APKAIE5G5CRDK6RD3PGA)
