Key Points
We describe a novel, druggable pathway that controls myeloma growth through macrophages in the myeloma microenvironment.
Macrophages are dominant orchestrators of the inflammatory milieu of the myeloma niche.
Abstract
Targeted modulation of microenvironmental regulatory pathways may be essential to control myeloma and other genetically/clonally heterogeneous cancers. Here we report that human myeloma–associated monocytes/macrophages (MAM), but not myeloma plasma cells, constitute the predominant source of interleukin-1β (IL-1β), IL-10, and tumor necrosis factor-α at diagnosis, whereas IL-6 originates from stromal cells and macrophages. To dissect MAM activation/cytokine pathways, we analyzed Toll-like receptor (TLR) expression in human myeloma CD14+ cells. We observed coregulation of TLR2 and TLR6 expression correlating with local processing of versican, a proteoglycan TLR2/6 agonist linked to carcinoma progression. Versican has not been mechanistically implicated in myeloma pathogenesis. We hypothesized that the most readily accessible target in the versican-TLR2/6 pathway would be the mitogen-activated protein 3 (MAP3) kinase, TPL2 (Cot/MAP3K8). Ablation of Tpl2 in the genetically engineered in vivo myeloma model, Vκ*MYC, led to prolonged disease latency associated with plasma cell growth defect. Tpl2 loss abrogated the “inflammatory switch” in MAM within nascent myeloma lesions and licensed macrophage repolarization in established tumors. MYC activation/expression in plasma cells was independent of Tpl2 activity. Pharmacologic TPL2 inhibition in human monocytes led to dose-dependent attenuation of IL-1β induction/secretion in response to TLR2 stimulation. Our results highlight a TLR2/6-dependent TPL2 pathway as novel therapeutic target acting nonautonomously through macrophages to control myeloma progression.
Introduction
High-resolution genomic studies have uncovered the massive clonal and genetic heterogeneity of myeloma cancer cells and have demonstrated the limits and potential perils associated with targeting of subclonal mutations.1-6 Clonal/genetic heterogeneity is present very early in the disease process, and treatment decisions for clinically indolent but genetically unstable early-stage myeloma can be complex.7-10 Attention is therefore shifting onto targeted modulation of tumor microenvironmental pathways that generally operate without regard to the genetic composition of cancer cells. Myeloma cells are critically dependent on cytokine support at all stages of tumor development and progression.11-13 Ample experimental evidence demonstrates an essential role for pro-inflammatory cytokines including interleukin-6 (IL-6), IL-1β, and tumor necrosis factor-α (TNF-α) in myeloma development, progression, and acquisition of drug resistance.11,14,15 The anti-inflammatory cytokine IL-10 has also been shown to provide direct growth support to myeloma cells.16,17 Whereas IL-1β and TNF-α mainly act by activating the nuclear factor κB (NF-κB) pathway in myeloma cells,18,19 IL-6 and IL-10 exert their complex actions through the Janus kinase/signal transducer and activator of transcription pathway as well as the mitogen-activated protein (MAP) kinase and phosphatidylinositol 3-kinase/AKT pathways.20,21
Durie and coauthors highlighted the importance of macrophages as a potential source of paracrine inflammatory cytokines in myeloma in an early study.22 Later work, including work from our laboratory,23-26 demonstrated that macrophages support myeloma cells in the niche through both contact-mediated and noncontact-mediated mechanisms.27,28 In a previous study from our group, we analyzed the transcriptional profile of myeloma-associated monocytes/macrophages to determine their state of activation/polarization.24 Our work demonstrated that monocytes/macrophages acquire a strongly pro-inflammatory transcriptional profile in the myeloma microenvironment. The transcriptional upregulation of IL-1β was very striking, although transcriptional upregulation of IL-10, IL-6, and TNF-α were also significant.24 However, it was still not clear whether monocytic lineage cells were the major drivers of cytokine production in the myeloma niche. The identity of signals that activate monocytic cells in myeloma bone marrow (BM) also remained enigmatic.
To address these questions, we compared cytokine gene transcription in paired purified CD14+ monocytic cells, CD138+ plasma cells, and mesenchymal stem/stromal cells (MSC) derived from BM aspirates obtained at diagnosis. Macrophages were dominant inflammatory cytokine producers in the myeloma niche. We further hypothesized that their Toll-like receptor (TLR) expression patterns might provide clues regarding the identity of macrophage-activation stimuli in the myeloma microenvironment. TLRs are pattern-recognition receptors, evolutionarily conserved molecules expressed by monocytes/macrophages (and other immune cells) that activate innate immune responses in the face of threats or stress.29,30 In addition to pathogen-derived components (pathogen-associated molecular patterns), TLRs recognize endogenous ligands produced as a result of tissue damage or necrosis (danger-associated molecular patterns).31 TLR expression patterns in myeloma-associated monocytes/macrophages (MAM) suggested that the relevant ligand might be versican. Versican is a large extracellular matrix proteoglycan previously shown to enhance carcinoma metastasis through TLR2/6-mediated nonautonomous activation of myeloid cells in the metastatic niche.32-38 However, versican had not previously been implicated in myeloma pathogenesis.
Versican-mediated TLR2/6 signaling would be predicted to activate the MAP3Kinase, TPL2 (Cot, MAP3K8).39,40 TPL2 kinase constitutes a unique and nonredundant signaling node downstream of TLR in macrophages.39-41 We have previously shown constitutive activity of TPL2-dependent pathways in MAM but the precise functional significance has been unclear.23 Here we show that TPL2 activity is essential for the induction of an “inflammatory switch” in MAM, a critical step in myeloma tumor progression.
Materials and methods
Patient sample collection and processing
BM aspirates were collected with informed consent under a University of Wisconsin institution review board–approved protocol (HO07403). Purity of CD14+ and CD138+ cell fractions was routinely higher than 90% and was confirmed by morphologic analysis (see supplemental Figure 1 on the Blood Web site). This study was conducted in accordance with the Declaration of Helsinki.
TLR2 stimulation and TPL2 kinase inhibition
Culture conditions of human monocytic cell line THP-1 are detailed in the supplemental Methods. The TPL2 kinase inhibitor-I (616373) (Calbiochem, Billerica, MA) is a cell-permeable naphthyridine compound that acts as a potent, reversible, and adenosine triphosphate–competitive inhibitor of TPL2 kinase (50% inhibition/inhibitory concentration = 50 nM).
Real-time RT-PCR
Reverse transcription-polymerase chain reaction (RT-PCR) was performed using Applied Biosystems ViiA7 with accompanying software and Power SYBR Green (no. 4309155). Primer sequences are listed in the supplemental Methods. Relative expression was determined by ΔΔCt calculation. All RT-PCR protocols were performed in accordance with Minimum Information for Publication of Quantitative Real-Time PCR standards.
Mice, serum protein electrophoresis, murine tissue extraction, and processing
Animal work was performed under Institutional Animal Care and Use Committee–approved protocol M2395. All strains were in C57BL6/J background. Serum protein electrophoresis was performed on a Sebia Hydrasys system (Norcross, GA). BM cells were collected from spine and long bones by mortar/pestle disruption. BM mononuclear cells were collected following centrifugation on a Histopaque-1083 cushion (Sigma-Aldrich, St. Louis, MO). Mononuclear cells were labeled with biotinylated anti-CD115 antibody (AFS98) (eBioscience, San Diego, CA) followed by separation using anti-biotin Miltenyi microbeads (Miltenyi Biotec, Auburn, CA). The purity of the monocytic fraction was assessed by morphological analysis on cytospins; it routinely exceeded 90%.
Immunoblotting
Procedures and primary antibodies are listed in the supplemental Methods.
Immunohistochemistry
Flow cytometry
Flow cytometry procedures and antibodies are listed in the supplemental Methods.
Results
Monocytes/macrophages are dominant producers of inflammatory cytokines in the myeloma microenvironment at diagnosis
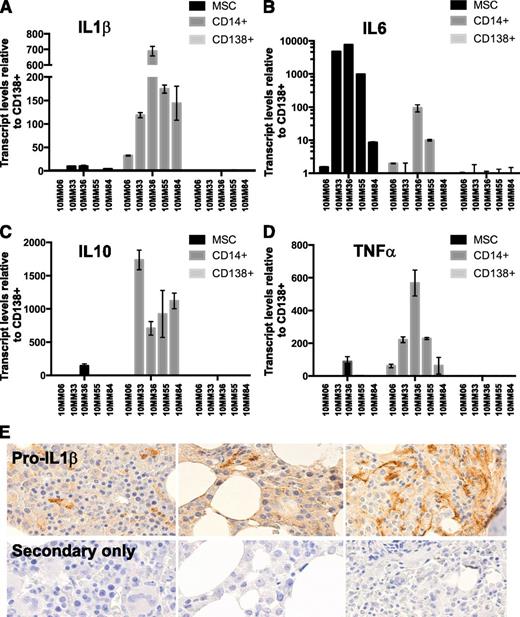
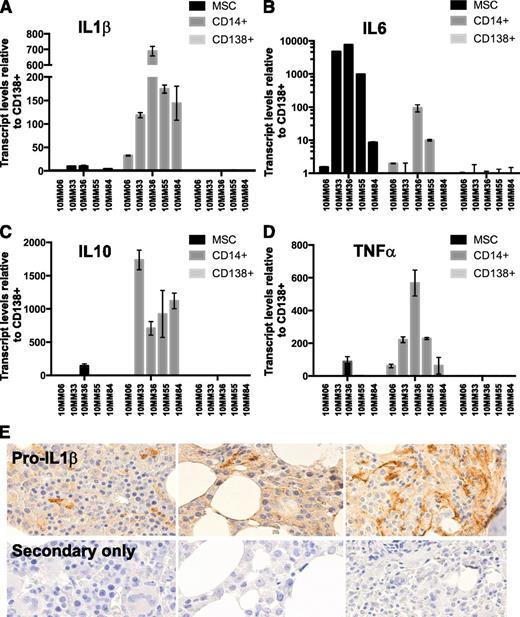
We have previously shown that monocytes/macrophages in the myeloma microenvironment operate an active transcriptional program that leads to robust transcription of inflammatory regulator cytokines, including IL-1β, IL-6, and IL-10.24 Induction of inflammatory cytokines in TLR-activated macrophages is achieved at the transcriptional and posttranscriptional levels.44-46 We sought to compare inflammatory cytokine transcript levels in monocytes/macrophages to stromal cells and to CD138+ tumor cells in myeloma BMs at diagnosis. BM aspirates were collected under informed consent from newly diagnosed patients (clinical details are given in supplemental Table 1). CD14+ (monocytic) and CD138+ (plasmacytic) fractions were isolated using immunomagnetic separation methods. The CD14−/CD138− fraction was subsequently cultured for 3 to 4 passages to derive BM MSCs.47 RNA was extracted from each fraction and subjected to quantitative RT-PCR using cytokine-specific primers. The results are shown in Figure 1A-D. Whereas IL-6 was predominantly produced by MSC and to a lesser extent by MAM, IL-1β, IL-10, and TNF-α were predominantly produced by MAM. Autocrine production by CD138+ cells was not dominant at diagnosis, although our results do not exclude the possibility that autocrine mechanisms become more significant upon disease progression. Because dissociation between IL-1β transcription and translation has been reported in certain contexts,48 we sought to confirm that the expressed message was indeed translated in the myeloma microenvironment. To this end, we used an antibody against IL-1β to stain multiple myeloma biopsies on a University of Wisconsin pathology myeloma TMA. The results are shown in Figure 1E. Pro-IL-1β protein (the precursor to secreted IL-1β) was detected in myeloma BM biopsies. The morphology of cells exhibiting the strongest staining appeared consistent with cells derived from the monocytic/macrophage lineage.
Macrophages are a dominant source of inflammatory cytokines in the myeloma microenvironment at diagnosis. The relative expression of RNA encoding myeloma-promoting inflammatory cytokines was compared among paired CD14+, CD138+, and MSC fractions (see supplemental data for clinical information). (A) IL-1β, (B) IL-6, (C) IL-10, and (D) TNF-α levels. (E) To confirm IL-1β message translation in the myeloma microenvironment, we stained a myeloma TMA with an antibody against (pro)IL-1β protein. (Pro)IL-1β staining was seen associated with cells of monocytic lineage morphology.
Macrophages are a dominant source of inflammatory cytokines in the myeloma microenvironment at diagnosis. The relative expression of RNA encoding myeloma-promoting inflammatory cytokines was compared among paired CD14+, CD138+, and MSC fractions (see supplemental data for clinical information). (A) IL-1β, (B) IL-6, (C) IL-10, and (D) TNF-α levels. (E) To confirm IL-1β message translation in the myeloma microenvironment, we stained a myeloma TMA with an antibody against (pro)IL-1β protein. (Pro)IL-1β staining was seen associated with cells of monocytic lineage morphology.
Coordinate regulation of TLR2 and TLR6 expression in MAM
Cytokine transcript analysis as shown in Figure 1 corroborated our previous conclusions that MAM undergo an inflammatory switch in the myeloma microenvironment.24 However, the stimuli leading to macrophage activation and the inflammatory switch remain unclear. Because TLR expression is dynamic and influenced by the composite milieu of pathogen-derived or endogenous molecular “patterns” as well as cytokines operating in different microenvironments,29 we hypothesized that analysis of TLR expression by MAM would provide insights into the nature of macrophage activation signals in the myeloma niche.
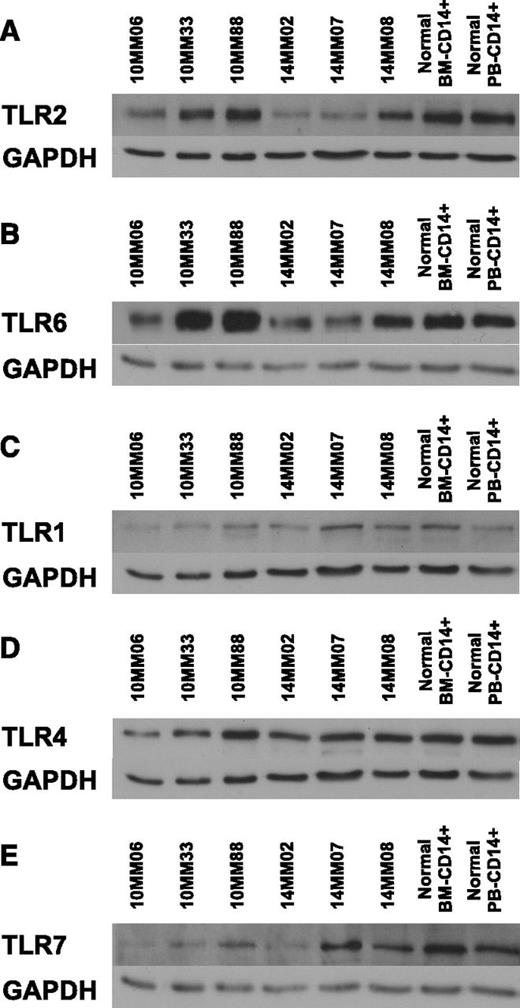
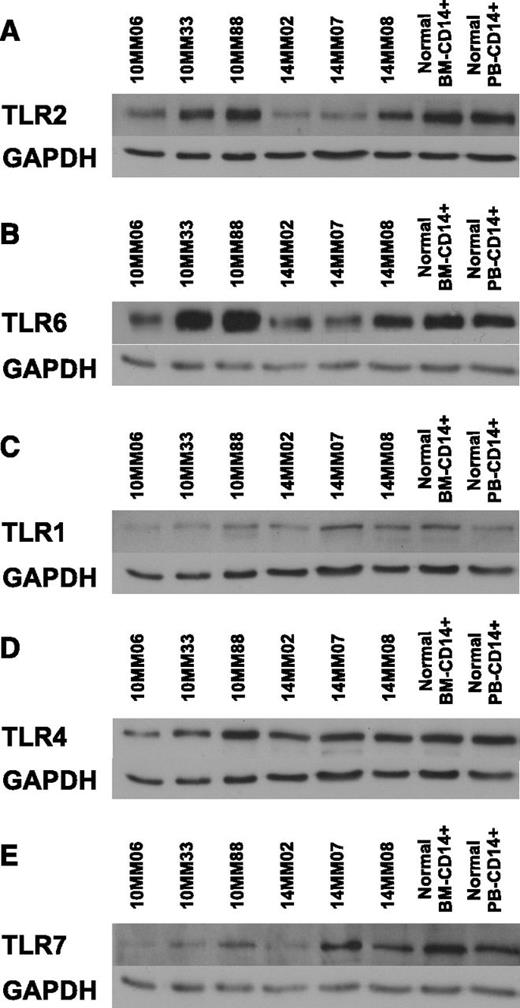
To identify the TLR expression pattern in MAM, we probed lysates of CD14+ cells obtained at diagnosis (supplemental Table 1) using a panel of anti-TLR antibodies. The results are shown in Figure 2. Interestingly, TLR2 protein levels were coordinately regulated with TLR6 levels but not TLR1 levels across patients. This observation is intriguing in view of the fact that TLR2 is active in obligate heterodimers with either TLR6 or TLR1.49 Moreover, TLR4 levels were not coregulated with TLR2 and appeared constant across patients and controls. Our results raise the possibility that TLR2/6 expression is coregulated, presumably to reflect the abundance of TLR2/6 ligands in the myeloma microenvironment.
Coregulation of TLR2 and TLR6 expression in MAMs. Lysates from CD14+ MAM obtained from BM aspirates at diagnosis were immunoblotted using a panel of antibodies against TLRs. Human primary BM-derived CD14+ cells and human primary peripheral blood (PB)-derived CD14+ cells served as controls. GAPDH provided a loading control. (A) TLR2/GAPDH. (B) TLR6/GAPDH. (C) TLR1/GAPDH. (D) TLR4/GAPDH. (E) TLR7/GAPDH. GAPDH, glyceraldehyde-3-phosphate dehydrogenase.
Coregulation of TLR2 and TLR6 expression in MAMs. Lysates from CD14+ MAM obtained from BM aspirates at diagnosis were immunoblotted using a panel of antibodies against TLRs. Human primary BM-derived CD14+ cells and human primary peripheral blood (PB)-derived CD14+ cells served as controls. GAPDH provided a loading control. (A) TLR2/GAPDH. (B) TLR6/GAPDH. (C) TLR1/GAPDH. (D) TLR4/GAPDH. (E) TLR7/GAPDH. GAPDH, glyceraldehyde-3-phosphate dehydrogenase.
Expression and processing of versican, a proteoglycan TLR2/6 agonist, in human myeloma
TLR2/6 heterodimers have been previously reported to contribute nonautonomously to carcinoma progression and metastasis through their interaction with versican, a large matrix proteoglycan.32,37,38,50,51 Our findings that the TLR2 coregulates with TLR6 in MAM led us to the hypothesis that versican may be the relevant TLR2/6 ligand in myeloma BM. However, there are no reports in the literature regarding the role, or even the presence, of versican in the myeloma microenvironment. To address this question, we stained normal lymphoid tissue biopsy samples, normal BM core biopsies, lymphoma biopsy samples, and myeloma marrow biopsy samples on lymphoma and myeloma TMAs (see the “Materials and methods” section) using 2 antibodies. First, we used an antibody against a neo-epitope arising from the regulated cleavage of versican by a disintegrin and metalloproteinase with thrombospondin motifs (ADAMTS) 1/4 metalloproteinases.52 The resultant versican cleavage products have been directly implicated in inflammation, cell growth regulation, and tissue remodeling.53-55 Interestingly, ADAMTS1 was recently reported to belong to a limited range of metalloproteinases upregulated by stromal cells in the myeloma microenvironment.56 Second, we stained TMA biopsies with an antibody against the hyaluronan-binding domain of versican (G1 domain). We found robust expression of cleaved versican in about 50% of myeloma cases, but not lymphoma or normal tissues (Figure 3; supplemental Table 2). The pattern of versican G1-staining mirrored the pattern of the cleaved product with mostly weak or absent staining in lymphoma and normal biopsies, but strong staining in about half of myeloma biopsies (see supplemental Table 3). Therefore, we report for the first time that versican is abundant and actively processed in myeloma BM and propose a role for versican in MAM activation through TLR2/6 agonist activity.
Versican expression in lymphoid malignancies and normal tissues. Tissue from a lymphoma and a myeloma TMA (see “Materials and methods”) was stained with antibodies recognizing a neo-epitope generated by cleavage of versican by ADAMTS1/4 (“cleaved versican”) and an antibody against the hyaluronan-binding domain of the versican protein core (“G1-domain”). Representative staining patters are shown for normal tissue (tonsils, lymph nodes [LN], BM), a panel of lymphomas (BL+: Burkitt lymphoma with a t(8;14), BL−: Burkitt lymphoma without a t(8;14)) and myeloma BM; FL, follicular lymphoma, MCL, mantle cell lymphoma, SLL, small lymphocytic lymphoma. Secondary-only and isotype staining controls are also shown. A summary of the TMA staining scores is provided as supplemental Tables 2 and 3.
Versican expression in lymphoid malignancies and normal tissues. Tissue from a lymphoma and a myeloma TMA (see “Materials and methods”) was stained with antibodies recognizing a neo-epitope generated by cleavage of versican by ADAMTS1/4 (“cleaved versican”) and an antibody against the hyaluronan-binding domain of the versican protein core (“G1-domain”). Representative staining patters are shown for normal tissue (tonsils, lymph nodes [LN], BM), a panel of lymphomas (BL+: Burkitt lymphoma with a t(8;14), BL−: Burkitt lymphoma without a t(8;14)) and myeloma BM; FL, follicular lymphoma, MCL, mantle cell lymphoma, SLL, small lymphocytic lymphoma. Secondary-only and isotype staining controls are also shown. A summary of the TMA staining scores is provided as supplemental Tables 2 and 3.
TPL2, a “druggable” MAP3Kinase downstream of TLRs, controls myeloma progression in vivo
Although versican and TLR2/6 may provide valuable therapeutic targets, we reasoned that the MAP3Kinase TPL2 (Cot/MAP3K8) would perhaps prove the most attractive and readily accessible (“druggable”) signaling node downstream of versican-TLR2/6 in myeloma. TPL2 is a serine/threonine MAP3K linking the MAP kinase and NF-κB pathways in inflammation and cancer and a critical mediator of TLR-mediated signals in activated macrophages.39,40 TPL2 activity has been shown to be required for transcriptional activation of the IL-1β locus by macrophages responding to Listeria (a microbe whose pathogen-associated patterns activate TLR2).57 To test the hypothesis that TPL2 is essential for MAM activation and myeloma progression, we crossed Tpl2−/− animals41 to the genetically engineered myeloma model, Vκ*MYC.58,59 Following its initial discovery as an oncogene,60 Tpl2 has been shown to variably act as a tumor promoter or suppressor gene in various models of solid tumors,61-71 but its effects on hematopoietic malignancies have not been vigorously addressed in relevant in vivo models.
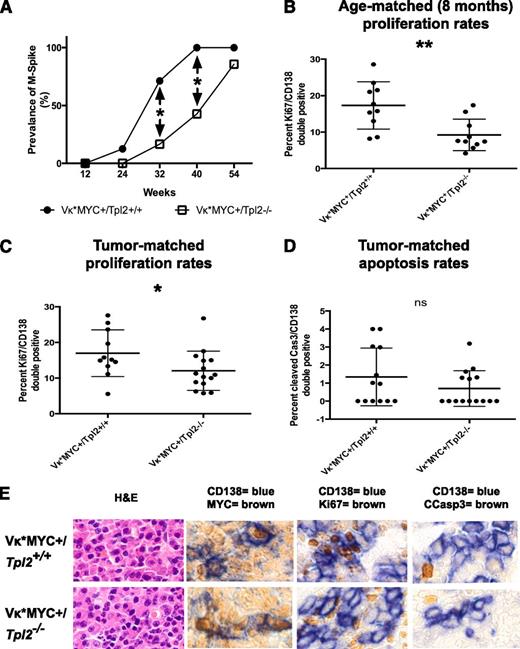
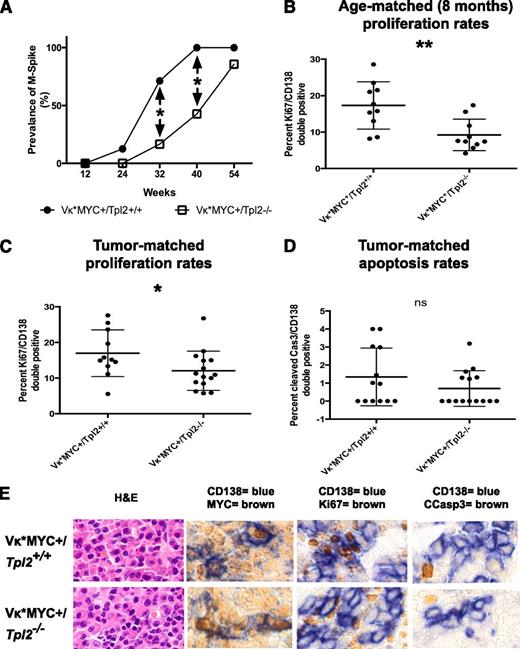
Vκ*MYC animals activate MYC sporadically in B cells undergoing somatic hypermutation in germinal centers because MYC is preceded by an engineered translational stop codon prone to mutational reversion by the enzyme activation-induced deaminase.59 Vκ*MYC animals develop an indolent myeloma heralded by the appearance of monoclonal gammopathy (M-spike) before 12 months of age. The median time to development of a monoclonal gammopathy in the control Vκ*MYC+/Tpl2+/+ group was 28 weeks in our colony. Tpl2 ablation in Vκ*MYC animals resulted in a delayed appearance of monoclonal gammopathy with a median to gammopathy extended to 42 weeks (Figure 4A, differences in prevalence at 32 and 40 weeks are significant at P < .05). It is important to note that, by 40 weeks, Vκ*MYC+/Tpl2+/+ animals have already entered a plateau with nearly 100% prevalence of monoclonal serum spikes.
Tpl2 loss prolongs latency and reduces the plasma cell proliferative fraction in Vκ*MYC mice. (A) Serial serum protein electrophoresis was used to detect monoclonal gammopathy in a cohort of Vκ*MYC/Tpl2−/− mice (14 animals) and compared with Vκ*MYC/Tpl2+/+ controls (14 animals). Prevalence of M-spikes over time (weeks) in each cohort is shown. The latency at 50% prevalence of monoclonal gammopathy in the control group is 28 weeks and in the Vκ*MYC/Tpl2−/− group is 42 weeks. Cohort sizes were powered (power = 80%) to detect the differences seen at 32 and 40 weeks with a *P < .05. (A) The plasma cell proliferative fraction (CD138+/Ki67+ double-positive cells) was counted against total CD138+ cells by immunohistochemistry, as shown in panel E. Counts were performed in >30 total CD138+ cells from each of >5 high-power fields from 2 mice in each group (at least 150 CD138+ cells per mouse). P values: *<.05, **<.01, ***< .001, ns, nonsignificant. (C) Calculation of the proliferative fraction of CD138+ cells was performed as delineated in panel B, but from 3 animals in each genotype with equivalent M-spikes (tumor-matched). P values: *<.05, **<.01, ***<.001. (D) Apoptotic rates were calculated as the rate of cleaved caspase 3+/CD138+ double-positive cells over total CD138+ cells in tumor-matched mice. Counts were performed in >30 total CD138+ cells from each of >5 high-power fields from 3 mice in each group (at least 150 CD138+ cells per mouse). P values: *<.05, **<.01, ***<.001. (E) Immunohistochemical analysis of the MYC expression, proliferative fraction (Ki67+), apoptotic fraction (cleaved caspase 3+) in CD138+ plasma cells from each genotype as shown (tumor-matched mice). Hematoxylin-eosin (H&E) staining is provided for morphological comparison.
Tpl2 loss prolongs latency and reduces the plasma cell proliferative fraction in Vκ*MYC mice. (A) Serial serum protein electrophoresis was used to detect monoclonal gammopathy in a cohort of Vκ*MYC/Tpl2−/− mice (14 animals) and compared with Vκ*MYC/Tpl2+/+ controls (14 animals). Prevalence of M-spikes over time (weeks) in each cohort is shown. The latency at 50% prevalence of monoclonal gammopathy in the control group is 28 weeks and in the Vκ*MYC/Tpl2−/− group is 42 weeks. Cohort sizes were powered (power = 80%) to detect the differences seen at 32 and 40 weeks with a *P < .05. (A) The plasma cell proliferative fraction (CD138+/Ki67+ double-positive cells) was counted against total CD138+ cells by immunohistochemistry, as shown in panel E. Counts were performed in >30 total CD138+ cells from each of >5 high-power fields from 2 mice in each group (at least 150 CD138+ cells per mouse). P values: *<.05, **<.01, ***< .001, ns, nonsignificant. (C) Calculation of the proliferative fraction of CD138+ cells was performed as delineated in panel B, but from 3 animals in each genotype with equivalent M-spikes (tumor-matched). P values: *<.05, **<.01, ***<.001. (D) Apoptotic rates were calculated as the rate of cleaved caspase 3+/CD138+ double-positive cells over total CD138+ cells in tumor-matched mice. Counts were performed in >30 total CD138+ cells from each of >5 high-power fields from 3 mice in each group (at least 150 CD138+ cells per mouse). P values: *<.05, **<.01, ***<.001. (E) Immunohistochemical analysis of the MYC expression, proliferative fraction (Ki67+), apoptotic fraction (cleaved caspase 3+) in CD138+ plasma cells from each genotype as shown (tumor-matched mice). Hematoxylin-eosin (H&E) staining is provided for morphological comparison.
To determine the mechanisms responsible for the observed delay in the onset of monoclonal gammopathy, we measured proliferation rates of CD138+ plasma cells at 8 months of age. At this age, the prevalence of monoclonal gammopathy between cohorts is already significant. As shown in Figure 4B-C, Ki67+ positivity was significantly lower in the CD138+ fraction in Vκ*MYC+/Tpl2−/− animals than Vκ*MYC+/Tpl2+/+ controls. This result was reminiscent of the reduction in the tumor cell proliferative compartment seen after anti–IL-1β therapy in human indolent myeloma.72
This growth defect persisted even when we compared Ki67+ rates in CD138+ cells from tumor-matched Vκ*MYC+/Tpl2−/− and Vκ*MYC+/Tpl2+/+ control animals. “Tumor-matched” denotes animals from each genotype with overt tumor in which the serum M-spikes were of comparable intensity. Equivalent serum M-spikes denoted comparable tumor burdens between cohorts. The growth fraction in CD138+ cells in the Vκ*MYC+/Tpl2−/− group was significantly lower than in their Vκ*MYC+/Tpl2+/+ tumor-matched counterparts (Figure 4C). By contrast, the rates of apoptosis (cleaved caspase 3 positivity) in CD138+ cells from tumor-matched animals were low and not significantly different between the 2 genotypes (Figure 4D).
Last, we examined the possibility that the lower proliferation rates in plasma cells from Vκ*MYC+/Tpl2−/− tumors may be attributable to the defective activation of MYC in the absence of Tpl2. To investigate this possibility, we costained BM from Vκ*MYC+/Tpl2−/− and control Vκ*MYC+/Tpl2+/+ animals for MYC and CD138. There was no evidence of defective MYC activation in Vκ*MYC+/Tpl2−/−tumors (Figure 4E). These results are consistent with previous reports showing that Tpl2−/− animals are capable of forming normal germinal centers, a condition for MYC activation in the Vκ*MYC model.41
Tpl2 controls the inflammatory switch in MAM
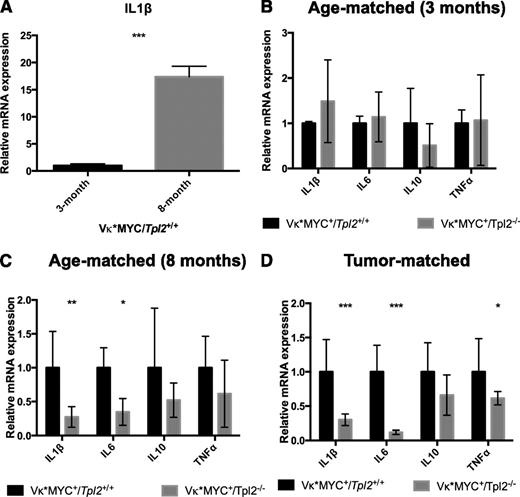
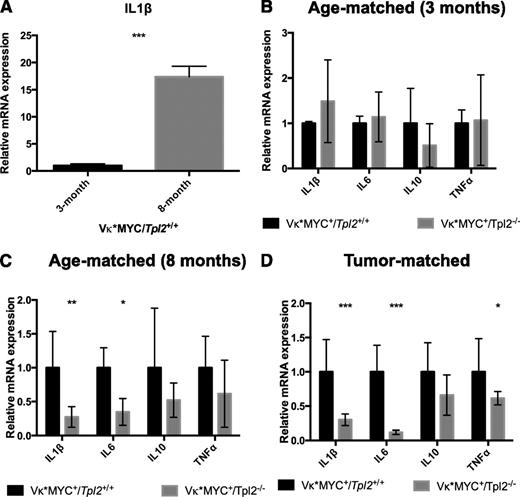
At 3 months of age, control Vκ*MYC animals do not show any evidence of a measurable clonal plasma cell tumor (0 incidence of M-spikes; Figure 4A). BM-derived CD115+ monocytic cells73 from Vκ*MYC+ animals at that age express low IL-1β transcripts (Figure 5A). We have previously shown that IL-1β transcription constitutes a key hallmark of the inflammatory switch in human MAM.24 By 8 months of age, most Vκ*MYC mice have M-spikes. At that age, their CD115+ monocytic fraction expressed IL-1β robustly (Figure 5A). Therefore, monocytic cells in Vκ*MYC animals at 8 months have undergone an inflammatory switch associated with tumor progression.
Tpl2−/− monocytes/macrophages display defective inflammatory switch in the myeloma microenvironment. BM aspirates from Vκ*MYC/Tpl2+/+ or Vκ*MYC/Tpl2−/− animals were collected, and monocytic-lineage cells were isolated by CD115+ immunomagnetic separation. Complementary DNA subjected to quantitative RT-PCR using primers recognizing various cytokines as indicated. (A) CD115+ cells from 3-month-old Vκ*MYC mice (0 incidence of M-spikes) do not transcribe appreciable amounts of IL-1β message. By 8 months, most Vκ*MYC mice have developed M-spikes. CD115+ cells at 8 months transcribe high levels of IL-1β message, demonstrating an inflammatory switch equivalent to the induction of inflammatory mediators reported by our group in human MAM.24 (B) At 3 months of age, Vκ*MYC mice lack monoclonal gammopathy (0 incidence of M-spikes, see Figure 4A). IL-1β message is transcribed at the same low rates regardless of Tpl2 status. (C) By 8 months of age, CD115+ from Vκ*MYC/Tpl2+/+ mice have undergone inflammatory switch, characterized by increased IL-1β production. However, CD115+ cells from Vκ*MYC/Tpl2−/− mice display severe defects in IL-1β and IL-6 production. (D) The defect in inflammatory cytokine production by Tpl2−/− MAM persists even in overt tumor (tumor-matched mice bearing equivalent M-spikes). P values: *<.05, **<.01, ***<.001. mRNA, messenger RNA.
Tpl2−/− monocytes/macrophages display defective inflammatory switch in the myeloma microenvironment. BM aspirates from Vκ*MYC/Tpl2+/+ or Vκ*MYC/Tpl2−/− animals were collected, and monocytic-lineage cells were isolated by CD115+ immunomagnetic separation. Complementary DNA subjected to quantitative RT-PCR using primers recognizing various cytokines as indicated. (A) CD115+ cells from 3-month-old Vκ*MYC mice (0 incidence of M-spikes) do not transcribe appreciable amounts of IL-1β message. By 8 months, most Vκ*MYC mice have developed M-spikes. CD115+ cells at 8 months transcribe high levels of IL-1β message, demonstrating an inflammatory switch equivalent to the induction of inflammatory mediators reported by our group in human MAM.24 (B) At 3 months of age, Vκ*MYC mice lack monoclonal gammopathy (0 incidence of M-spikes, see Figure 4A). IL-1β message is transcribed at the same low rates regardless of Tpl2 status. (C) By 8 months of age, CD115+ from Vκ*MYC/Tpl2+/+ mice have undergone inflammatory switch, characterized by increased IL-1β production. However, CD115+ cells from Vκ*MYC/Tpl2−/− mice display severe defects in IL-1β and IL-6 production. (D) The defect in inflammatory cytokine production by Tpl2−/− MAM persists even in overt tumor (tumor-matched mice bearing equivalent M-spikes). P values: *<.05, **<.01, ***<.001. mRNA, messenger RNA.
When we compared Vκ*MYC+/Tpl2−/− animals to Vκ*MYC+/Tpl2+/+ controls, we found that, at 3 months, both Vκ*MYC+/Tpl2−/− and control Vκ*MYC+/Tpl2+/+ animals exhibited similar (and low) rates of IL-1β transcription (Figure 5B). However, by 8 months, monocytic cells from Vκ*MYC+/Tpl2−/− animals display a severe defect in inflammatory cytokine transcription (Figure 5C). Whereas IL-1β and IL-6 are both significantly affected, other inflammatory cytokines show a similar trend (that does not, however, reach statistical significance). This defect in Vκ*MYC+/Tpl2−/− monocytes persists even in tumor-matched animals, despite the fact that tumor-matched Vκ*MYC+/Tpl2−/− animals are of significantly older age than their tumor-matched control Vκ*MYC+/Tpl2+/+ counterparts (Figure 5D). It is possible that additional mutations and/or autocrine mechanisms reduce the dependence of Vκ*MYC+/Tpl2−/− tumor cells at the tumor-matched stage on cytokine support emanating from the microenvironment. These results show that, similar to human myeloma, MAM in Vκ*MYC mice undergo an inflammatory switch to promote myeloma progression, a transcriptional program controlled by the actions of Tpl2 kinase in vivo.
Tpl2 loss modulates MAM polarization in a tumor stage–specific manner
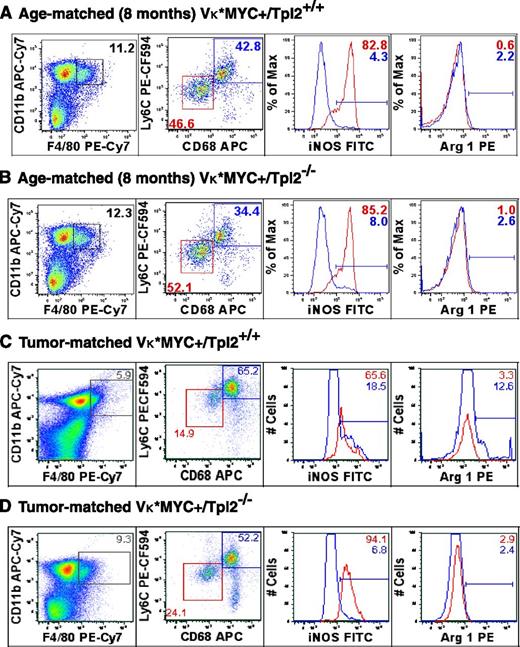
We questioned whether Tpl2 loss may act through repolarization of MAM to an unopposed cytotoxic/tumoricidal phenotype.74,75 We have previously described the constellation of M2-polarization with robust IL-6 production (“MSC-educated macrophages”).27 To define the polarization state of MAM in the context of Tpl2 loss, we analyzed BM cells from Vκ*MYC+/Tpl2+/+ control and Vκ*MYC+/Tpl2−/− animals at 8 weeks as well as tumor-matched stage with a panel of markers compatible with M1 and M2 polarization, as shown in Figure 6. For this analysis, we chose time points based on the fact that at 8 months and tumor-matched animals, the effects of Tpl2 loss on MAM activation were already detectable at the level of cytokine production.
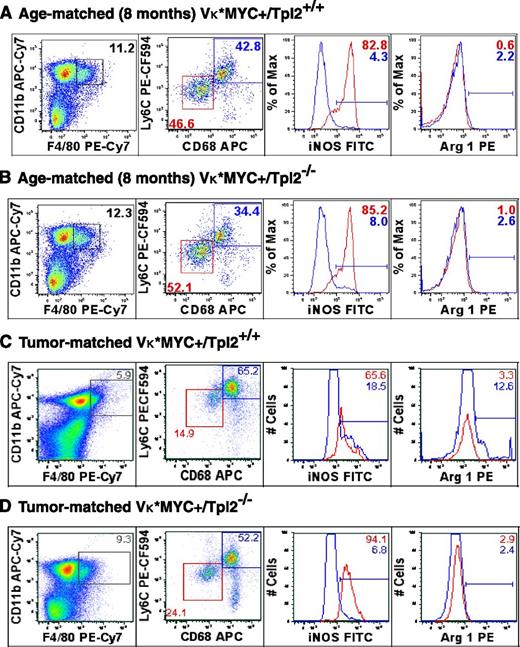
Tumor stage-specific macrophage repolarization in the myeloma niche in the absence of Tpl2. Macrophage polarization was assessed using flow cytometric analysis of C11b+/F4/80+ macrophages from BMs of age-matched (8-month old) and “tumor matched” wild-type (Vκ*MYC/Tpl2+/+) and Vκ*MYC/Tpl2−/− animals. Representative results from 3 animals in each group are shown. The C11b+/F4/80+ gate is shown to the left. The dot plots represent the frequency of the M1-like fraction (CD68int/Ly6Cint) and M2-like fraction (CD68hi/Ly6Chi) in the total C11b+/F4/80+ gate in each genotype. M1 polarization has been shown to result in downregulation of CD68 in macrophages.76 On the right panels, histograms depict the relative frequency of iNOS+ and Arginase-1+ cells in each subpopulation, depicted in RED (M1-like) and BLUE (M2-like). APC, allophycocyanin; FITC, fluorescein isothiocyanate; PE, phycoerythrin.
Tumor stage-specific macrophage repolarization in the myeloma niche in the absence of Tpl2. Macrophage polarization was assessed using flow cytometric analysis of C11b+/F4/80+ macrophages from BMs of age-matched (8-month old) and “tumor matched” wild-type (Vκ*MYC/Tpl2+/+) and Vκ*MYC/Tpl2−/− animals. Representative results from 3 animals in each group are shown. The C11b+/F4/80+ gate is shown to the left. The dot plots represent the frequency of the M1-like fraction (CD68int/Ly6Cint) and M2-like fraction (CD68hi/Ly6Chi) in the total C11b+/F4/80+ gate in each genotype. M1 polarization has been shown to result in downregulation of CD68 in macrophages.76 On the right panels, histograms depict the relative frequency of iNOS+ and Arginase-1+ cells in each subpopulation, depicted in RED (M1-like) and BLUE (M2-like). APC, allophycocyanin; FITC, fluorescein isothiocyanate; PE, phycoerythrin.
At 8 months of age, the relative proportion of CD11b+/F4/80+ cells (macrophages) was comparable in BM from either genotype. CD11b+/F4/80+ cells further segregated into a CD68int/Ly6Cint population with robust expression of inducible nitric oxide synthase (iNOS; Figure 6, M1-like, red box) and CD68hi/Ly6Chi population (M2-like, blue box). Notably, M1 polarization has been shown to result in downregulation of CD68 in macrophages.76 We analyzed the percentage of iNOS+ cells (a marker of M1 polarization) and Arginase-1+ (Arg1+) cells (a marker of M2 polarization) in each subpopulation. The percentage of iNOS+ cells and Arg-1+ cells was similar in each fraction from either genotype at 8 months.
However, later in the course of the disease (tumor-matched stage), we observed both quantitative and qualitative differences between the 2 genotypes. The presence of tumor in wild-type animals resulted in a relative decrease in the frequency of M1-like, CD68int/Ly6Cint macrophages and a relative increase in the frequency of M2-like, CD68hi/Ly6Chi macrophages (Figure 6A,C, M1, red box; M2, blue box). Within each subpopulation, the distribution of iNOS and Arg1+ cells was striking, with a decrease in the iNOS/Arg1 ratio in both subpopulations compared with 8 months, denoting a shift toward M2-polarization upon tumor progression (iNOS/Arg ratios: M1: 82.8/0.6 at 8 months, 65.6/3.3 in tumor-matched; M2: 4.3/2.2 at 8 months, 18.5/12.6 in tumor-matched). Tpl2 ablation partially abrogated the M2-polarized transition and/or licensed repolarization of tumor-associated macrophages toward the M1 (iNOS+) phenotype. This M1-repolarization effect is striking if one considers the concomitant increase in frequency of M1-like, CD68int/Ly6Cint macrophages (24.1 vs 14.9) and higher iNOS content within that subpopulation (94.1 vs 65.6).
Therefore, we observed an expansion of M1-polarized macrophages and a corresponding decrease in M2-macrophages in Tpl2−/− myeloma tumors. These results provide in vivo validation for prior in vitro observations, suggesting that Tpl2 promotes the M2 phenotype.75,77 Moreover, our findings would be mechanistically compatible with the concept that inhibitor of nuclear factor κ-B kinase subunit β (IKK-β)–regulated pathways promote M2 polarization.78-83 IKK-β kinase activity is essential for TPL2 phosphorylation and activation in the context of NF-κB pathway signaling.39,40
Pharmacologic TPL2 inhibition blocks IL-1β induction in human monocytes stimulated by TLR2 agonists
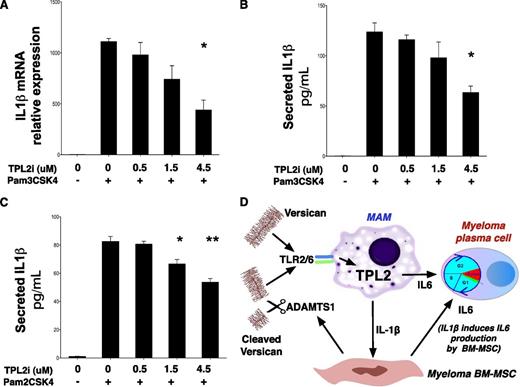
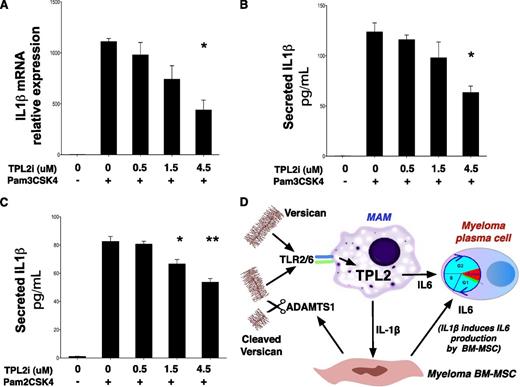
Whereas original work showed a critical role for TPL2 in cytokine induction downstream of TLR4 stimulation,41 the mechanisms leading to TPL2 activation downstream of TLR2 signaling have not been studied in detail, particularly in human cells. To establish a role for TPL2 in IL-1β induction downstream of TLR2 in human monocytes, we stimulated THP-1 cells with lipoproteins Pam3CSK4 and Pam2CSK4 that activate TLR2 heterodimers with TLR1 and TLR6, respectively. TLR2-mediated stimulation of THP-1 cells led to a strong induction of IL-1β transcript, an effect attenuated after pharmacologic TPL2 inhibition in a dose-dependent manner (Figure 7A). Moreover, TPL2 inhibitor attenuated mature IL-1β secretion by THP-1 cells after stimulation by Pam3CSK4 (Figure 7B) and, importantly, Pam2CSK4, a selective TLR2/6 agonist (Figure 7C).
TPL2 regulates IL-1β production in response to TLR2 stimulation in human monocytes. (A) Pharmacologic TPL2 inhibition results in a dose-dependent decrease of IL-1β transcription in response to TLR2 stimulation of human monocytes. THP-1 cells were stimulated with a TLR2 agonist, Pam3CSK4, for 3 hours with or without pretreatment with a TPL2 kinase inhibitor as shown. RNA was extracted and subjected to RT-PCR using IL-1β–specific primers. Pam3CSK4 is thought to act predominantly through TLR2/TLR1 heterodimers, whereas a related lipopeptide, Pam2CSK4, acts through TLR2/6 heterodimers. Pharmacologic TPL2 inhibition resulted in dose-dependent decrease of mature IL-1β secretion into culture supernatants after stimulation by either Pam3CSK4 (B) or Pam2CSK4 (C). P values: *<.05, **<.01, ***<.001. Tpl2i, Tpl2 inhibitor. (D) Diagram summarizing the central role of the versican-TLR2/6-TPL2 pathway in regulating the inflammatory milieu of the myeloma niche. TLR2/6 heterodimers on MAM recognize versican cleaved by ADAMTS1 and/or unprocessed versican. Versican-induced TLR2/6 signaling activates TPL2 kinase and is essential for IL-1β and IL-6 induction in the myeloma niche.
TPL2 regulates IL-1β production in response to TLR2 stimulation in human monocytes. (A) Pharmacologic TPL2 inhibition results in a dose-dependent decrease of IL-1β transcription in response to TLR2 stimulation of human monocytes. THP-1 cells were stimulated with a TLR2 agonist, Pam3CSK4, for 3 hours with or without pretreatment with a TPL2 kinase inhibitor as shown. RNA was extracted and subjected to RT-PCR using IL-1β–specific primers. Pam3CSK4 is thought to act predominantly through TLR2/TLR1 heterodimers, whereas a related lipopeptide, Pam2CSK4, acts through TLR2/6 heterodimers. Pharmacologic TPL2 inhibition resulted in dose-dependent decrease of mature IL-1β secretion into culture supernatants after stimulation by either Pam3CSK4 (B) or Pam2CSK4 (C). P values: *<.05, **<.01, ***<.001. Tpl2i, Tpl2 inhibitor. (D) Diagram summarizing the central role of the versican-TLR2/6-TPL2 pathway in regulating the inflammatory milieu of the myeloma niche. TLR2/6 heterodimers on MAM recognize versican cleaved by ADAMTS1 and/or unprocessed versican. Versican-induced TLR2/6 signaling activates TPL2 kinase and is essential for IL-1β and IL-6 induction in the myeloma niche.
Discussion
Myeloma is characterized by significant intra- and interpatient genetic and clonal heterogeneity that creates challenges for targeted therapy and personalized medicine. Several recent reports using cutting-edge sequencing technologies, and copy-number genomic analyses have shown that multiple competing subclones are present at diagnosis and therapy often results in clonal selection and “clonal tides.” 1,3-6,84 Therefore the paradigm of chronic myeloid leukemia, a cancer in which targeted therapy against a single, early, clonal mutation (BCR-ABL) suffices to induce meaningful remissions may not be applicable in myeloma and other cancers.85,86 Even as novel therapies have revolutionized the myeloma treatment landscape over the past 10 years, myeloma remains incurable20,87-89 and optimal treatment strategies for early and indolent disease remain uncertain.7 Attention is therefore shifting to therapeutic modulation of the microenvironment, aiming to achieve tumor control (and potentially, cures) without regard to the genetic composition of myeloma cells.
Myeloma cells are uniformly dependent on cytokine support at all stages of their natural history. Chief among the cytokines necessary for myeloma tumor homeostasis is IL-6. Plasma levels of IL-6 in myeloma patients correlate with disease burden and have prognostic significance.90 Widespread ectopic expression of IL-6 in mice leads to plasma cell hyperplasia with eventual development of plasma cell tumors.91 Therapy with an IL-6 antibody in conjunction with corticosteroids led to meaningful responses in a challenging group of patients with multidrug-resistant myeloma.92 Although myeloma cells may elaborate autocrine IL-6 in late- and drug-resistant stages of disease, our data show that autocrine mechanisms are less significant earlier in the natural history. Whereas marrow stromal cells and osteoblasts have been shown to produce IL-6 in myeloma,21,93 macrophages have received little attention in this regard. It is interesting to note that in other cancers with a significant inflammatory component, such as colorectal cancer and liver cancer, tissue-resident macrophages (lamina propria macrophages and Kupffer cells, respectively), are recognized as major local IL-6 producers.94 Conversely, the most common cancer associated with Gaucher disease, a primary macrophage storage disorder characterized by chronic macrophage activation and overproduction of IL-6 by macrophages, is myeloma.95,96
Myeloma stromal cells produce IL-6 in response to IL-1β.97,98 This seminal observation has guided clinical research incorporating a recombinant form of the natural IL-1β antagonist, IL-1RA (anakinra), in the treatment of indolent myeloma. Anakinra controlled the proliferative fraction of myeloma cells and prolonged the chronic phase of the disease in several patients, thus providing clinical validation for the concept that blocking the actions of IL-1β is effective in halting progression of indolent myeloma.72
Previous work from our laboratory has shown that monocytes/macrophages in the myeloma microenvironment undergo an inflammatory switch leading to production of IL-1β and IL-6, among other inflammation-regulatory cytokines.24 These data provoked several questions. First, are macrophages dominant cytokine producers in the myeloma microenvironment? Second, what are the signals leading to MAM activation?
To answer the first question, we compared transcript levels for key inflammatory cytokines in paired purified cell preparations from BM aspirates obtained at diagnosis. Autocrine cytokine production was not found to be dominant at diagnosis. Rather, MAM appeared very active in production of all inflammatory cytokines including IL-6, a cytokine chiefly produced by stromal cells. The results corroborated a model in which MAM-derived IL-1β, in turn stimulated IL-6 secretion by MSC.
To formulate informed hypotheses regarding the identity of the stimuli leading to MAM activation, we analyzed the pattern of TLR expression by MAM. Our analysis led to the finding that TLR2 and TLR6 expression were coordinately regulated in MAM suggesting that TLR2/6 heterodimers respond to a cognate ligand present in the myeloma microenvironment. Interestingly, TLR2 is expressed poorly by myeloma plasma cells.99
Versican, a large matrix proteoglycan, has been linked to carcinoma metastasis through TLR2/6-mediated macrophage activation and inflammatory cytokine production. However, versican has not been previously studied in myeloma pathogenesis. Versican is variably expressed by carcinoma cells or their microenvironment and has been implicated, in addition to metastasis, in the direct regulation of cell proliferation, apoptosis, angiogenesis.36-38 Versican is processed by ADAMTS-group metalloproteinases to yield cleavage products that have been implicated directly in generation of a pro- inflammatory microenvironment as well as cancer progression.51 Interestingly, ADAMTS1 was recently reported to be overexpressed by myeloma MSC56 and ADAMTS1 deletion in the breast cancer model PyMT-attenuated tumor progression and metastasis.100 ADAMTS1, versican, and TLR2 may prove to be valuable primary therapeutic targets in myeloma.
However, we reasoned that the MAP3K, TPL2, might be the most accessible target in the pathway downstream of TLR2 activation by versican.23 To obtain proof-of-principle, we ablated Tpl2 in the versatile Vκ*MYC myeloma model.59 This genetic manipulation sufficed to abrogate the inflammatory switch in MAM and caused a decrease in the plasma cell proliferative rate. In established tumors, Tpl2 loss promoted macrophage repolarization toward the M1 phenotype, consistent with the notion that IKK-β–dependent pathways promote M2 macrophage polarization in tumors.82,83 M1-repolarization together with a defect in inflammatory cytokine production represents the reverse of “MSC-educated” macrophage polarization,27 and is reminiscent of similar effects on tumor-associated macrophages by histidine-rich glycoprotein.101 The loss of inflammatory cytokines, through its antiangiogenic effect, cooperated therapeutically with M1-repolarization.
Our results delineate a novel pathway acting nonautonomously to promote myeloma progression (Figure 7D). We propose that pharmacologic TPL2 inhibition holds superb promise in the control of indolent myeloma for 4 reasons. First, TPL2 activity controls not only IL-1β, but also IL-6 production, at least by macrophages. Second, anti-cytokine therapy through a small-molecule approach may be more efficacious and clinically useful than a protein–drug approach because of the convenient route of administration (oral vs parenteral), the lower risk of development of neutralizing antibodies as well as the lower risk of infusion-related reactions. Third, TPL2 inhibition may have significant cell-autonomous effects on myeloma development23 ; we are in the process of dissecting cell-autonomous TPL2 mechanisms in appropriate in vivo systems. Fourth, TPL2 inhibition may have an enhanced safety profile because Tpl2 ablation is compatible with normal hematopoiesis.41 TPL2 inhibitors are currently in advanced pharmaceutical development 27 ; therefore, their promise is tangible. We propose TPL2 kinase inhibition as an effective therapy against indolent myeloma.
The online version of this article contains a data supplement.
The publication costs of this article were defrayed in part by page charge payment. Therefore, and solely to indicate this fact, this article is hereby marked “advertisement” in accordance with 18 USC section 1734.
Acknowledgments
The authors thank the laboratories of Drs Emery Bresnick and Lixin Rui (University of Wisconsin Carbone Cancer Center) for help with experiments and equipment.
This work was supported by a Brian D. Novis grant by the International Myeloma Foundation (F.A.); a Kirschstein National Research Service Award (T32HL007899-Hematology in Training-Principle Investigator: John Sheehan) (C.H.); a training grant from National Human Genome Research Institute (T32HG002760) (S.O.); a grant from the Wisconsin Alumni Research Foundation through the University of Wisconsin (UW) Graduate School and a TL1 trainee award from the Clinical and Translational Science Awards program, previously through the National Center for Research Resources grant 1UL1RR025011, and now by the National Center for Advancing Translational Sciences, grant 9U54TR000021 (Principal Investigator, Marc Drezner) (J.L.J.); the UW Carbone Cancer Center Trillium Fund for Multiple Myeloma Research; the UW Department of Medicine; the UW Carbone Cancer Center (Core Grant P30 CA014520); and the UW-Madison School of Medicine and Public Health.
Authorship
Contribution: C.H., S.O., E. Heninger, E. Hebron, and J.L.J. performed experiments; J.K. and E. Hebron performed patient sample preparations; N.C. provided patient samples and clinical data; I.M., S.M., C.L., D.T.Y., P.H., M.C., and P.L.B. provided crucial reagents and/or advice on study design; and F.A. was responsible overall for study design and wrote the manuscript.
Conflict-of-interest disclosure: The authors declare no competing financial interests.
Correspondence: Fotis Asimakopoulos, 1111 Highland Ave, WIMR 4031, Madison, WI 53705; e-mail: fasimako@medicine.wisc.edu.

![Figure 3. Versican expression in lymphoid malignancies and normal tissues. Tissue from a lymphoma and a myeloma TMA (see “Materials and methods”) was stained with antibodies recognizing a neo-epitope generated by cleavage of versican by ADAMTS1/4 (“cleaved versican”) and an antibody against the hyaluronan-binding domain of the versican protein core (“G1-domain”). Representative staining patters are shown for normal tissue (tonsils, lymph nodes [LN], BM), a panel of lymphomas (BL+: Burkitt lymphoma with a t(8;14), BL−: Burkitt lymphoma without a t(8;14)) and myeloma BM; FL, follicular lymphoma, MCL, mantle cell lymphoma, SLL, small lymphocytic lymphoma. Secondary-only and isotype staining controls are also shown. A summary of the TMA staining scores is provided as supplemental Tables 2 and 3.](https://ash.silverchair-cdn.com/ash/content_public/journal/blood/123/21/10.1182_blood-2014-02-554071/4/m_3305f3.jpeg?Expires=1769133712&Signature=GfnFQrA4qYi4CSaN1n2qpKuW7MJVvlhAEEuwN2aPENArEuRb9aiPN-NymFSNMjzLKb0Dv4c9iVx-oJ8PEn3NctfsXQVsP7wylvuyxkVB9n6kXQqFmcLYtunbnHJXg~SY~mGEo9QWbC6TFGhbpsYpSGj7wOvIkTdjpxHtFQISRKOmbzVu7fkc7NCtHAMyXAHRStr~K6uwKxs6miTe65l5O6-IFQJ~aWY2JinzD5GkMNFuiinLJAIJCeAW9y9OLShQw1Nd-i6pHz0k53Y2XyZokQBlmFeEFe~L9IkBJvHjcqwfdzPBHDRfQq0FxmMz9OlBJw2giWbSw~QXGnfziTML1w__&Key-Pair-Id=APKAIE5G5CRDK6RD3PGA)

![Figure 3. Versican expression in lymphoid malignancies and normal tissues. Tissue from a lymphoma and a myeloma TMA (see “Materials and methods”) was stained with antibodies recognizing a neo-epitope generated by cleavage of versican by ADAMTS1/4 (“cleaved versican”) and an antibody against the hyaluronan-binding domain of the versican protein core (“G1-domain”). Representative staining patters are shown for normal tissue (tonsils, lymph nodes [LN], BM), a panel of lymphomas (BL+: Burkitt lymphoma with a t(8;14), BL−: Burkitt lymphoma without a t(8;14)) and myeloma BM; FL, follicular lymphoma, MCL, mantle cell lymphoma, SLL, small lymphocytic lymphoma. Secondary-only and isotype staining controls are also shown. A summary of the TMA staining scores is provided as supplemental Tables 2 and 3.](https://ash.silverchair-cdn.com/ash/content_public/journal/blood/123/21/10.1182_blood-2014-02-554071/4/m_3305f3.jpeg?Expires=1769133713&Signature=Q7vmAY7bl~Qhuq0~uzlxpSfvseWsP38wmhlxRte3UFTaGp4IBsn8ZrmCnpvVER23NtIFNDXnMQuT~tFStWnVg4XQMr8p4dxNfuZknXawWexVGSEXdEENp7V~i8MtgOtXgUt1un1~k3otz6dfzcBl2Wf8nRjVcN804MZ0hKa7UwR2hmZma9FjmtswA~MNl6OqGxRqULMDDQcnQhvedeQANQiVK450DMQlIiUPMVGbkdANv-Kk1FOVhRLjWrYLrl~Y3rIsfedQ79aHmQotT~n1Runpuhj93ubFYnZpCA1UXEExFeY4jLxLwW3SRTbGKD0Mipa2AKE9cVmQ63CUvRgVaA__&Key-Pair-Id=APKAIE5G5CRDK6RD3PGA)
