Key Points
The core autophagy protein ATG4B is highly expressed in CML stem/progenitor cells and may be useful in predicting treatment response.
ATG4B knockdown reduces autophagy, impairs the survival of CML stem/progenitor cells, and sensitizes them to IM treatment.
Abstract
Previous studies demonstrated that imatinib mesylate (IM) induces autophagy in chronic myeloid leukemia (CML) and that this process is critical to cell survival upon therapy. However, it is not known if the autophagic process differs at basal levels between CML patients and healthy individuals and if pretreatment CML cells harbor unique autophagy characteristics that could predict patients’ clinical outcomes. We now demonstrate that several key autophagy genes are differentially expressed in CD34+ hematopoietic stem/progenitor cells, with the highest transcript levels detected for ATG4B, and that the transcript and protein expression levels of ATG4 family members, ATG5 and BECLIN-1 are significantly increased in CD34+ cells from chronic-phase CML patients (P < .05). Importantly, ATG4B is differentially expressed in pretreatment CML stem/progenitor cells from subsequent IM responders vs IM nonresponders (P < .05). Knockdown of ATG4B suppresses autophagy, impairs the survival of CML stem/progenitor cells and sensitizes them to IM treatment. Moreover, deregulated expression of ATG4B in CD34+ CML cells inversely correlates with transcript levels of miR-34a, and ATG4B is shown to be a direct target of miR-34a. This study identifies ATG4B as a potential biomarker for predicting therapeutic response in treatment-naïve CML stem/progenitor cells and uncovers ATG4B as a possible drug target in these cells.
Introduction
Imatinib mesylate (IM) and other ABL tyrosine kinase inhibitors (TKIs) have had a major impact on the treatment of chronic-phase (CP) chronic myeloid leukemia (CML).1-3 The second-generation TKIs dasatinib (DA) and nilotinib (NL) demonstrate increased potency and inhibit most imatinib mesylate (IM)-resistant mutants except T315I.2-5 The third-generation TKIs ponatinib and DCC-2036 have been developed to specifically target the T315 gatekeeper mutation.6,7 However, these TKI monotherapies are not curative, because BCR-ABL transcripts are still detectable in most patients with complete molecular remission once IM treatment is discontinued.8,9 Initial and acquired resistance to TKIs, as well as relapse, remain a challenge.10,11 Extensive investigations have revealed that primary CML stem cells and their progenitors are not effectively targeted by TKIs and hence, constitute a critical population of cells in setbacks upon IM discontinuation and in generating IM-resistant clones.8,12-18 Currently, there is no promising predictive test to identify patients who are unlikely to benefit from TKI monotherapy. Moreover, it has been demonstrated that CML stem cells are not dependent on BCR-ABL tyrosine kinase activity for their survival.19,20 Improved treatments, such as combination therapy targeting multiple survival pathways simultaneously, are highly warranted. One critical pathway that has been shown to play an important role in cancer, including CML, is macroautophagy (autophagy).21,22
Autophagy is a highly conserved, organized catabolic process that enables cells to recycle proteins and cytoplasmic organelles to release nutrients during periods of cell stress or starvation to counteract cell death.23 The process begins with initiation of double-membrane vesicles called autophagosomes that fuse with lysosomes to form autolysosomes where the engulfed content is degraded via lysosomal proteases.24,25 Each step involves numerous autophagy-related (ATG) genes and their protein products that regulate formation and maturation of the autophagosome. BECLIN-1 is part of a phosphatidylinositol 3-kinase complex that initiates the formation of the isolation membrane of the autophagosome, and ATG4 and ATG5 contribute to the elongation phase.26-28 A major event in autophagy is the proteolytic cleavage of cytoplasmic promicrotubule-associated protein 1 light chain 3 (LC3) to generate LC3-I with an exposed critical internal glycine residue that enables the conjugation to phosphatidylethanolamine, generating membrane-bound LC3-II. Proteolytic cleavage is also required to subsequently delipidate LC3-II to LC3-I.29 These key steps are catalyzed by the cysteine protease ATG4 and are necessary for membrane closure and removal/recycling of LC3 from the autophagosomal membrane.29,30 More recent studies suggest that the delipidation function of yeast Atg4 is important for recycling of Atg8 (LC3) to enable efficient autophagosome biogenesis.31,32 Mammals express 4 different ATG4 paralogs (ATG4A, ATG4B, ATG4C, and ATG4D), with ATG4B being crucial for the autophagic process and having the broadest substrate spectrum for different LC3 forms and homologs.33-37
Although autophagy is a well-studied process that takes place at basal levels in most mammalian cells, its roles in the regulation of hematopoiesis and pathogenesis of leukemia have yet to be fully explored. Recently, it was reported that autophagy can be induced upon IM treatment in CML cell lines and primary patient samples and that the process could be partially impaired by knockdown of ATG5 or ATG7.38-41 Moreover, a combination of TKI with the broad-spectrum autophagy inhibitor chloroquine (CQ) was more effective than single agents in impairing growth of primitive CML cells in vitro.22,38 These results suggest that autophagy may play a role in the response of primitive CML cells to TKIs, but how this process is regulated and the molecular basis for these observations in primitive CML cells are largely unknown. We hypothesized that treatment-naïve CML stem/progenitor cells harbor a unique autophagy gene expression profile that could be predictive of patient response to TKI therapy. Here, we report that CD34+ CML stem and progenitor cells express increased levels of several key autophagy genes; in particular, ATG4B is differentially expressed in pretreatment CML stem/progenitor cells, correlating with subsequent clinical response to IM therapy. Knockdown of ATG4B expression significantly reduces cell viability and inhibits proliferation of primary CD34+ CML cells while leading to an accumulation of LC3-II and p62, an indication of impaired autophagy. This is the first report investigating differences in autophagy gene and protein expression in CD34+ CML subpopulations from IM responders vs IM nonresponders.
Methods
Patients
A total of 28 CP CML patients, none of whom had been treated previously with TKIs, were studied. Subsequent IM responders (n = 14) achieved complete hematologic remission within 3 months, major cytogenetic remission within 12 months, and complete cytogenetic remission within 18 months, based on the European Leukemia Net treatment guidelines.42,43 Conversely, IM nonresponders (n = 14) did not achieve these response criteria or had evidence of loss of response later. BCR-ABL mutations were not detectable in blood samples from these IM nonresponders.
Human cells
Heparin-anticoagulated peripheral blood or bone marrow cells were obtained from newly diagnosed patients prior to TKI therapy and from healthy adult donors. Informed consent was obtained in accordance with the Declaration of Helsinki, and the procedures used were approved by the research ethics board at the University of British Columbia. Mononuclear cells were isolated using Ficoll-Hypaque (Sigma-Aldrich) density gradient separation, and CD34+ cells (>85%) were enriched immunomagnetically using the EasySep CD34-positive selection kit (STEMCELL Technologies). Purity was verified by restaining isolated cells with an allophycocyanin-labeled anti-CD34 antibody (BD Biosciences) and analyzing on a fluorescence-activated cell sorter (FACS).
Suspension cultures
CD34+ cells were cultured in Iscove’s medium plus bovine serum albumin (BSA), insulin, transferrin (STEMCELL Technologies), and 10−4 M 2-mercaptoethanol (Sigma-Aldrich), plus or minus growth factors (20 ng/mL interleukin-3, 20 ng/mL interleukin-6, 100 ng/mL Flt3 ligand, and 20 ng/mL granulocyte colony-stimulating factor [G-CSF]), plus or minus TKI inhibitors. K562 cells were maintained in RPMI 1640 media (STEMCELL Technologies) with 10% fetal bovine serum (Sigma-Aldrich) as described elsewhere.12,13 IM and NL were obtained from Novartis (Basel, Switzerland) and DA from Bristol-Myers Squibb. Stock solutions of 10 mM were prepared with water (IM) or dimethylsulfoxide (DMSO; DA and NL) and stored at −20°C.
Fluorescence-activated cell sorting
Peripheral blood or bone marrow samples were suspended in Hank’s buffer with 2% fetal bovine serum and stained for 30 minutes at 4°C with anti-human CD38-phycoerythrin (STEMCELL Technologies) and CD34-allophycocyanin (BD Biosciences) antibodies. CD34 subpopulations were sorted by FACS as described previously.13 To measure autophagic flux, a Cyto-ID autophagy detection kit (Enzo Life Sciences) was used. Briefly, cells were harvested after treatment, washed and stained for 30 minutes with Cyto-ID dye on ice, and analyzed by FACS.
RNA extraction and quantitative real-time PCR
Total RNA was extracted with TRIzol (Life Technologies).44 Glycogen (Life Technologies) was added as a carrier to facilitate visibility of the RNA pellet. RNA was dissolved in RNase-free water (Life Technologies) and the concentration determined with a Nanodrop instrument (Thermo Scientific). Quantitative real-time polymerase chain reaction (PCR) was then performed as previously described45 ; additional details are available in supplemental Methods and supplemental Table 1, available on the Blood Web site.
Western blotting analysis
CD34+ cells (150 000) and K562 cells were lysed in protein solubilization buffer and analyzed by western blotting as previously described.13,46 Antibodies used were anti-human ATG4B (Abcam), ATG4D (Abcam), anti-ATG5 (Novus Biologicals), anti-human p62 (Sigma-Aldrich), anti-LC3B (LC3B D11 XP; Cell Signaling), anti-BECLIN-1 (Santa Cruz Biotechnology), and anti-β-actin (Sigma-Aldrich).
Lentiviral shRNA- and siRNA-mediated knockdown of ATG4B in CML cells
Lentiviral small hairpin RNA (shRNA)- and small interfering RNA (siRNA)-mediated knockdown of ATG4B in K562 and CD34+ CML cells using MISSION shRNA constructs (Sigma-Aldrich) and FlexiTube ATG4B siRNA GeneSolution (Qiagen) is described in supplemental Methods.
CFC and LTC-IC assays
Colony-forming cell (CFC) and long-term culture–initiating cell (LTC-IC) assays were performed as previously described46,47 with transduced cells that had been selected with puromycin for 2 to 3 days. Briefly, 300 cells (cell lines) or 1000 CD34+ cells were mixed in 1 mL MethoCult (STEMCELL Technologies) with DMSO (0.05%), IM (0.5 μM, 2.5 μM, or 5 μM), and 2 μg/mL puromycin and plated and incubated for 12 to 14 days, followed by enumeration based on colony size (cell lines) or colony number (CML samples). LTC-IC assays were performed with transduced cells on mixed feeders (M2-10B4) engineered to produce human interleukin-3, G-CSF, and stem cell factor, with weekly half-medium changes. IM (5 μM) was added for the first 2 weeks only. Cells were then harvested, and ∼10 000 cells were plated for CFC assays as described previoulsy.46,47
Endogenous LC3B puncta staining and confocal microscopy
CD34+ CML cells (1-2 × 10⁵) were stained with primary LC3B and secondary antibodies, and imaging analysis was performed with a Leica SP5II Inverted LSCM confocal microscope as described in supplemental Methods.
Luciferase reporter assay and miRNA transfection
ATG4B 3′ untranslated region (UTR)/mutant and ATG4D 3′ UTR/mutant oligos (IDT; supplemental Table 3) were annealed and cloned into the dual-luciferase reporter vector pmirGLO (Promega). HEK-293T cells were transfected in 24-well plates using Attractene (Qiagen) in 3 replicates, according to the manufacturer’s protocol. The transfection mixtures contained 10 nM of microRNA (miRNA) mimics (Qiagen), 0.4 µg of reporter plasmid, and 1.5 µL of Attractene. Luciferase activity was measured 48 hours after transfection using a dual-luciferase reporter assay kit (Promega) and presented as firefly/Renilla ratio. Supplemental Table 3 shows 3′ UTR/mutant sequences of ATG4B and ATG4D. Transfection in K562 cells was done with 100 nM of miRNA mimics using 3 µL HiPerFect (Qiagen) for 48 hours prior to quantitative real-time PCR, western blot analysis, and CFC assays.
Statistical analysis
Results are shown as the mean ± standard error of values obtained in 2 to 3 independent experiments. Differences between groups were compared using a 2-tailed Student t test for unpaired samples with unequal variance or 1-way analysis of variance, with correction for multiple comparisons, using GraphPad Prism version 5 and 6 (GraphPad Software). P values < .05 were considered statistically significant. Means between groups were compared using the Welch 2-sample t test and Wilcoxon rank sum, with confirmation by receiver-operating characteristic analysis. Some experiments with statistically significant P values were selected for logistic regression analysis.
Results
Several differentially expressed autophagy genes identified in CD34+ CML cells
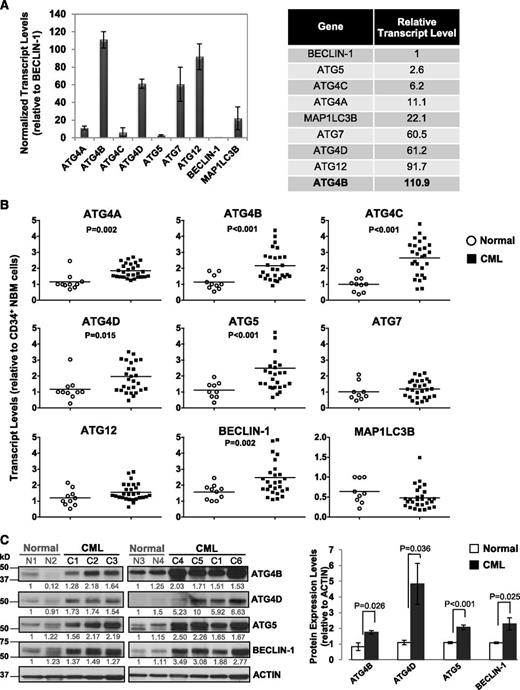
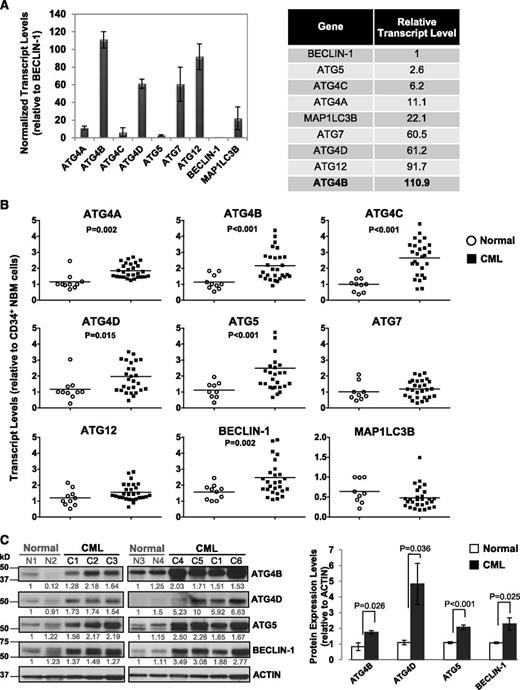
To determine transcript levels of ATG genes in primary CML cells and identify potential differences between stem/progenitor cells and normal bone marrow (NBM) cells, we assessed 9 key autophagy-related genes (ATG4A, ATG4B, ATG4C, ATG4D, ATG5, ATG7, ATG12, BECLIN-1, and MAP1LC3B) in CD34+ cells from 28 CP CML patients at diagnosis, prior to IM treatment, and in CD34+ cells from 10 healthy individuals, using quantitative real-time PCR (Figure 1A-B). Interestingly, in CD34+ NBM cells, these genes were expressed at varying levels, with relatively high expression of ATG4 family members, including ATG4B and ATG4D, ATG12 and ATG7 (>60-fold relative to BECLIN-1), and very low levels of BECLIN-1 and ATG5 (1- and 3-fold; Figure 1A). Importantly, CD34+ CML cells displayed significantly higher transcript levels of ATG4B and ATG4D, ATG5 and BECLIN-1 (n = 28, P < .02) compared with CD34+ NBM cells (n = 10, Figure 1B). Protein expression was also highly deregulated in CD34+ CML cells (n = 6) compared with normal controls (n = 4, P < .036; Figure 1C). Thus, basal levels of key autophagy genes are differentially expressed in normal hematopoietic stem/progenitor cells, and upregulation of some autophagy genes and proteins occurs in CD34+ CML cells.
Comparison of transcript and protein expression levels of 9 key ATG genes in CD34+ normal and CML cells. (A) Quantitative real-time PCR analysis of transcript levels of 9 key autophagy genes in CD34+ NBM cells isolated from healthy individuals normalized to β2-microglobulin (β2M) transcript levels. Relative transcript levels of these 9 ATG genes were then compared with BECLIN-1, which displayed the lowest mRNA expression levels. (B) Comparison of transcript levels of 9 ATG genes in CD34+ NBM cells (n = 10) and pretreatment CD34+ CML cells obtained from CP CML patients (n = 28). Each data point represents the average of a triplicate quantitative measurement of each transcript normalized to β2M and relative to CD34+ NBM cells. Bars represent the mean of data for each group, and significantly differentially expressed genes between normal and CML groups are indicated by P values. (C) Western blotting analysis of ATG4B, ATG4D, ATG5, and BECLIN-1 in CD34+ cells obtained from healthy individuals (n = 4) and CML patients (n = 6). Protein expression of these proteins relative to actin was compared. Values shown are the mean ± standard error of the mean (SEM) of measurements from healthy individuals and CML patients.
Comparison of transcript and protein expression levels of 9 key ATG genes in CD34+ normal and CML cells. (A) Quantitative real-time PCR analysis of transcript levels of 9 key autophagy genes in CD34+ NBM cells isolated from healthy individuals normalized to β2-microglobulin (β2M) transcript levels. Relative transcript levels of these 9 ATG genes were then compared with BECLIN-1, which displayed the lowest mRNA expression levels. (B) Comparison of transcript levels of 9 ATG genes in CD34+ NBM cells (n = 10) and pretreatment CD34+ CML cells obtained from CP CML patients (n = 28). Each data point represents the average of a triplicate quantitative measurement of each transcript normalized to β2M and relative to CD34+ NBM cells. Bars represent the mean of data for each group, and significantly differentially expressed genes between normal and CML groups are indicated by P values. (C) Western blotting analysis of ATG4B, ATG4D, ATG5, and BECLIN-1 in CD34+ cells obtained from healthy individuals (n = 4) and CML patients (n = 6). Protein expression of these proteins relative to actin was compared. Values shown are the mean ± standard error of the mean (SEM) of measurements from healthy individuals and CML patients.
The expression of ATG4B is significantly different in CD34+ CML cells from subsequent IM responders vs IM nonresponders
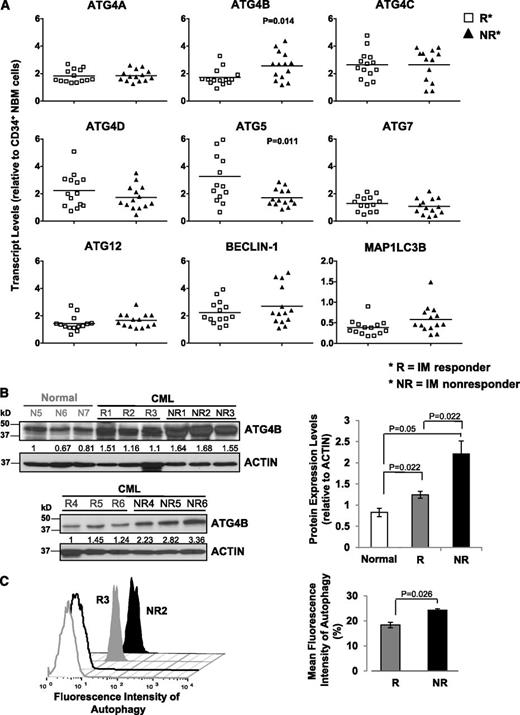
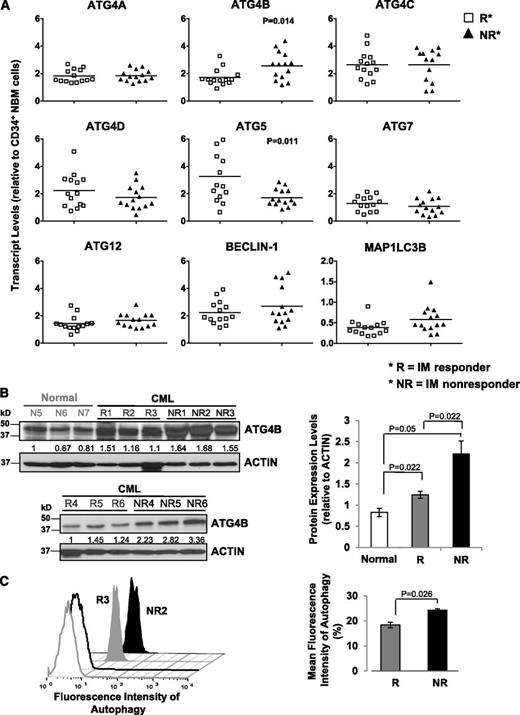
To characterize the ATG gene expression profile and determine whether expression changes could be predictive of patient response to TKI therapy, we divided patient samples obtained at diagnosis but retrospectively classified, after initiation of IM therapy, as IM responders (n = 14) and IM nonresponders (n = 14). Notably, transcript levels of ATG4B were significantly higher in CD34+ CML cells from subsequent IM nonresponders compared with IM responders (P = .014; Figure 2A), whereas ATG5 transcripts were lower (P = .011). CD34+ cells from a few IM nonresponders appeared to express relatively higher levels of BECLIN-1, but the differences overall were not significant. Western blot analysis further revealed that protein expression of ATG4B was significantly higher in CD34+ cells from IM nonresponders (n = 6) than IM responders (n = 6, P = .022; Figure 2B). Interestingly, intracellular staining with Cyto-ID dye revealed a significant difference between IM responders and IM nonresponders, with IM nonresponders displaying increased autophagy at basal levels. (P = .026; Figure 2C). Logistic regression model analysis further demonstrated that the clinically defined IM responders and IM nonresponders were significantly different from each other with respect to transcript levels of ATG4B, with a significant impact at the 5% level (Table 1).
Detection of significantly increased ATG4B transcript and protein expression in CD34+ CML cells from IM nonresponders vs IM responders. (A) Comparison of transcript levels of 9 ATG genes in CD34+ CML cells from IM responders (n = 14) and IM nonresponders (n = 14). Bars represent the mean of data for each group, and significantly differentially expressed genes between IM responders and IM nonresponders are indicated by P values. (B) Western blotting analysis of ATG4B in CD34+ cells obtained from healthy individuals (normal, n = 3), IM responders (R; n = 6), and IM nonresponders (NR; n = 6). Protein expression of ATG4B relative to actin was compared. Values shown are the mean ± SEM of measurements from healthy individuals, IM responders, and IM nonresponders. (C) Cyto-ID green detection dye in CD34+ cells from an IM responder (R3) and an IM nonresponder (NR2). Detection of the differences in mean fluorescence intensity of intracellular Cyto-ID green detection dye obtained from 3 IM responders vs 3 IM nonresponders (right). Values shown are the mean ± SEM of measurements from IM responders and IM nonresponders.
Detection of significantly increased ATG4B transcript and protein expression in CD34+ CML cells from IM nonresponders vs IM responders. (A) Comparison of transcript levels of 9 ATG genes in CD34+ CML cells from IM responders (n = 14) and IM nonresponders (n = 14). Bars represent the mean of data for each group, and significantly differentially expressed genes between IM responders and IM nonresponders are indicated by P values. (B) Western blotting analysis of ATG4B in CD34+ cells obtained from healthy individuals (normal, n = 3), IM responders (R; n = 6), and IM nonresponders (NR; n = 6). Protein expression of ATG4B relative to actin was compared. Values shown are the mean ± SEM of measurements from healthy individuals, IM responders, and IM nonresponders. (C) Cyto-ID green detection dye in CD34+ cells from an IM responder (R3) and an IM nonresponder (NR2). Detection of the differences in mean fluorescence intensity of intracellular Cyto-ID green detection dye obtained from 3 IM responders vs 3 IM nonresponders (right). Values shown are the mean ± SEM of measurements from IM responders and IM nonresponders.
Leukemic stem cells from IM nonresponders express higher levels of several ATG genes, including ATG4B, compared with IM responders
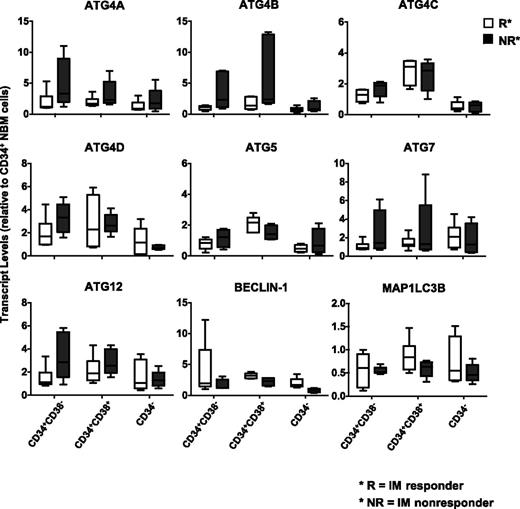
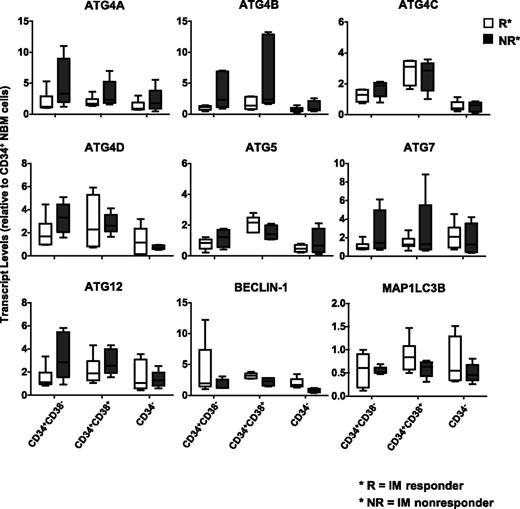
To assess whether CML subpopulations may differentially express key autophagy genes that regulate autophagy, CD34+CD38−, CD34+CD38+, and CD34− subpopulations from IM responders (n = 6) and IM nonresponders (n = 6) were FACS purified, and ATG gene expression was assessed (Figure 3). Interestingly, the stem cell–enriched population (CD34+CD38−) from IM nonresponders expressed higher levels of ATG4 family members, ATG5, ATG7, and ATG12 than the same cells from IM responders. Increased transcript levels of ATG4B were also observed in progenitor cells (CD34+CD38+) from IM nonresponders, whereas more mature cells (CD34−) expressed the lowest levels of the explored ATG genes (Figure 3). Thus, CML stem and progenitor cells express relatively higher levels of ATG genes than more mature cells, and leukemic stem cells from IM nonresponders express relatively higher levels of ATG4B.
Comparison of transcript levels of 9 ATG genes in CD34 subpopulations from subsequent IM responders and IM nonresponders. Comparison of transcript levels of 9 ATG genes in CD34 subpopulations, including the stem cell–enriched population (CD34+CD38−), progenitors (CD34+CD38+), and mature (CD34−) cells from IM responders (n = 6) and nonresponders (n = 6). Values shown are the mean ± SEM of measurements of each transcript normalized to β2M.
Comparison of transcript levels of 9 ATG genes in CD34 subpopulations from subsequent IM responders and IM nonresponders. Comparison of transcript levels of 9 ATG genes in CD34 subpopulations, including the stem cell–enriched population (CD34+CD38−), progenitors (CD34+CD38+), and mature (CD34−) cells from IM responders (n = 6) and nonresponders (n = 6). Values shown are the mean ± SEM of measurements of each transcript normalized to β2M.
Exposure to IM in vitro elevates mRNA and protein expression of ATG4B and induces autophagic flux in CD34+ CML cells
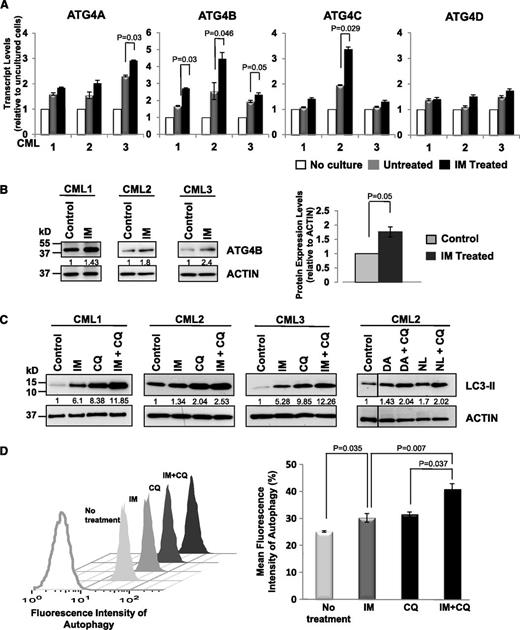
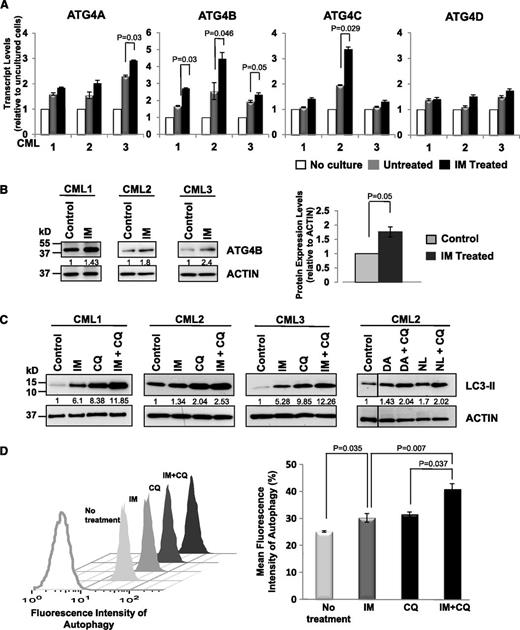
To explore whether expression of specific ATG genes changes upon inhibition of BCR-ABL tyrosine kinase activity, we compared expression changes in several genes (ATG4 family members, ATG5, ATG7, ATG12, BECLIN-1, and MAP1LC3B) in CD34+ cells isolated from CML patient samples (n = 3) after 6 and 24 hours of IM treatment (5 µM). Transcript levels of all examined genes increased in cultured CML cells after 24 hours with or without IM, indicating that expression of most autophagy genes is induced in vitro. Significantly, messenger RNA (mRNA) and protein expression levels of ATG4B increased in CD34+ cells upon IM treatment in all 3 patient samples examined within 6 hours compared with the same cells cultured without IM (Figure 4A-B; P ≤ .05), whereas other ATG genes did not (data not shown). Consistent with previous reports,22,38 IM treatment induced autophagy in CD34+ CML cells from CML patient samples (n = 3), as evidenced by elevated LC3-II levels, which is further enhanced upon IM and CQ combination treatment (∼2-fold; Figure 4C). LC3-II levels also increased with DA or NL alone or in combination with CQ (Figure 4C). These results were further supported by the detection of increased autophagic flux in the same cells by intracellular FACS analysis (P < .037; Figure 4D).
Enhanced expression of ATG4B and induced autophagic flux in CD34+ CML cells upon IM treatment. (A) Quantitative real-time PCR analysis of transcript levels of ATG4 family members in CD34+ CML cells from 3 patient samples in the presence and absence of IM (5 µM) after in vitro incubation of cells for 6 hours. Values shown are the mean ± SEM of triplicate measurements of each transcript normalized to β2M and relative to uncultured CD34+ cells. (B) Western blotting analysis of ATG4B protein expression in the same cells upon IM treatment in vitro. Protein expression of ATG4B relative to actin was compared. Values shown are the mean ± SEM of measurements. (C) Western blotting analysis of LC3-II levels in CD34+ CML cells from 3 patient samples treated with IM (5 µM), DA, (150 nM), NL (5 µM), CQ (10 µM), or TKI + CQ for 5 hours. LC3 antibody used preferentially recognized LC3-II. Protein expression of LC3-II relative to actin was compared, and relative levels of LC3-II protein expression in treated cells compared with control cells (no treatment) are shown. (D) A representative sample of the FACS profiles of intracellular Cyto-ID green detection dye in CD34+ CML cells in the presence or absence of IM (5 µM), CQ (10 µM), or IM + CQ for 5 hours (left). Detection of the differences in mean fluorescence intensity of intracellular Cyto-ID green detection dye obtained from IM nonresponders in the presence or absence of indicated inhibitors (n = 4, right). The increase in fluorescence intensity in the IM + CQ–treated samples relative to IM or CQ treatment is indicative of autophagic flux. Values shown are the mean ± SEM of measurements from 4 CML patient samples.
Enhanced expression of ATG4B and induced autophagic flux in CD34+ CML cells upon IM treatment. (A) Quantitative real-time PCR analysis of transcript levels of ATG4 family members in CD34+ CML cells from 3 patient samples in the presence and absence of IM (5 µM) after in vitro incubation of cells for 6 hours. Values shown are the mean ± SEM of triplicate measurements of each transcript normalized to β2M and relative to uncultured CD34+ cells. (B) Western blotting analysis of ATG4B protein expression in the same cells upon IM treatment in vitro. Protein expression of ATG4B relative to actin was compared. Values shown are the mean ± SEM of measurements. (C) Western blotting analysis of LC3-II levels in CD34+ CML cells from 3 patient samples treated with IM (5 µM), DA, (150 nM), NL (5 µM), CQ (10 µM), or TKI + CQ for 5 hours. LC3 antibody used preferentially recognized LC3-II. Protein expression of LC3-II relative to actin was compared, and relative levels of LC3-II protein expression in treated cells compared with control cells (no treatment) are shown. (D) A representative sample of the FACS profiles of intracellular Cyto-ID green detection dye in CD34+ CML cells in the presence or absence of IM (5 µM), CQ (10 µM), or IM + CQ for 5 hours (left). Detection of the differences in mean fluorescence intensity of intracellular Cyto-ID green detection dye obtained from IM nonresponders in the presence or absence of indicated inhibitors (n = 4, right). The increase in fluorescence intensity in the IM + CQ–treated samples relative to IM or CQ treatment is indicative of autophagic flux. Values shown are the mean ± SEM of measurements from 4 CML patient samples.
Upregulated ATG4B transcript levels in CD34+ CML cells inversely correlate with expression of miR-34a, and ATG4B is a target of miR-34a
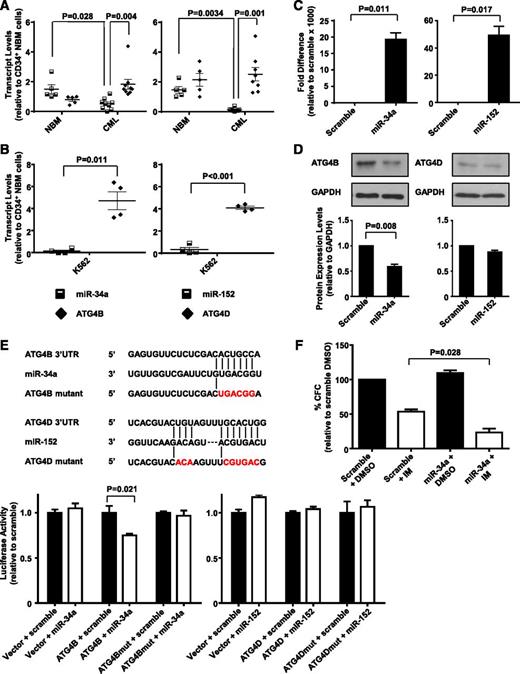
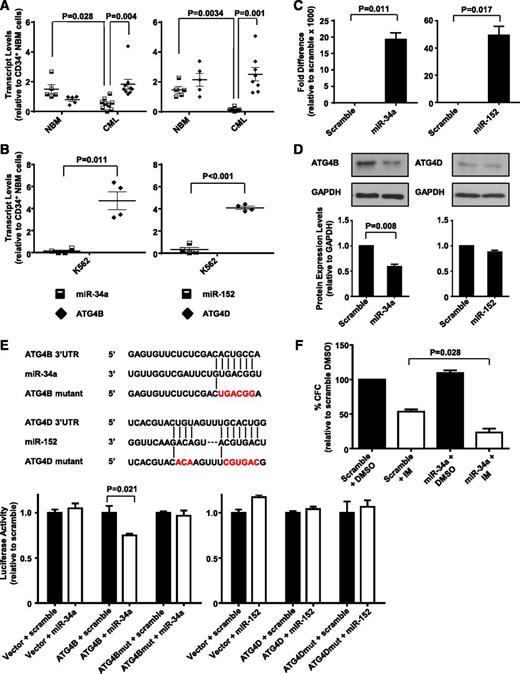
Transcript and protein levels of genes can be regulated by many mechanisms, one being the inhibition of translation or degradation of an mRNA product by miRNAs.48 We recently identified several differentially expressed miRNAs in CD34+ CML cells by miRNA sequence profiling (H.L. and X.J., unpublished data), including miR-34a and miR-152, which are predicted to target ATG4B and ATG4D, respectively (by algorithm software miBase, miRanda, PicTar, and TargetScan). We therefore analyzed expression levels of miR-34a and miR-152 in CD34+ NBM and CML cells from CML patients at diagnosis. Significantly lower levels of miR-34a and miR-152 were observed in CD34+ CML cells (n = 8) relative to CD34+ NBM cells (n = 5) (P = .028 and .003; Figure 5A). Interestingly, higher expression of miR-34a correlated to lower ATG4B transcript levels in NBM cells, whereas CML cells with significantly lower transcript levels of miR-34a had higher expression of ATG4B (P = .004). Similarly, significantly reduced miR-152 transcript levels correlated with high expression of ATG4D in CML cells (P = .001). Similar correlations were observed in K562 cells where low miRNA transcript levels correlated to higher expression of ATG4B and ATG4D (P = .011 and P < .001; Figure 5B). We then examined whether miR-34a and miR-152 target ATG4B and ATG4D directly. Forced expression of miR-34a significantly reduced ATG4B protein levels (45%, P = .008), whereas forced expression of miR-152 had no effect on ATG4D protein levels in K562 cells (Figure 5C-D). Following this, ATG4B and ATG4D wild-type or mutant 3′ UTR, containing miRNA binding sites, were cloned into a luciferase reporter construct (Figure 5E, top). Luciferase assays showed that transfection of miR-34a caused a moderate reduction (∼25%, P = .021) in luciferase activity in HEK-293T cells cotransfected with ATG4B wild-type construct, but not in cells cotransfected with a mutant construct. MiR-152, on the other hand, did not affect luciferase activity in cells cotransfected with either wild-type or a mutant construct (Figure 5E, bottom). We then assessed whether miR-34a–mediated ATG4B knockdown would contribute to IM-induced inhibition of cell proliferation and observed a 2-fold decrease in CFC numbers in miR-34a transfected cells compared with control cells upon IM treatment (P = .028, Figure 5F). These results support ATG4B as a functional target of miR-34a in CML cells, with forced expression of miR-34a further sensitizing these cells to IM treatment.
MiR-34a and miR-152 expression inversely correlate with ATG4B and ATG4D transcript levels in CD34+ CML cells, and ATG4B is a target of miR-34a. (A) Quantitative real-time PCR analysis of transcript levels of miR-34a, miR-152, ATG4B, and ATG4D in CD34+ NBM isolated from healthy individuals (n = 5) and CD34+ cells from CML patients (n = 8). Each data point represents the average of a triplicate quantitative measurement of each transcript normalized to β2M or RNU48. (B) Comparison of transcript levels of the same miRNAs and ATG genes in K562 cells. Each data point represents 4 quantitative measurements of each transcript normalized to β2M or RNU48. Cross bars represent the mean ± SEM of data for each group. (C) Quantitative real-time PCR validation of increased miR-34a and miR-152 expression levels 48 hours after transient transfection of miRNA mimics into K562 cells. (D) Western blot analysis of protein expression of ATG4B and ATG4D in miR-34a and miR-152 transfected K562 cells and scramble controls. Protein expression of ATG4B and ATG4D relative to GAPDH was compared. (E) Schematic representation (top) of ATG4B 3′ UTR and ATG4D 3′ UTR sequences containing potential miR-34a and miR-152 binding sites. The positions of mutations generated are marked in red. Luciferase assay (bottom) of the reporter vector containing ATG4B or ATG4D binding sites and their corresponding mutations 48 hours after transient cotransfection into HEK-293T cells with miRNA mimics. (F) K562 cells were transfected with miR-34a mimic and scramble control and CFC assays were performed in the presence of 0.5 µM IM or DMSO (control). Values represent the mean ± SEM of measurements from 3 independent experiments.
MiR-34a and miR-152 expression inversely correlate with ATG4B and ATG4D transcript levels in CD34+ CML cells, and ATG4B is a target of miR-34a. (A) Quantitative real-time PCR analysis of transcript levels of miR-34a, miR-152, ATG4B, and ATG4D in CD34+ NBM isolated from healthy individuals (n = 5) and CD34+ cells from CML patients (n = 8). Each data point represents the average of a triplicate quantitative measurement of each transcript normalized to β2M or RNU48. (B) Comparison of transcript levels of the same miRNAs and ATG genes in K562 cells. Each data point represents 4 quantitative measurements of each transcript normalized to β2M or RNU48. Cross bars represent the mean ± SEM of data for each group. (C) Quantitative real-time PCR validation of increased miR-34a and miR-152 expression levels 48 hours after transient transfection of miRNA mimics into K562 cells. (D) Western blot analysis of protein expression of ATG4B and ATG4D in miR-34a and miR-152 transfected K562 cells and scramble controls. Protein expression of ATG4B and ATG4D relative to GAPDH was compared. (E) Schematic representation (top) of ATG4B 3′ UTR and ATG4D 3′ UTR sequences containing potential miR-34a and miR-152 binding sites. The positions of mutations generated are marked in red. Luciferase assay (bottom) of the reporter vector containing ATG4B or ATG4D binding sites and their corresponding mutations 48 hours after transient cotransfection into HEK-293T cells with miRNA mimics. (F) K562 cells were transfected with miR-34a mimic and scramble control and CFC assays were performed in the presence of 0.5 µM IM or DMSO (control). Values represent the mean ± SEM of measurements from 3 independent experiments.
Knockdown of ATG4B impairs autophagy, affects the survival of CML stem/progenitor cells, and sensitizes these cells to IM
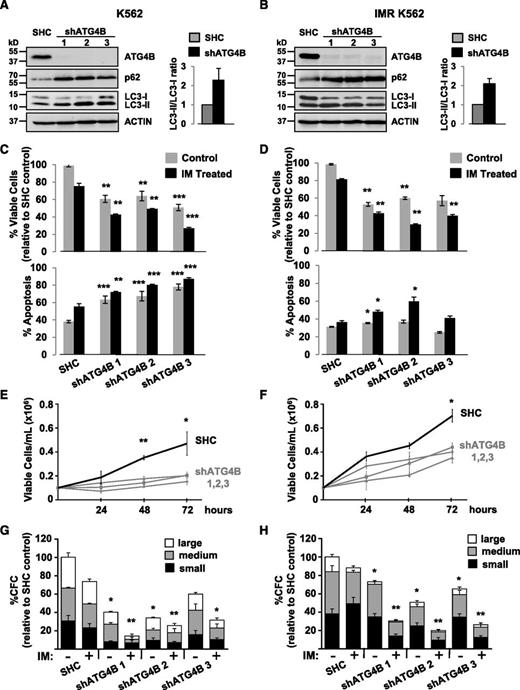
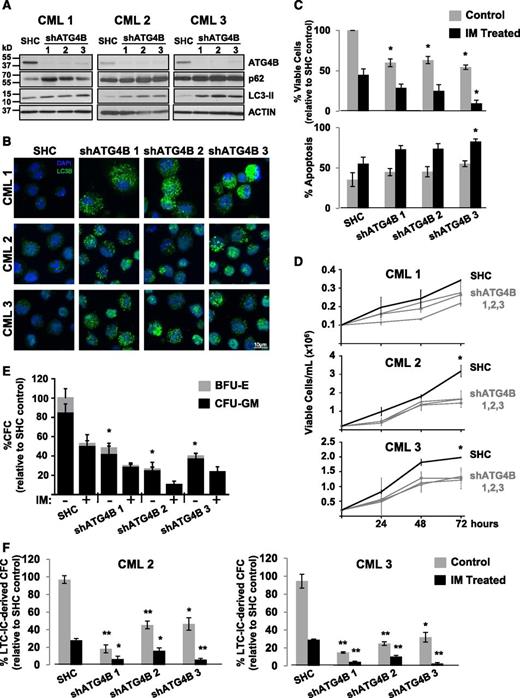
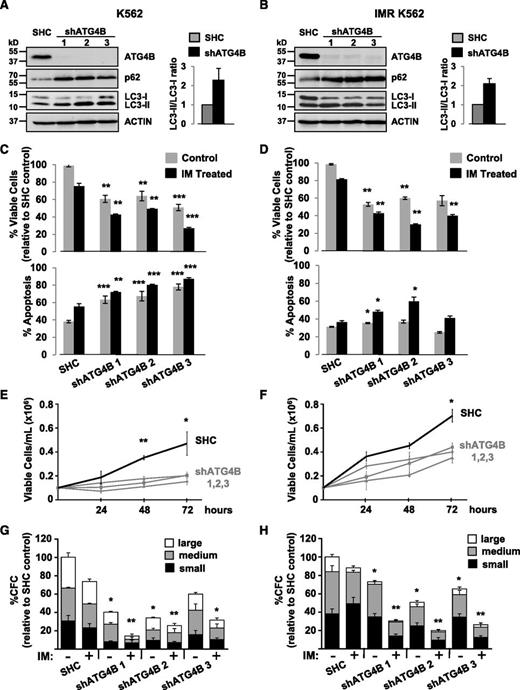
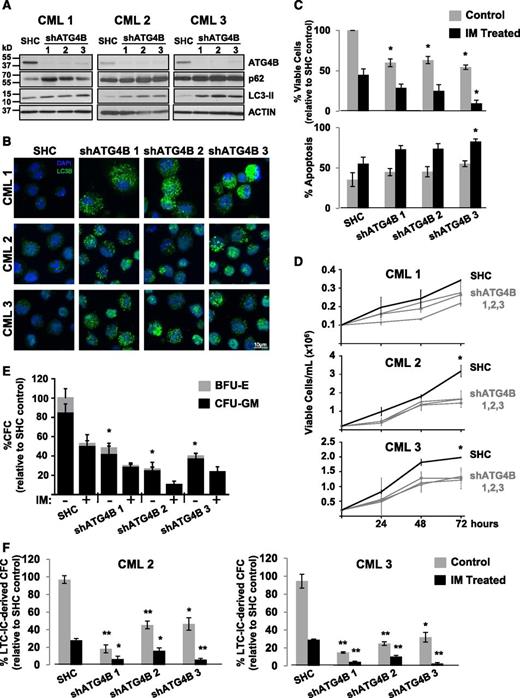
To investigate whether knockdown of ATG4B protein expression by RNA interference would enhance IM-mediated inhibition of cell proliferation, K562 cells and a spontaneously derived cell line that is resistant to IM (IMR K562)49 were transduced with lentiviruses containing either a nontargeting control sequence or constructs containing each of 3 different shRNA targeting sequences against human ATG4B (shATG4B). Stable knockdown of ATG4B (>90%) was confirmed in all shATG4B transduced cells by western blotting. An increase in the LC3-II/LC3-I ratio as well as elevated p62 protein levels was observed upon ATG4B suppression, indicating inhibition of autophagy (Figure 6A-B). Interestingly, stable suppression of ATG4B resulted in significantly reduced viability and an increase in apoptosis in both K562 and IM-resistant K562 cells, and these effects were further enhanced with IM treatment (Figures 6C-D). Moreover, ATG4B knockdown reduced the ability of these cells to grow in suspension culture and to form CFC colonies in semisolid medium compared with control cells (2- to 3-fold; Figure 6E-H). Similar results were obtained with a transient ATG4B knockdown with a combination of 4 siRNA targeting sequences specific for human ATG4B (supplemental Figure 1A-D). Similarly, stable suppression of ATG4B expression in pretreatment CD34+ cells from 3 IM-nonresponder patient samples resulted in increased LC3-II and p62 protein levels and an accumulation of endogenous LC3B puncta (Figure 7A-B) as well as significantly reduced cell viability and increased apoptosis, which were further enhanced upon IM treatment (Figure 7C-D). Importantly, knockdown of ATG4B significantly impaired survival of CML stem and progenitor cells and sensitized them to IM, as assessed by CFC and LTC-IC assays (30% to 70% and 20% to 50%, P < .05; Figure 7E-F and supplemental Figure 1F). Thus, impairment of autophagy via knockdown of ATG4B significantly affects the survival of IM-resistant cells and primary CML stem/progenitor cells from IM nonresponder patients, enhancing the effects of IM treatment.
Lentiviral-mediated knockdown of ATG4B in K562 and K562 IM-resistant cells impairs autophagy and reduces viability and growth of these cells. (A-B) Western blot analysis of cell lysates from K562 cells (A) and IM-resistant cells (IMR K562) (B) transduced with either a nontargeting shRNA control sequence (SHC) or constructs containing each of 3 different shRNA targeting sequences against human ATG4B (shATG4B). Antibodies used are indicated. The LC3-II/LC3-I ratios measured in transduced control and shATG4B cells are shown. Accumulation of the autophagy markers LC3-II and p62 in ATG4B knockdown cells indicates a block in autophagy. (C-D) Viability of transduced K562 (C) and IM-resistant cells (D) was measured ±IM after 48 hours and apoptosis of these cells determined by Annexin V staining and FACS analysis. (E-F) Growth of transduced K562 (E) and IM-resistant cells (F) was measured every 24 hours for 72 hours. (G-H) Numbers of colonies produced from transduced K562 (G) and IM-resistant cells (H) in semisolid culture ±IM or DMSO (control). Colony numbers for large (>500 cells), medium (50-500 cells), and small (<50 cells) are indicated. Data shown are the mean ± SEM of measurements from 3 (K562) or 2 (IMR K562) independent experiments. Asterisk indicates significant difference between control and ATG4B knockdown cells at *P < .05, **P < .01, and ***P < .001.
Lentiviral-mediated knockdown of ATG4B in K562 and K562 IM-resistant cells impairs autophagy and reduces viability and growth of these cells. (A-B) Western blot analysis of cell lysates from K562 cells (A) and IM-resistant cells (IMR K562) (B) transduced with either a nontargeting shRNA control sequence (SHC) or constructs containing each of 3 different shRNA targeting sequences against human ATG4B (shATG4B). Antibodies used are indicated. The LC3-II/LC3-I ratios measured in transduced control and shATG4B cells are shown. Accumulation of the autophagy markers LC3-II and p62 in ATG4B knockdown cells indicates a block in autophagy. (C-D) Viability of transduced K562 (C) and IM-resistant cells (D) was measured ±IM after 48 hours and apoptosis of these cells determined by Annexin V staining and FACS analysis. (E-F) Growth of transduced K562 (E) and IM-resistant cells (F) was measured every 24 hours for 72 hours. (G-H) Numbers of colonies produced from transduced K562 (G) and IM-resistant cells (H) in semisolid culture ±IM or DMSO (control). Colony numbers for large (>500 cells), medium (50-500 cells), and small (<50 cells) are indicated. Data shown are the mean ± SEM of measurements from 3 (K562) or 2 (IMR K562) independent experiments. Asterisk indicates significant difference between control and ATG4B knockdown cells at *P < .05, **P < .01, and ***P < .001.
Lentiviral-mediated knockdown of ATG4B blocks autophagy, impairs the survival of CD34+ CML stem/progenitor cells and sensitizes these cells to IM. (A) Western blot analysis of cell lysates obtained from CD34+ cells of 3 CML patient samples transduced with either a nontargeting shRNA control (SHC) or constructs containing one of 3 different shRNA targeting sequences against human ATG4B (shATG4B). Antibodies used are indicated. (B) The same transduced cells were stained with an anti-LC3B antibody and analyzed by confocal microscopy. Representative images at maximum projection are shown. An accumulation of endogenous LC3B puncta upon ATG4B knockdown is observed. (C) Viability of the same transduced cells was measured ±IM after 72 hours and apoptosis of these cells determined by Annexin V staining and FACS analysis. (D) Growth of the same transduced CD34+ CML cells was measured every 24 hours for 72 hours. (E) Numbers and types of colonies produced from the same transduced cells in semisolid culture ±IM (5 µM) or DMSO (control). (F) LTC-initiating cell-derived colony numbers (LTC-IC-derived CFCs) were measured in transduced CD34+ cells from 2 CML patient samples ±IM (5 µM) or DMSO (control). Data shown are the mean ± SEM of all 3 CML patient samples or technical duplicates for each CML patient sample. Asterisk indicates significant difference between control and ATG4B knockdown cells at *P < .05, **P < .01, and ***P < .001.
Lentiviral-mediated knockdown of ATG4B blocks autophagy, impairs the survival of CD34+ CML stem/progenitor cells and sensitizes these cells to IM. (A) Western blot analysis of cell lysates obtained from CD34+ cells of 3 CML patient samples transduced with either a nontargeting shRNA control (SHC) or constructs containing one of 3 different shRNA targeting sequences against human ATG4B (shATG4B). Antibodies used are indicated. (B) The same transduced cells were stained with an anti-LC3B antibody and analyzed by confocal microscopy. Representative images at maximum projection are shown. An accumulation of endogenous LC3B puncta upon ATG4B knockdown is observed. (C) Viability of the same transduced cells was measured ±IM after 72 hours and apoptosis of these cells determined by Annexin V staining and FACS analysis. (D) Growth of the same transduced CD34+ CML cells was measured every 24 hours for 72 hours. (E) Numbers and types of colonies produced from the same transduced cells in semisolid culture ±IM (5 µM) or DMSO (control). (F) LTC-initiating cell-derived colony numbers (LTC-IC-derived CFCs) were measured in transduced CD34+ cells from 2 CML patient samples ±IM (5 µM) or DMSO (control). Data shown are the mean ± SEM of all 3 CML patient samples or technical duplicates for each CML patient sample. Asterisk indicates significant difference between control and ATG4B knockdown cells at *P < .05, **P < .01, and ***P < .001.
Discussion
Autophagy can play dual, paradoxical roles of being tumor suppressing or tumor promoting, depending on the stage or environment of different types of cancers.21,50 Recent investigations have revealed that IM treatment in CML cells in vitro results in the induction of tumor-protective autophagy, with genetic ablation or pharmacologic targeting of autophagy enhancing IM-mediated cell death.38-41 Interestingly, it has recently been reported that IM-induced autophagy is due to inhibition of the BCR-ABL/phosphatidylinositol 3-kinase/AKT/FOXO4/ATF5/mTOR pathway.51 It has also been shown that autophagy plays a tumor-promoting role in BCR-ABL–mediated leukemogenesis.52 In this study, we demonstrated that the transcript levels of ATG4B in CD34+ hematopoietic stem/progenitor cells were highest among all examined genes, with 110-fold higher expression than BECLIN-1 (Figure 1A). Remarkably, transcript levels of all ATG4 family members were significantly higher in CD34+ CML cells compared with healthy donor cells (Figure 1B), and protein expression of ATG4B was also elevated (Figure 1C). A kinetic and substrate-specificity analysis of ATG4 family members has reported that ATG4B is the most critical cysteine protease regulating the autophagic process by both generating LC3-I and recycling LC3-II,29,53 with the broadest substrate spectrum for various LC3 homologs. It is the most active ATG4 paralog, followed by ATG4A, whereas ATG4C and D possess minimal protease activity.35 Notably, our studies show that ATG4C is expressed at very low levels in primitive hematopoietic cells, suggesting that ATG4C may play a minor role, whereas ATG4B may be the dominant form, as suggested by its strikingly high expression. This interpretation is further supported by studies using mouse models lacking various ATG4 family members, where ATG4C knockout mice display a mild autophagy defect but ATG4B null mice display defective proteolytic cleavage of LC3 and demonstrate a systemic reduction in autophagic flux.34,37,54 Even though ATG4A and ATG4D transcripts were detected, it is possible that these also play minor roles in the autophagic process in primitive CD34+ cells, because ATG4A is expressed at very low levels and ATG4D was shown to display minimal activity against LC3.35 These results suggest that ATG4B plays an important role in maintaining cellular integrity under homeostatic conditions in primitive hematopoietic cells and that its deregulation in CML stem/progenitor cells may be associated with prosurvival mechanisms of leukemic cells. Most interestingly, we found that ATG4B expression was significantly higher in CD34+ cells from patients retrospectively classified as IM nonresponders vs IM responders, including higher expression in their stem cell–enriched population (Figures 2 and 3). Thus, measurement of ATG4B expression may provide a unique autophagy signature that is predictive of TKI responses in a clinical setting, and prospective assessment of this gene signature change may allow improved patient management.
Strikingly, knocking down ATG4B protein expression not only significantly decreased cell viability but also reduced cell proliferation and colony-formation ability, with effects even more pronounced upon in vitro IM treatment in IM-sensitive and IM-resistant K562 cells as well as in pretreatment CD34+ stem/progenitor cells from IM nonresponders (Figures 6 and 7). We also observed that suppression of ATG4B resulted in an accumulation of endogenous LC3-II in CD34+ CML cells or an increase in the LC3-II/LC3-I ratio in K562 cells, which was accompanied by an accumulation of p62 protein (Figures 6 and 7). LC3-II accumulation could be due to induction, rather than inhibition, of autophagy, but the observation of increased p62 protein in these cells indicates a block in autophagy.38,51 This is because p62 is incorporated into the completed autophagosome and subsequently degraded in the autolysosome.24,25,51 This is consistent with an early report showing that silencing ATG4B increases lipidated LC3 in HEK293 cells29 and a recent study showing that silencing ATG4B increases LC3-II in NIH/3T3 cells and affects ERK phosphorylation.53 Our study supports the critical role of ATG4B in generating and recycling LC3 for an efficient autophagic process in primitive leukemic cells to ensure their expansion and survival. This aligns with previous findings that targeting the autophagy pathway with pharmaceuticals, such as chloroquine, or by genetic targeting of key molecules, such as BECLIN-1, ATG5, or ATG7, potentiates TKI-mediated inhibition of growth and/or elimination of CML cells.22,38,40,41 The development of a high-throughput fluorescence assay for compound library screening to identify ATG4B inhibitors was recently reported, along with investigation of the specificities of a few already identified inhibitors.55 This body of evidence strongly suggests that combination therapy of TKIs and an autophagy inhibitor, perhaps an ATG4B inhibitor or pan-ATG4 inhibitor targeting protease activity, would provide better therapeutic outcomes for CML patients unlikely to benefit from TKI monotherapy.
Interestingly, both RNA and protein expression of ATG5 and BECLIN-1 were also significantly enhanced in CD34+ CML cells, supported by recent studies showing that knockdown of ATG5 or BECLIN-1 enhances the cell-death–inducing effects of IM in CML cells.38,56 In addition, both ATG5 and BECLIN-1 were found to be target genes for miR-30a, and the use of a miR-30a mimic significantly reduced levels of ATG5 and BECLIN-1, resulting in inhibition of autophagy and enhanced IM-induced apoptosis in CML cells.41 We also examined expression of miRNAs predicted to regulate ATG4B and ATG4D expression. We discovered that miR-34a and miR-152 expression levels are downregulated in CML stem/progenitor cells compared with CD34+ normal cells, correlating inversely with increased transcript levels of ATG4B and ATG4D (Figure 5). Moreover, forced expression of miR-34a significantly reduced ATG4B protein levels in CML cells and further sensitized these cells to IM treatment. Luciferase assays confirmed direct targeting of ATG4B by miR-34a but did not confirm direct targeting of ATG4D by miR-152 (Figure 5), although both miR-34a and miR-152 are predicted to target ATG4B and ATG4D, respectively, based on 4 prediction algorithms.
Previous studies by our laboratory12,13,45 and others have consistently demonstrated that CML stem cell–enriched populations (CD34+CD38−) and progenitor cells (CD34+CD38+) are intrinsically less sensitive to IM and other TKIs than more mature cells (CD34−) that compose the bulk (>90%) of the leukemic clone.14-18 These rare cells also constitute a critical population for generating genetically IM-resistant subclones.13,16 Therefore, it was critical to determine expression patterns of key autophagy genes in CD34 subpopulations. We observed increased expression of ATG4 family members, ATG5, ATG7, and ATG12 in CML stem cells from IM nonresponders compared with IM responders, but most ATG genes examined did not express higher levels in stem cells than progenitor cells. Nevertheless, more mature cells expressed the lowest levels of these genes (Figure 3). It is possible that most leukemic stem cells are not catabolically active and thus do not display a high turnover of autophagy proteins at basal levels due to their quiescent status and limited bioenergetic needs.21,22 However, these cells can be stimulated in response to stress and metabolic changes to induce autophagy, and inhibition of the autophagy process by knockdown of key autophagy proteins or combination treatment of TKIs and drugs that inhibit autophagy (chloroquine or 3-methyladenine) can enhance cell death of these primitive cells.22,38,41,52 Consistent with these findings, relatively higher levels of key autophagy gene transcripts and proteins found in pretreatment CML stem/progenitor cells, in particular in IM nonresponders, compared with their more mature cells, further explains their reduced sensitivity to TKI monotherapy, due to preferentially enhanced prosurvival activities associated with the induction of autophagy. Targeting specific autophagy genes, such as ATG4B, could provide therapeutic strategies that, in combination with TKIs, might be more effective in targeting the stem/progenitor cell population.
The online version of this article contains a data supplement.
The publication costs of this article were defrayed in part by page charge payment. Therefore, and solely to indicate this fact, this article is hereby marked “advertisement” in accordance with 18 USC section 1734.
Acknowledgments
The authors thank the Stem Cell Assay Laboratory for cell processing and cryopreservation of samples, members of the Leukemia/BMT Program of British Columbia and the Hematology Cell Bank of British Columbia (Vancouver, BC, Canada) for providing patient samples, the Terry Fox Laboratory FACS Facility for cell sorting, Dr W. Wei for assistance in luciferase reporter assays, Novartis for IM and NL, Bristol-Myers Squibb for DA, STEMCELL Technologies for cell culture reagents, Dr Ali Turhan (University of Poitiers) for the IM-resistant cell line, A. Ringrose for review of the manuscript, and A. Babaian for insightful discussion.
This work was supported by the Canadian Institutes of Health Research (CIHR) team grant GPG-102167 (to S.M.G., X.J., and 7 other investigators) and in part by the Leukemia & Lymphoma Society of Canada, the Canadian Cancer Society and the CIHR (X.J.). K.R. received a medical genetics graduate entrance scholarship from the University of British Columbia and a BC Cancer Agency incentive training award; H.L. is a recipient of the University of British Columbia 4-year fellowship and a CIHR Frederick Banting and Charles Best Canada graduate scholarship, and K.B.L.L. was a recipient of the Leukemia & Lymphoma Society fellowship and a Michael Smith Foundation for Health Research postdoctoral fellowship. X.J. was, and R.R.B. is, a Michael Smith Foundation for Health Research scholar, and S.M.G is a CIHR new investigator.
Authorship
Contribution: K.R., K.B.L.L., D.L.F., S.M.G., and X.J. developed the concept and designed the experiments; K.R. performed most experiments and analyzed data; K.B.L.L. initiated and performed some experiments suppressing ATG4B in CML cells; H.L. performed miRNA expression experiments and analyzed data for miRNA studies; A.L. and H.M.W. assisted in the production of lentiviruses and performed some transduction experiments; M.M. and R.R.B. performed statistical analysis; D.L.F. provided clinical samples and clinical data; K.R., K.B.L.L., H.L., and X.J. wrote the manuscript, and all other authors commented on the manuscript.
Conflict-of-interest disclosure: D.L.F. and X.J. have received research funding from Novartis Canada and Bristol-Myers Squibb. The remaining authors declare no competing financial interests.
Correspondence: Xiaoyan Jiang, Terry Fox Laboratory, BC Cancer Agency, 675 West 10th Ave, Vancouver, BC V5Z 1L3, Canada; e-mail: xjiang@bccrc.ca.
References
Author notes
H.L. and K.B.L.L. contributed equally to this study.

