Abstract
INTRODUCTION
Eltrombopag (EP) is an orally bioavailable thrombopoietin receptor agonist developed to increase platelet production in a range of conditions associated with thrombocytopaenia. The finding that EP, in addition to increasing platelet counts in myelodysplastic syndromes (MDS), also slowed progression to acute myeloid leukemia has been linked to antiproliferative effects potentially mediated by chelation of labile intracellular iron pools in leukaemia cell lines (Roth et al, 2012, Blood). However, the ability of EP to progressively decrease total cellular iron and its relative efficacy in this regard compared with clinically available iron chelators such as Desferrioxamine (DFO), Deferiprone (DFP) and Deferasirox (DFX) have not been reported. Using a cell based assay system for total cellular iron we therefore compared cellular iron mobilization with EP to that achieved with clinically established iron chelators.
METHODS
The permanent cardiomyocyte cell line H9C2 derived from embryonic rat ventricle was chosen to model iron mobilization, as heart failure secondary to iron overload is the most common cause of death among patients with transfusion-dependent anaemias. Iron concentration was determined using the ferrozine assay (Riemer et al. Anal Biochem. 2004). A two fold increase of intracellular iron compared to control was obtained by serially treating cells with 10% FBS DMEM media. The cells were then exposed to iron chelators/EP, lysed, and intracellular iron concentration determined via the ferrozine assay, normalized against protein content. The LDH enzymatic viability assay was used to ensure viability was consistently >98% during experiments, and to assess the toxicity of EP on the cardiomyocyte cell line.
RESULTS
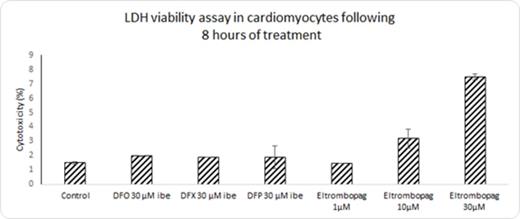
EP induced both dose and time dependent cellular iron removal from cells at 1, 2, 4 and 8 hours. At 1µM, EP was able to remove 42% of total cellular iron following 8 hours of treatment, and 60.1% and 65.62% at 10µM and 30µM respectively (Figure 1). Figure 2 shows that cell viability is compromised at concentrations of 10µM and 30µM to 96% and 92% respectively with eltrombopag, but not with the commercially used iron chelators, DFO, DFP and DFX. However, at 1µM EP the viability of the monolayer is maintained at >98%. The high effects of iron release noted in figure 1 by EP at 10µM and 30µM could be partially attributed to toxicity of the drug on the monolayer. In table 1 the difference in iron removal between EP and commercially used iron chelators after 8 hours of treatment is shown. Interestingly, with EP at only 1µM, 42.9% of cellular iron was removed, compared to 22.7 %, 34.9% and 19.3% in the case of DFO, DFX and DFP respectively, all at higher concentrations of 30µM iron binding equivalents (IBE).
DISCUSSION AND CONCLUSION
Remarkably low concentrations of EP (1µM) are required to mobilize cellular iron in our cell system while maintaining cell viability at this concentration. This concentration is achievable clinically (Cmax 2-3 µM two to six hours post administration of 75mg orally) (Neito et al, Haematologica, 2011; Deng et al, Drug Metabolism and Disposition, 2011), and when considered alongside with the long plasma half life and elimination in urine and feces, could render it an effective iron chelator for other indications, particularly if combined with existing iron chelation regimes. It would be of interest to explore how EP performed in an animal iron overloaded/MDS model in isolation or as an adjunct to established chelation therapies.
Percentage of intracellular iron removed from cardiomyocytes by increasing concentrations of Eltrombopag at different time points up until 8 hours
Percentage of intracellular iron removed from cardiomyocytes by increasing concentrations of Eltrombopag at different time points up until 8 hours
Percentage cytotoxicity of cardiomyocyte monolayer following 8 hours of treatment with Eltrombopag and commercially used iron chelators
Percentage cytotoxicity of cardiomyocyte monolayer following 8 hours of treatment with Eltrombopag and commercially used iron chelators
Comparison of iron mobilization by Eltrombopag and commercially used iron chelators following 8 hours of treatment.
| Chelator . | Iron/protein (nmol/mg) . | SD . | % iron removal . |
|---|---|---|---|
| control | 26.78 | 2.5 | - |
| DFO 30μM ibe | 20.70 | 2.2 | 22.70 |
| DFP 30μM ibe | 17.43 | 1.4 | 34.89 |
| DFX 30μM ibe | 21.61 | 1.0 | 19.28 |
| Eltrombopag 1μM | 15.53 | 1.9 | 42.94 |
| Eltrombopag 10μM | 10.70 | 1.2 | 60.06 |
| Eltrombopag 30μM | 9.21 | 0.3 | 65.62 |
No relevant conflicts of interest to declare.
Author notes
Asterisk with author names denotes non-ASH members.


