Key Points
The oncoproteins NrasG12D and Cbfβ-SMMHC increase survival of preleukemic progenitor cells via MEK/ERK signaling and reduce Bim-EL expression.
The NrasLSL-G12D; Cbfb56M mouse is a valuable genetic model for the study of inv(16) AML–targeted therapies.
Abstract
Acute myeloid leukemia (AML) results from the activity of driver mutations that deregulate proliferation and survival of hematopoietic stem cells (HSCs). The fusion protein CBFβ-SMMHC impairs differentiation in hematopoietic stem and progenitor cells and induces AML in cooperation with other mutations. However, the combined function of CBFβ-SMMHC and cooperating mutations in preleukemic expansion is not known. Here, we used NrasLSL-G12D; Cbfb56M knock-in mice to show that allelic expression of oncogenic NrasG12D and Cbfβ-SMMHC increases survival of preleukemic short-term HSCs and myeloid progenitor cells and maintains the differentiation block induced by the fusion protein. NrasG12D and Cbfβ-SMMHC synergize to induce leukemia in mice in a cell-autonomous manner, with a shorter median latency and higher leukemia-initiating cell activity than that of mice expressing Cbfβ-SMMHC. Furthermore, NrasLSL-G12D; Cbfb56M leukemic cells were sensitive to pharmacologic inhibition of the MEK/ERK signaling pathway, increasing apoptosis and Bim protein levels. These studies demonstrate that Cbfβ-SMMHC and NrasG12D promote the survival of preleukemic myeloid progenitors primed for leukemia by activation of the MEK/ERK/Bim axis, and define NrasLSL-G12D; Cbfb56M mice as a valuable genetic model for the study of inversion(16) AML–targeted therapies.
Introduction
Acute myeloid leukemia (AML) results from the accumulation of mutations that deregulate self-renewal, proliferation, and differentiation in hematopoietic stem and progenitor cells (HSPCs).1 The understanding of the mechanism dictated by “driver” mutations during leukemia development is essential for the identification of targets for therapeutic intervention, inducing cell death of AML cells with minimal detriment to normal cells.
The fusion protein CBFβ-SMMHC is expressed in as much as 12% of AML and results from a chromosome 16 (p13q22) inversion (inv)(16), which fuses the first 5 exons of CBFB with the last exons of MYH11 to create the fusion gene CBFb-MYH11.2-4 The standard treatment of patients with inv(16) AML includes chemotherapy with cytotoxic agents, such as cytarabine and anthracyclines. This treatment has a favorable initial response, but the 5-year overall survival remains at approximately 50% to 60%5,6 and decreases to 20% in older patients.7,8
Studies in mice and inv(16) AML patient samples have shown that CBFβ-SMMHC is a “driver” mutation in AML. Expression of the fusion protein in Cbfb+/MYH11 knock-in mouse embryos block definitive hematopoiesis9 and is necessary for leukemic development in cooperation with other mutations.10,11 Using conditional Cbfb+/56M knock-in mice, we have shown that Cbfβ-SMMHC induces expansion of hematopoietic stem cells (HSCs), establishes a myeloid preleukemic progenitor population in the bone marrow (BM), and predisposes to leukemia.12 The leukemic cells of practically all patients diagnosed with subtype M4Eo AML have the inv(16), and this inversion is invariably present in relapse samples. Furthermore, the expression profile of inv16 AML samples defines a unique signature, suggesting that CBFβ-SMMHC redefines the molecular activity of targeted cells.13
The inv(16) AML blasts have “secondary mutations” that cooperate with CBFβ-SMMHC in leukemia. Frequently, these oncogenic mutations target components of cytokine signaling, including small GTPases (NRAS and KRAS), receptors (c-KIT and FLT3), and adaptor molecules (CBL).1,14 For example, oncogenic mutations in NRAS are present in as much as 45% of inv16 AML,15,16 with a prevalence of G12D and Q61K missense mutations.17,18 NRASG12D can promote proliferation and survival in cancer via activation of MEK/ERK and PI3K/AKT pathways,19 although its function appears to be cell type–specific. Recent genetic studies have shown that NrasG12D induces a spectrum of hematologic malignancies in mice, including myeloid- and lympho-proliferation after a long latency, but not AML.20-23 However, the role of NRASG12D in preleukemic progenitor cells primed by other oncoproteins remains unclear.
In this study, we have taken a genetic approach to define the role of NrasG12D in inv16 preleukemic HSPCs and leukemia development. Using Cbfb56M and NrasLSL-G12D conditional knock-in alleles, we show that NrasG12D induces a survival advantage in preleukemic HSPCs and cooperates with Cbfβ-SMMHC in survival of preleukemic myeloid progenitors and in leukemia development. We used transplantation assays to evaluate the median leukemia latency and leukemia-initiating cell (L-IC) activity of AML blasts carrying Cbfb56M or Cbfb56M and NrasLSL-G12D alleles to show that NrasG12D contributes to produce a more aggressive leukemia. The pharmacologic inhibition of NrasG12D-activated pathways suggests that leukemic cell survival depends on MEK/ERK activity, and that PI3K/AKT signaling may not play a significant role. Furthermore, we show that NrasG12D modulates Bcl-2 proapoptotic protein Bim expression in the preleukemic progenitor and leukemic cells, suggesting that survival advantage could be, at least partly, mediated by Bim inhibition.
Methods
Mouse strains and treatment
Transgenic mice carrying the Mx1-Cre, Cbfb56M, and NrasLSL-G12D alleles have been previously described.12,24,25 Mx1-Cre and Nras+/LSL-G12D mice were in C57BL/6 background. Cbfb+/56M mice, originally in 129SvEv background, were backcrossed 6 times into C57BL/6 background for this study. All mice were treated in accordance with federal and state government guidelines, and the University of Massachusetts Medical School Institutional Animal Care and Use Committee.
Genotyping of mice was performed as previously described.12,25 Transient Cre activation was induced in mice carrying the Mx1Cre transgene with 3 intraperitoneal injections of 250 μg polyinosinic-polycytidylic acid (poly(I:C), Amersham Biosciences, Piscataway, NJ) every other day at 6 to 8 weeks of age. Mice were initially monitored daily, and early signs of leukemia were detected by the presence of c-kit+/Lineage– cells in peripheral blood by flow cytometry. Mice with signs of leukemia were under observation twice daily, and moribund leukemic mice were killed when they presented with limited motility, pale paws, and dehydration.
Flow cytometry analysis
Preleukemic progenitors.
BM cells were harvested from the femurs and tibiae of each mouse and stained for surface markers: Lineage (Lin) cocktail (Gr1, Mac1, Ter119, B220, CD3, CD19, and IgM), c-kit, Sca1, CD34, Flt3, and FcγRII/III (all from BD Biosciences, San Diego, CA). Immunophenotypic characterization of hematopoietic compartments included: stem and progenitor compartment (LSK+): Lin–c-Kit+Sca1+, LT-HSCs: LSK+Flt3–CD34–,26 ST-HSC: LSK+Flt3–CD34+, MPPs: LSK+Flt3+CD34+,27 myeloid progenitor cells (LSK–): Lin–c-Kit+Sca1–,28 CMP: LSK–CD34+FcγRII/III–, GMP: LSK–CD34+FcγRII/III+, and MEP: LSK–CD34–FcgRII/III–.
Apoptosis analysis.
BM cells were harvested and stained with indicated cell surface markers and stained with Annexin V and 7-AAD (BD Biosciences) according to the manufacturer’s instructions. Early apoptotic cells were determined as Annexin V+/7AAD– by flow cytometry.
Cell cycle analysis.
BM cells were harvested, stained with cell surface markers, fixed, and permeabilized (BD Cytofix/Cytoperm Fixation/Permeabilization Solution Kit; BD Biosciences). Cells were stained with Ki67 (BD Biosciences) and Hoechst (Immunochemistry Technologies, Bloomington, MN) for 1 hour on ice, and cell cycle analysis was determined by flow cytometry. Fluorescence-activated cell sorter (FACS) data were acquired with LSRII (BD Biosciences) using FACSDiva software and analyzed with FlowJo software (TreeStar, Ashland, OR).
Morphology analysis of BM cells
The BM cells from control, Nras, CM, and Nras/CM mice were harvested from femurs and tibiae, 20 days after treatment with poly(I:C) as described before. Cells were suspended in phosphate-buffered saline, cytospun onto glass slides (500 rpm, 1 minute), and stained using Wright Giemsa (Fisher Scientific Company, Kalamazoo, MI). The representation of progenitor cells was quantified using differential counting following the cell morphology description reported previously.29,30
Immunoblot analyses
Cells were washed in phosphate-buffered saline and resuspended in modified RIPA buffer (50 mM Tris-HCl pH 7.4, 150 mM NaCl, 1 mM ethylenediamine tetraacetic acid, 1% NP-40, 0.25% sodium deoxycholate) with protease inhibitor cocktail III (Calbiochem, Darmstadt, Germany) and phosphatase inhibitor cocktail II and III (Sigma-Aldrich, St. Louis, MO). Antibodies included anti-Bim (cat#2819), anti-Bcl2 (cat#2870), anti-Bcl-xl (cat#2762), anti-Mcl-1 (cat#5453), anti-Phospho-Akt (Ser473) (cat#4058), anti-Akt (cat#9272), anti-Phospho-p44/42 MAPK (Erk1/2) (Thr202/Tyr204) (cat#9101), anti-p44/42 MAPK (Erk1/2) (cat#9102), anti-Phospho-Stat5 (Tyr694) (cat#9359), and anti-Stat5 (cat#9358, all from Cell Signaling Technology, Danvers, MA).
Bim knock-down in BM cells
Retroviral production. shRNA for Scrambled (5′-TACTATCTCTAAGACTTTCT-3′) or mouse Bcl2l11 (5′-ATATATTTAAGTACAAAGGCCT-3′) were cloned into retroviral vector pMSCV-LTRmiR30-PIG (LMP) following the manufacturer’s directions (LMP; Thermo Scientific, Billerica, MA). Stable GP+E-86 viral-packaging cells31 were transfected with LMP constructs using JetPRIME reagent (Polyplus Transfection, New York, NY) and selected with 4 μg/mL puromycin (InvivoGen, San Diego, CA). Retrovirus supernatants were concentrated and titered in 3T3 cells by GFP expression. Knock-down efficiency was tested in puromycin-selected 3T3 cells by quantitative real-time polymerase chain reaction (RT-PCR) and immunoblot analyses.
BM cell infection.
BM progenitor cells were harvested from CM mice pretreated with poly(I:C) and 5-fluorouracil, spin-infected twice with retrovirus supernatants, and cultured for 24 hours. The cells were transferred to serum-free media for 24 hours to induce Bim expression and analyzed for apoptosis by flow cytometry or sorted for GFP+7-AAD– cells using a BD FACSAria cell sorter (BD Biosciences) to assay knock-down efficiency.
Statistics
The P value was calculated by 2-tailed Student t test using Excel (Microsoft Cooperation, Redmond, WA). The leukemia-initiating cell activity (L-IC) was estimated by limiting dilution assay and calculated based on Poisson distribution using L-Calc software (StemCell Technologies, Vancouver, BC, Canada). The nonlinear regression curve fit for viability assay was generated using GraphPad Prism 6 (GraphPad Software, Inc., La Jolla, CA).
Results
Cbfβ-SMMHC and NrasG12D expand preleukemic stem and progenitor cells in mice
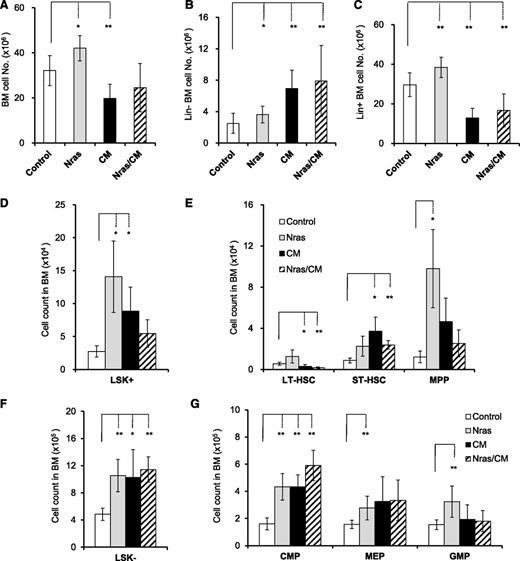
The allelic (Cbfb56M) expression of CBFβ-SMMHC in HSCs induces preleukemic HSPC expansion with impaired differentiation capacity and progresses to leukemia after the accumulation of additional mutations.12 NrasG12D is a frequent mutation found in human inv16 AML, and has been shown to promote the expansion of HSCs and myeloid progenitors.20,23 To understand the role of NrasG12D in leukemia progression, we analyzed the frequency of preleukemic HSPCs in the BM of Mx1Cre (Control), Nras+/LSL-G12D/Mx1Cre (Nras), Cbfb+/56M/Mx1Cre (CM), and Nras+/LSL-G12D/Cbfb+/56M/Mx1Cre (Nras/CM) mice, by flow cytometry 20 days after Cre activation. The BM cellularity was increased in Nras mice, primarily increased in the late (Lin+) progenitor cells (Figure 1A-C; P < .05). Conversely, CM and Nras/CM mice showed a reduction in BM cellularity, with a significant increase in the immature (Lin–) and decrease in the mature (Lin+) BM cells (Figure 1A-C; P < .01), suggesting a block in myeloid differentiation. The number of early progenitor (Lin–, Sca1+, c-Kit+ [LSK+]) cells in Nras, CM, and Nras/CM increased to five-, three-, and twofold, respectively (Figure 1D). Activation of NrasG12D increased the multipotential progenitors (MPPs) eightfold, with minimal change of the long-term and short-term HSCs (LT-HSCs and ST-HSCs; Figure 1E). Activation of Cbfβ-SMMHC increased the MPPs and ST-HSCs two- to fourfold and reduced the LT-HSCs two- to threefold in CM and Nras/CM mice (Figure 1E; P < .05). The percentage of populations changed was similar in CM and Nras/CM, suggesting that Cbfβ-SMMHC directed the fraction of HSC and early progenitors in BM (supplemental Figure 1A-B, available on the Blood Web site). The total number of myeloid progenitor cells (LSK–) increased twofold in the 3 groups compared with controls (Figure 1F; P < .05). The NrasG12D expression expanded all myeloid compartments proportionally (Figure 1G and supplemental Figure 1C-D), as previously shown.20 The expression of Cbfβ-SMMHC increased primarily the CMP compartment in the BM of CM and Nras/CM mice (Figure 1G and supplemental Figure 1C-D) and hindered Nras-mediated expansion of GMPs in Nras/CM mice. Furthermore, the morphology (differential counts) analysis of BM cells from each genetic group revealed that CM and Nras/CM samples had an increase in blast/myeloblasts and promyelocytes and a reduction in immature neutrophils (supplemental Figure 1E).
Cbfβ-SMMHC and NrasG12D expand preleukemic stem and progenitor cells. Quantification of BM cells from Mx1Cre (control, white), Nras+/LSL-G12D/Mx1Cre (Nras, gray), Cbfb+/56M/Mx1Cre (CM, black), and Nras+/LSL-G12D/Cbfb+/56M/Mx1Cre (Nras/CM, diagonal) mice by flow cytometry, 20 days after Cre activation. (A-C) n = 8-14 mice per group: (A) BM cell numbers (per mouse) in each group; (B) lineage-negative (Lin–) BM cell numbers in each group; (C) Lineage-positive (Lin+) BM cell numbers in each group. (D-E) n = 4-8 mice per group: (D) LSK+ cell numbers in BM; (E) long-term (LT-HSCs, LSK+CD34–FLT3–), short-term (ST-HSCs, LSK+CD34+FLT3–) hematopoietic stem, and multipotential progenitor (MPPs, LSK+CD34+FLT3+) cell numbers in each group. (F-G) n = 5-12 mice per group: (F) LSK– cell numbers; (G) common myeloid progenitor (CMP, LSK–CD34+FcγRII/III–), megakaryocyte-erythroid progenitor (MEP, LSK–CD34–FcγRII/III–), and granulocyte-monocyte progenitor (GMP, LSK–CD34+FcγRII/III+) cell numbers in each group. *P < .05, **P < .01.
Cbfβ-SMMHC and NrasG12D expand preleukemic stem and progenitor cells. Quantification of BM cells from Mx1Cre (control, white), Nras+/LSL-G12D/Mx1Cre (Nras, gray), Cbfb+/56M/Mx1Cre (CM, black), and Nras+/LSL-G12D/Cbfb+/56M/Mx1Cre (Nras/CM, diagonal) mice by flow cytometry, 20 days after Cre activation. (A-C) n = 8-14 mice per group: (A) BM cell numbers (per mouse) in each group; (B) lineage-negative (Lin–) BM cell numbers in each group; (C) Lineage-positive (Lin+) BM cell numbers in each group. (D-E) n = 4-8 mice per group: (D) LSK+ cell numbers in BM; (E) long-term (LT-HSCs, LSK+CD34–FLT3–), short-term (ST-HSCs, LSK+CD34+FLT3–) hematopoietic stem, and multipotential progenitor (MPPs, LSK+CD34+FLT3+) cell numbers in each group. (F-G) n = 5-12 mice per group: (F) LSK– cell numbers; (G) common myeloid progenitor (CMP, LSK–CD34+FcγRII/III–), megakaryocyte-erythroid progenitor (MEP, LSK–CD34–FcγRII/III–), and granulocyte-monocyte progenitor (GMP, LSK–CD34+FcγRII/III+) cell numbers in each group. *P < .05, **P < .01.
These results show that NrasG12D and Cbfβ-SMMHC expression increase short-term HSCs and common myeloid progenitor cells in the early preleukemic stage in vivo, and suggest that this expansion is mainly driven by Cbfβ-SMMHC activity in Nras/CM mice.
Cbfβ-SMMHC and NrasG12D provide survival advantage to preleukemic progenitor cells
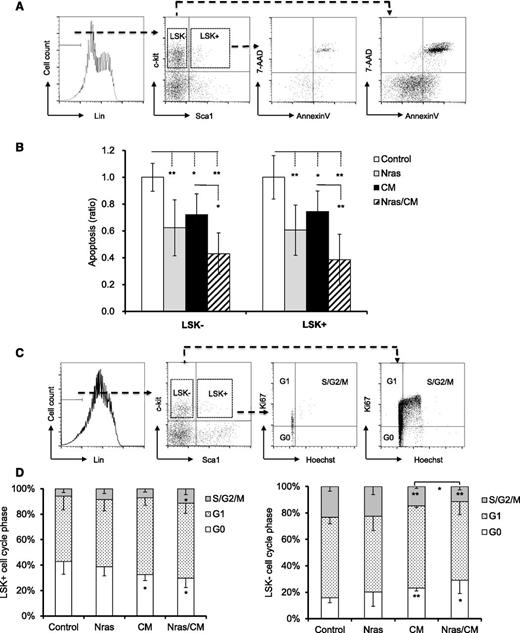
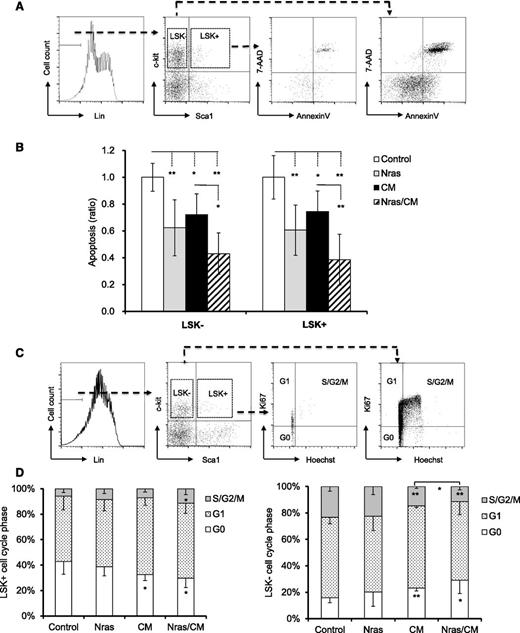
To better understand the role of NrasG12D and CBFβ-SMMHC on preleukemic progenitor cells, we inquired about their functions on proliferation and apoptosis of BM progenitors in vivo. Early apoptosis (AnnexinV+/7AAD–) was analyzed in BM cells from mice by flow cytometry 20 days after Cre activation. Apoptosis was significantly reduced in the LSK+ and LSK– compartments expressing NrasG12D or Cbfβ-SMMHC (Figure 2A-B; P < .05), with an additive effect in cells co-expressing NrasG12D and Cbfβ-SMMHC (Figure 2A-B; P < .01). The cell cycle analysis (Hoechst and Ki67 staining) of LSK+ progenitors revealed a reduction in the G0 fraction in CM and Nras/CM mice and an increase in the S/G2/M fraction in Nras/CM mice (Figure 2C-D). However, proliferation of myeloid progenitor cells (LSK–) was reduced (increased G0/G1 vs S/G2/M) in mice expressing Cbfβ-SMMHC (CM and Nras/CM groups; Figure 2C-D). These results suggest that NrasG12D and Cbfβ-SMMHC increase the survival of preleukemic HSPCs. In addition, Cbfβ-SMMHC increases the proliferation of HSPCs but reduces proliferation of myeloid progenitor cells.
Cell cycle and apoptosis analyses of BM preleukemic cells expressing Cbfβ-SMMHC and NrasG12D. (A-B) BM cells from mice treated as in Figure 1 were stained with 7-AAD and Annexin V and analyzed by flow cytometry: (A) the gating of each compartment is shown; (B) quantification of the ratio of apoptosis levels for LSK– (left) and LSK+ (right) cells of each group normalized to control group (n = 5-11, *P < .05, **P < .01). (C-D) Flow cytometry analysis of cell-cycle status using Ki67 and Hoechst staining: (C) gating of BM progenitor for LKS+ and LSK– compartments; (D) quantification (percentage) of cells in G0 (white), G1 (dotted), or S/G2/M (gray) phase for each group (n = 4-8, *P < .05, **P < .01).
Cell cycle and apoptosis analyses of BM preleukemic cells expressing Cbfβ-SMMHC and NrasG12D. (A-B) BM cells from mice treated as in Figure 1 were stained with 7-AAD and Annexin V and analyzed by flow cytometry: (A) the gating of each compartment is shown; (B) quantification of the ratio of apoptosis levels for LSK– (left) and LSK+ (right) cells of each group normalized to control group (n = 5-11, *P < .05, **P < .01). (C-D) Flow cytometry analysis of cell-cycle status using Ki67 and Hoechst staining: (C) gating of BM progenitor for LKS+ and LSK– compartments; (D) quantification (percentage) of cells in G0 (white), G1 (dotted), or S/G2/M (gray) phase for each group (n = 4-8, *P < .05, **P < .01).
NrasG12D cooperates with Cbfβ-SMMHC to induce AML
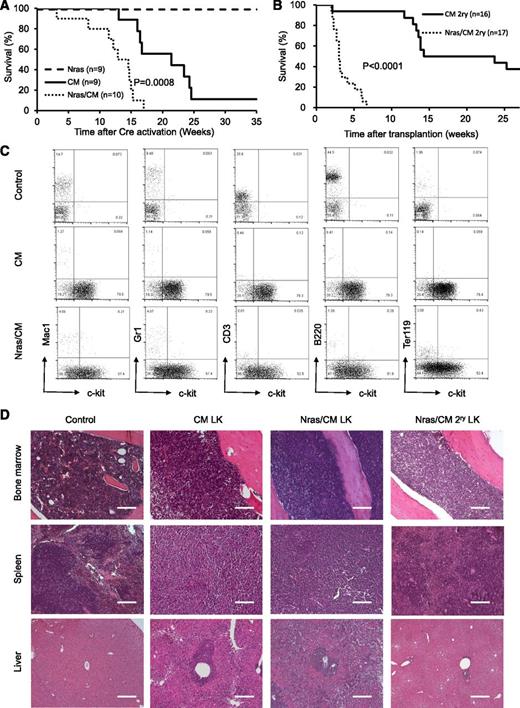
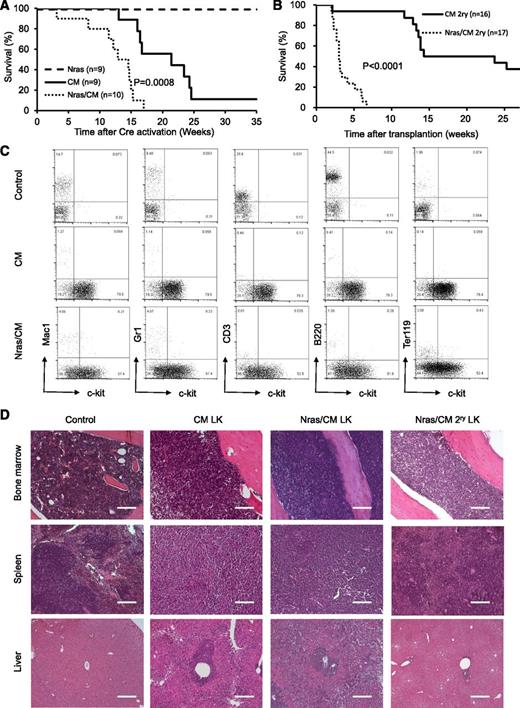
To determine whether NrasG12D synergizes with Cbfβ-SMMHC in leukemia initiation, leukemia latency was analyzed in CM, Nras, and Nras/CM mice after Cre activation. Nras mice remained healthy for up to 35 weeks (experimental end point), and CM mice developed leukemia with a median latency of 21.43 weeks and 89% penetrance (Figure 3A, dashed and solid lines, respectively; supplemental Table 1). Nras/CM mice developed leukemia with a reduced median latency (13.72 weeks; P = 8 × 10⁻⁴) and full penetrance (Figure 3A, dotted line; supplemental Table 1). The median leukemia latency of secondary transplantation assays (5 × 10⁵ leukemic cells) from Nras/CM mice was consistently shorter than that of CM mice (Nras/CM: 3 weeks, 100% penetrance; CM: 19 weeks, 62.5% penetrance; P < .0001; Figure 3B and supplemental Table 1). The L-IC was estimated using limiting dilution assays in representative leukemic cells from CM and Nras/CM mice. Concordant to the median latency data, the L-IC activity in CM leukemia was 1 in 528 334 (range, 1/220 064 to 1/1268 433; 95% confidence interval), and in Nras/CM leukemia was higher than 1 in 4000 leukemic cells (supplemental Figure 2A-B).
Characterization of leukemia in mice expressing Cbfβ-SMMHC and NrasG12D. (A) Kaplan-Meier curve of leukemia-free survival in Nras (dash), CM (solid), and Nras/CM (dotted) mice after Cre activation (time 0). (B) Kaplan-Meier survival curve of recipients transplanted with leukemic cells from CM (solid) and Nras/CM (dotted) mice. (C) Representative FACS analysis of peripheral blood cells from wild-type control and moribund CM or Nras/CM mice, showing progenitor cell marker c-kit (x-axis) and lineage markers (y-axis). (D) Representative hematoxylin and eosin (H&E)–stained histology sections of BM, spleen, and liver from wild-type control, moribund CM, Nras/CM mice, and Nras/CM secondary leukemic mice. LK, leukemia. The scale bars in the BM and spleen represent 50 μm; in the liver 100 μm.
Characterization of leukemia in mice expressing Cbfβ-SMMHC and NrasG12D. (A) Kaplan-Meier curve of leukemia-free survival in Nras (dash), CM (solid), and Nras/CM (dotted) mice after Cre activation (time 0). (B) Kaplan-Meier survival curve of recipients transplanted with leukemic cells from CM (solid) and Nras/CM (dotted) mice. (C) Representative FACS analysis of peripheral blood cells from wild-type control and moribund CM or Nras/CM mice, showing progenitor cell marker c-kit (x-axis) and lineage markers (y-axis). (D) Representative hematoxylin and eosin (H&E)–stained histology sections of BM, spleen, and liver from wild-type control, moribund CM, Nras/CM mice, and Nras/CM secondary leukemic mice. LK, leukemia. The scale bars in the BM and spleen represent 50 μm; in the liver 100 μm.
The pathology of leukemia was similar between genetic groups (CM and Nras/CM) and between primary and secondary leukemias. Analysis of peripheral blood cellular composition from leukemic mice revealed a consistent increase in white blood cell (WBC) count and increased presence of leukocytes with immature morphology (supplemental Figure 2C and supplemental Table 1). Immunophenotypic analysis of peripheral blood revealed the predominant presence of immature (c-kit+, Lin–) cells (Figure 3C). The spleens of primary and secondary leukemic mice were enlarged (supplemental Table 1), with evident disruption in splenic architecture (Figure 3D). Histologic staining also revealed that leukemic cells infiltrated into the BM and liver. Quantification of leukemic cell burden was confirmed in peripheral blood, spleen, and BM from Nras/CM, CM, and Nras/CM secondary leukemic mice (supplemental Figure 2D). Juvenile myelomonocytic leukemia can present homozygous mutant NRAS expression by uniparental disomy.32 The phenomenon was replicated in the NrasG12D CMML and AML mouse models.21,22 Genomic PCR analysis of colony-forming units from 3 independent Nras/CM leukemia samples confirmed the presence of the mutant NrasG12D and wild-type alleles in all cases (Nras+/G12D genotype; data not shown), suggesting that uniparental disomy is not a frequent event in our AML model. Together, these data suggest that allelic NrasG12D expression synergizes with Cbfβ-SMMHC to induce myeloid leukemia in mice.
NrasG12D and Cbfβ-SMMHC drive cell-autonomous AML in mice
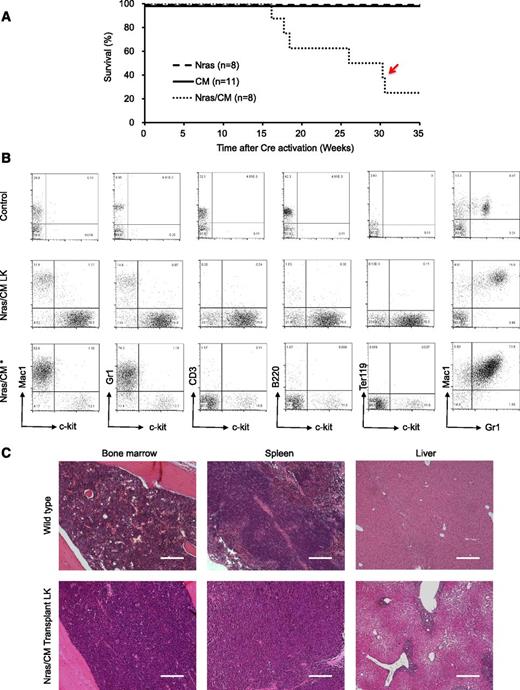
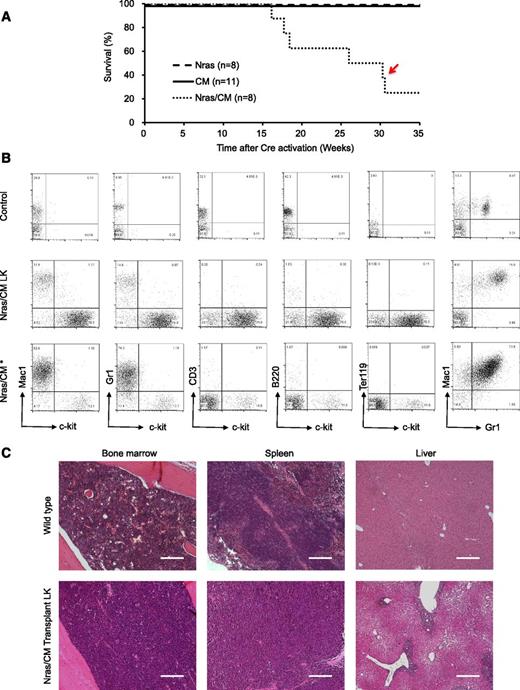
We inquired about whether expression of NrasG12D and Cbfβ-SMMHC is sufficient to induce leukemia using a donor-cell leukemia assay (supplemental Figure 3A). Briefly, 5 × 10⁵ untreated CD45.2+ BM cells from CM, Nras, or Nras/CM mice were transplanted with 2 × 10⁵ CD45.1+ wild-type BM cells into sublethal irradiated CD45.1+ recipient mice. The engraftment efficiency of CD45.2+ donor cells was evaluated 2 weeks after transplantation by flow cytometry analysis of peripheral blood cells (donor [CD45.2] cell range, 42%-60%, 17%-37%, and 38%-54% for Nras, CM, and Nras/CM, respectively). Cre-mediated activation of oncoprotein expression was induced by poly(I:C) treatment, and the leukemia latency was monitored thereafter. Under this experimental design, Nras/CM recipient mice developed leukemia with a median latency of 26 weeks and 75% penetrance (Figure 4A, dotted line; supplemental Table 1). Conversely, Nras and CM recipient mice remained healthy for 35 weeks (experimental end point; Figure 4A, dashed and solid lines, respectively). Immunophenotypic analysis of the peripheral blood cells revealed a myeloid leukemia phenotype similar to that described for the Nras/CM mice (5/6 mice), including an increased number of leukocytes with immature morphology (supplemental Figure 3B and supplemental Table 1) and increased number of Lin–kit+ cells (as illustrated in Figure 4B and quantified in supplemental Figure 3C). These mice showed leukemic cells in the spleen and BM (supplemental Figure 3C), splenomegaly (supplemental Table 1), and infiltration of leukemic cells in the liver (Figure 4C). One mouse (Figure 4A, red arrow) presented a mixed AML and myeloproliferative phenotype, with intermediate levels of Lin–kit+ cells and high levels of Gr1+Mac1+ cells in peripheral blood, BM, and spleen (Figure 4B, bottom row; supplemental Figure 3B-C, open square). Together, these studies show that NrasG12D accelerates Cbfβ-SMMHC–mediated leukemia in the presence of competitor wild-type BM cells.
Characterization of donor cell–induced leukemia. (A) Kaplan-Meier survival curve of recipient mice transplanted with Nras (dash), CM (solid), and Nras/CM (dotted) BM cells and Cre-activated after 2 weeks. The red arrow depicts the disease onset of a mouse with mixed leukemic and myeloproliferative cells. (B) FACS analysis of peripheral blood cells from control (top), representative leukemic moribund Nras/CM recipient mice (5/6), and the Nras/CM* (bottom) mouse with a mix of leukemia and myeloproliferative phenotypes. (C) Representative H&E-stained histology sections of BM, spleen, and liver from control and moribund Nras/CM recipient mice (Nras/CM transplantation LK). The scale bars in the BM and spleen represent 50 μm; in the liver 100 μm.
Characterization of donor cell–induced leukemia. (A) Kaplan-Meier survival curve of recipient mice transplanted with Nras (dash), CM (solid), and Nras/CM (dotted) BM cells and Cre-activated after 2 weeks. The red arrow depicts the disease onset of a mouse with mixed leukemic and myeloproliferative cells. (B) FACS analysis of peripheral blood cells from control (top), representative leukemic moribund Nras/CM recipient mice (5/6), and the Nras/CM* (bottom) mouse with a mix of leukemia and myeloproliferative phenotypes. (C) Representative H&E-stained histology sections of BM, spleen, and liver from control and moribund Nras/CM recipient mice (Nras/CM transplantation LK). The scale bars in the BM and spleen represent 50 μm; in the liver 100 μm.
Endogenous NrasG12D and Cbfβ-SMMHC coregulate Bim protein levels
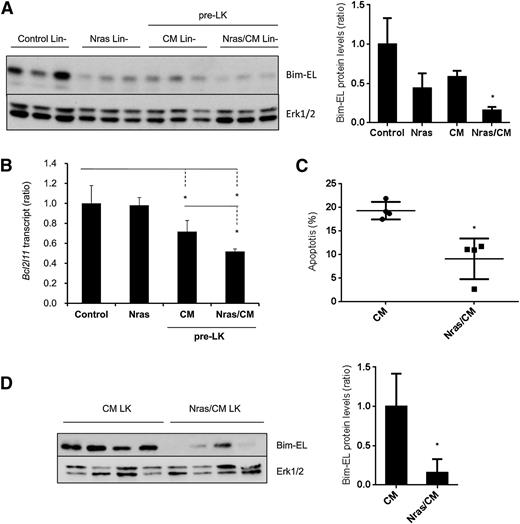
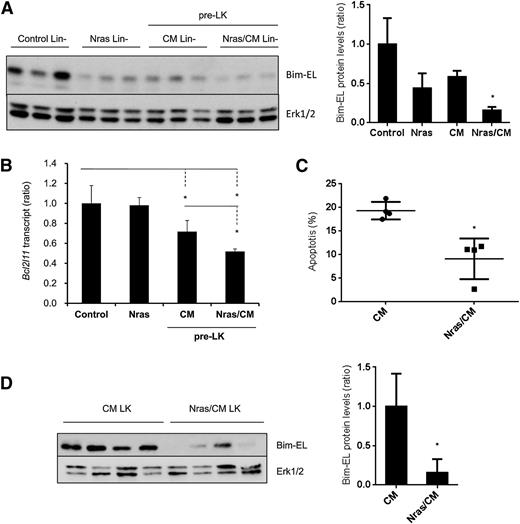
Our results showed a reduction in apoptosis on the preleukemic HSPCs expressing NrasG12D and Cbfβ-SMMHC (Figure 2A-B). To understand the mechanism underlying this survival advantage, we tested the expression of apoptosis-associated proteins from the Bcl-2 family, including Bim, Bcl2, Bcl-xl, and Mcl-1, in preleukemic Lin– BM cells (Figure 5A and supplemental Figure 4A). The expression levels of Bcl2, Bcl-xL, and Mcl-1 were inconsistent in Nras/CM preleukemic cells and were similar in leukemic cells (supplemental Figure 4A-B). However, Bim-EL protein levels were reduced 50% in Nras and CM and 80% in Nras/CM Lin– preleukemic cells when compared with controls (Figure 5A). Interestingly, levels of Bim transcript, Bcl2l11, were reduced 30% by the Cbfβ-SMMHC and 50% by both oncoproteins in preleukemic Lin– BM cells, but were unchanged in Lin– cells expressing NrasG12D (Figure 5B). Similarly, Nras/CM leukemic cells showed lower apoptosis and reduced Bim-EL levels when compared with CM leukemic cells (Figure 5C-D).
NrasG12D and CBFβ-SMMHC reduce Bim-EL levels in preleukemic and leukemic cells. (A) Western blot analysis of Bim-EL expression in Lin– BM cells from control and Nras, and preleukemic cells from CM and Nras/CM mice; quantification relative to total Erk level (right panel). *P < .05. (B) Bcl2l11 transcript levels in preleukemic (Lin–) BM cells from control, Nras, CM, and Nras/CM mice relative to Actb by quantitative RT-PCR (n = 4, *P < .05). (C) Apoptosis analysis (Annexin V+/7-AAD–) of c-kit+-gated CM or Nras/CM leukemic cells (n = 4, *P < .05). (D) Western blot analysis of Bim-EL expression in CM or Nras/CM leukemic cells used in (C), and quantification relative to total Erk levels (right panel). *P < .05.
NrasG12D and CBFβ-SMMHC reduce Bim-EL levels in preleukemic and leukemic cells. (A) Western blot analysis of Bim-EL expression in Lin– BM cells from control and Nras, and preleukemic cells from CM and Nras/CM mice; quantification relative to total Erk level (right panel). *P < .05. (B) Bcl2l11 transcript levels in preleukemic (Lin–) BM cells from control, Nras, CM, and Nras/CM mice relative to Actb by quantitative RT-PCR (n = 4, *P < .05). (C) Apoptosis analysis (Annexin V+/7-AAD–) of c-kit+-gated CM or Nras/CM leukemic cells (n = 4, *P < .05). (D) Western blot analysis of Bim-EL expression in CM or Nras/CM leukemic cells used in (C), and quantification relative to total Erk levels (right panel). *P < .05.
Nras induces survival of Nras/CM leukemic cells through activation of MEK/ERK
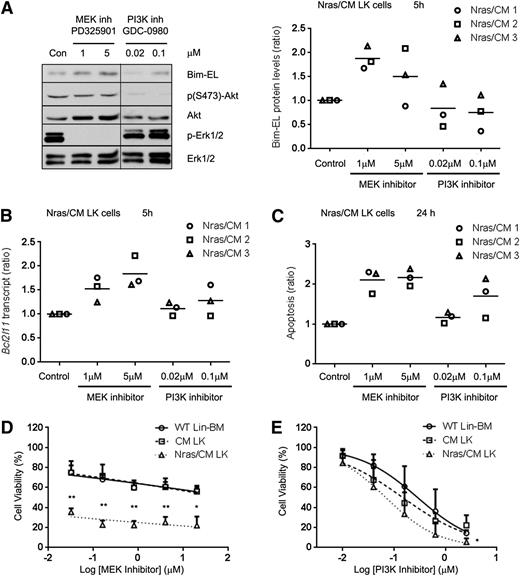
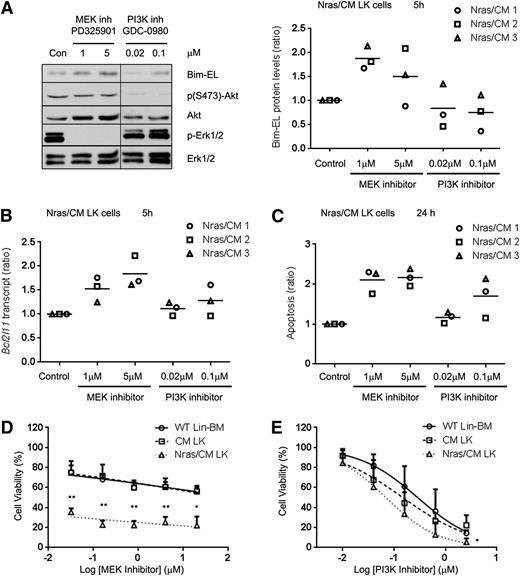
Previous studies have shown that Erk1/2 can induce proteasomal degradation of the Bim-EL isoform.33 Because NrasG12D reduced Bim-EL protein, but not transcript levels, we investigated whether NrasG12D regulates Bim-EL levels post-translationally in Nras/CM leukemic cells via the PI3K or MEK/ERK pathways. Biochemical analysis of ERK, AKT, and STAT5 phosphorylation revealed that CM leukemic cells have a heterogeneous activation of these proteins, and Nras/CM leukemic cells showed a consistent activation of ERK and AKT, but not STAT5, phosphorylation (supplemental Figure 5A). Five-hour treatment of Nras/CM leukemic cells from 3 mice with the MEK inhibitor PD325901, a potent inhibitor of myeloproliferative neoplasm in KrasG12D and Nf1−/− mice,34-36 increased Bcl2l11 transcript levels in a dose-dependent manner, and increased Bim-EL protein levels (Figure 6A-B). However, treatment with the PI3K inhibitor GDC-098037 did not significantly affect Bim transcript or protein levels. In addition, apoptosis of Nras/CM leukemic cells was significantly increased by treatment with the MEK inhibitor, but not consistently increased by treatment with the PI3K inhibitor at 24 hours (Figure 6C). Furthermore, we inquired whether inhibition of MEK/ERK or PI3K is important for leukemic cell growth. Treatment of Nras/CM leukemic cells with 0.032 µM PD325901 reduced significantly their viability when compared with CM leukemic and wild-type Lin– BM cells (35.4 ± 3.7%, 74.9 ± 11.5%, and 75.1 ± 6.9% viability, respectively; Figure 6D). The dose-response treatment of Nras/CM leukemic cells with GDC-0980 was similar to that of CM leukemic and wild-type Lin– BM cells (Figure 6E).
Inhibition of MEK/ERK pathway increased Bim-EL levels and reduced cell viability of Nras/CM leukemic cells. (A) Western blot analysis of Bim-EL, phospho-Akt, Akt, phospho-Erk1/2, and Erk1/2 levels in Nras/CM leukemic cells treated for 5 hours with dimethyl sulfoxide (Con), MEK inhibitor PD325901 or PI3K inhibitor GDC-0980 (left); quantification of Bim-EL protein levels normalized to Erk1/2 is shown for 3 independent Nras/CM clones (right). A vertical line has been inserted to indicate a repositioned gel lane. (B) Bcl2l11 transcript levels after the same 5-hour treatment were analyzed by quantitative RT-PCR and values were normalized to Actb; this experiment was performed in 3 independent Nras/CM clones, each in triplicate (average value of each clone relative to control is shown in the figure). (C) Quantification of apoptosis (Annexin V+/7AAD–) levels in c-kit+-gated Nras/CM leukemic cells treated for 24 hours; this experiment was performed in 3 independent Nras/CM clones, each in triplicate (average value of each clone relative to control is shown in the figure). (D-E) Dose-response curve of Lin– wild-type BM (open circle), CM leukemic cells (open square), or Nras/CM leukemic cells (open triangle) to (D) MEK inhibitor (PD325901) or (E) PI3K inhibitor (GDC-0980) for 48 hours. Cell viability was measured by CellTiter-Glo assays. Nonlinear regression curve fit was generated by inhibitor (log) vs normalized response-variable slope analysis. The mean of 3 independent clones from each group is shown. *P < .05, **P < .01.
Inhibition of MEK/ERK pathway increased Bim-EL levels and reduced cell viability of Nras/CM leukemic cells. (A) Western blot analysis of Bim-EL, phospho-Akt, Akt, phospho-Erk1/2, and Erk1/2 levels in Nras/CM leukemic cells treated for 5 hours with dimethyl sulfoxide (Con), MEK inhibitor PD325901 or PI3K inhibitor GDC-0980 (left); quantification of Bim-EL protein levels normalized to Erk1/2 is shown for 3 independent Nras/CM clones (right). A vertical line has been inserted to indicate a repositioned gel lane. (B) Bcl2l11 transcript levels after the same 5-hour treatment were analyzed by quantitative RT-PCR and values were normalized to Actb; this experiment was performed in 3 independent Nras/CM clones, each in triplicate (average value of each clone relative to control is shown in the figure). (C) Quantification of apoptosis (Annexin V+/7AAD–) levels in c-kit+-gated Nras/CM leukemic cells treated for 24 hours; this experiment was performed in 3 independent Nras/CM clones, each in triplicate (average value of each clone relative to control is shown in the figure). (D-E) Dose-response curve of Lin– wild-type BM (open circle), CM leukemic cells (open square), or Nras/CM leukemic cells (open triangle) to (D) MEK inhibitor (PD325901) or (E) PI3K inhibitor (GDC-0980) for 48 hours. Cell viability was measured by CellTiter-Glo assays. Nonlinear regression curve fit was generated by inhibitor (log) vs normalized response-variable slope analysis. The mean of 3 independent clones from each group is shown. *P < .05, **P < .01.
The sensitivity of preleukemic progenitors to MEK/ERK and PI3K inhibitors was tested in vitro using Lin– BM cells from Nras/CM mice 20 days after Cre activation. Five-hour treatment with MEK inhibitor increased 50% Bim-EL protein and 30% Bcl2l11 transcript levels, and increased apoptosis 30% at 24 hours (supplemental Figure 5B-D). Similar treatment with the PI3K inhibitor significantly increased Bcl2l11 transcript levels threefold, but the protein levels were not increased accordingly and the apoptosis was increased 30% (supplemental Figure 5B-D).
Taken together, these results show that the viability of Nras/CM leukemic cells depend on MEK/ERK signaling and not on PI3K/mTor signaling in vitro, and correlate with the expression of the apoptotic protein Bim-EL.
Bim knock-down reduces apoptosis of CM BM progenitor cells
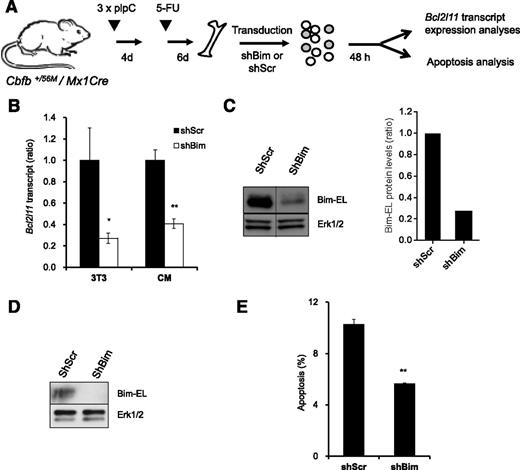
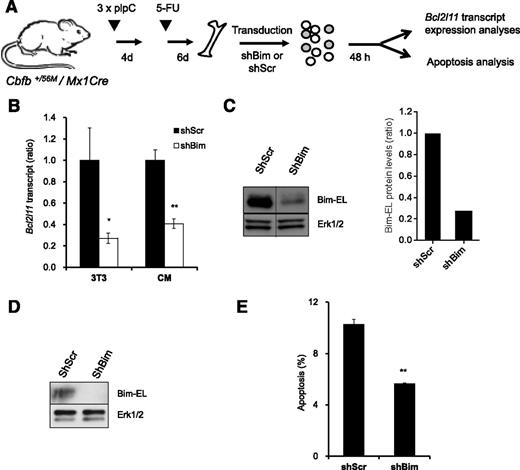
To investigate whether Bim is an important mediator of survival downstream of NrasG12D in Cbfβ-SMMHC–associated leukemia, we tested apoptosis in preleukemic BM cells expressing Cbfβ-SMMHC and reduced Bim levels (Figure 7A). The Bim shRNA vectors reduced 70% of Bim transcript and protein levels in NIH3T3 cells (Figure 7B-C), and reduced 60% of transcript levels and protein levels in sorted GFP+, 7-AAD– CM BM cells (Figure 7B,D). In addition, CM BM preleukemic cells transduced with Bim shRNA showed 45% reduction in apoptosis when compared with Scrambled shRNA–infected cells (Figure 7E). These data suggest that Bim is an important mediator of apoptosis in preleukemic cells expressing Cbfβ-SMMHC.
Reduction of Bim-EL levels inhibits apoptosis in CM preleukemic cells. (A) Experimental design of Bim knock-down strategy. (B) Relative Bcl2l11 transcript levels (quantitative RT-PCR) in puromycin-selected NIH-3T3 (3T3) or sorted GFP+7-AAD– CM preleukemic cells infected with either Scrambled shRNA (shScr) or Bim shRNA (shBim). *P < .05, **P < .01. (C) Western blot analysis of Bim-EL levels in puromycin-selected NIH-3T3 cells (left panel); quantification of Bim-EL protein levels normalized to Erk1/2 (right panel). A vertical line has been inserted to indicate a repositioned gel lane. (D) Western blot analysis of Bim-EL levels in sorted GFP+7-AAD– CM preleukemic cells. (E) Quantification of apoptosis (Annexin V+/7-AAD–) levels in c-kit+ GFP+ CM preleukemic cells infected with either Scrambled (shScr) or Bim (shBim) shRNA. **P < .01.
Reduction of Bim-EL levels inhibits apoptosis in CM preleukemic cells. (A) Experimental design of Bim knock-down strategy. (B) Relative Bcl2l11 transcript levels (quantitative RT-PCR) in puromycin-selected NIH-3T3 (3T3) or sorted GFP+7-AAD– CM preleukemic cells infected with either Scrambled shRNA (shScr) or Bim shRNA (shBim). *P < .05, **P < .01. (C) Western blot analysis of Bim-EL levels in puromycin-selected NIH-3T3 cells (left panel); quantification of Bim-EL protein levels normalized to Erk1/2 (right panel). A vertical line has been inserted to indicate a repositioned gel lane. (D) Western blot analysis of Bim-EL levels in sorted GFP+7-AAD– CM preleukemic cells. (E) Quantification of apoptosis (Annexin V+/7-AAD–) levels in c-kit+ GFP+ CM preleukemic cells infected with either Scrambled (shScr) or Bim (shBim) shRNA. **P < .01.
Discussion
AML results from the stepwise accumulation of mutations that drive transformation of hematopoietic stem and progenitor cells. The preleukemic compartment is thought to include a group of clonal progenitor cells with common founding mutation(s) and a combination of different subsequent mutations that deregulate their proliferation, survival, and differentiation programs.38-40 Recent studies demonstrated that preleukemic progenitors found in human AML survive chemotherapy and are a reservoir for relapse AML.41,42 Therefore, the elucidation of the cumulative functional contribution of each mutation toward leukemia is essential for the understanding of disease progression and the design of effective therapies targeting driver mutations. The inv16 chromosomal rearrangement is a founding mutation that creates a preleukemic myeloid population in the BM.12 However, inv16 is necessary, but not sufficient, for leukemogenesis.10-12 In this study, we show that NrasG12D, a frequent mutation found in inv16 AMLs, regulates the survival of the preleukemic cells though the Mek/Erk/Bim pathway, and synergizes with Cbfβ-SMMHC in leukemia development.
Recent studies have shown that NrasG12D conditional knock-in mice develop an indolent myeloproliferative phenotype, and eventually develop a diverse spectrum of hematologic cancers with long disease latency.20 Similarly, mice transplanted with NrasG12D BM develop a CMML-like phenotype only after a prolonged latency.21 Here we show that co-expression of NrasG12D and Cbfβ-SMMHC modified the cellular composition of the BM significantly, with a reduction in its cellularity because of a block in myelolymphoid differentiation (Lin+ cells). However, the preleukemic early progenitors (ST-HSCs and MPPs) and myeloid progenitors (CMPs) were increased. These results showed that CBFβ-SMMHC is dominant over NrasG12D because NrasG12D was unable to overcome the differentiation block imposed by CBFβ-SMMHC to induce myeloproliferation, and these results are consistent with data demonstrating that NRAS mutations are acquired as a secondary event in human inv(16) AML.16 The Nras/CM preleukemic progenitors remained in the BM and transformed to leukemia with a latency reduced from 21.43 weeks, as seen in the CM group, to 13.72 weeks, indicating that allelic expression of NrasG12D cooperated with Cbfβ-SMMHC in leukemia. In addition, the synergy was evident when expression of these oncoproteins was activated after engraftment into recipient mice, demonstrating that the synergy is cell-autonomous.
We have found that NrasG12D and Cbfβ-SMMHC contributed on the reduction of apoptosis in the preleukemic BM progenitors. This survival signal may direct the expansion of preleukemic cells and may participate in leukemia transformation. NRASG12D was shown to provide survival advantage of human umbilical cord blood cells expressing AML1-ETO,43 suggesting that NRASG12D-mediated pro-survival activity could be a general mechanism in leukemia. In addition, considering that Cbfβ-SMMHC has been shown to impair Runx1 function9 and that Runx1-loss reduced HSC apoptosis,44 it is possible that the pro-survival activity of Cbfβ-SMMHC could be mediated by Runx1 inhibition.
The analysis of protein levels of the BCL-2 family members revealed that Bim-EL protein levels correlated with apoptosis in preleukemic and leukemic cells. In preleukemic cells, NrasG12D expression decreased Bim-EL protein levels but not transcript levels, indicating that NrasG12D may affect Bim-EL levels by proteasome degradation though MEK/ERK pathway as previously reported.33,45 Interestingly, NrasG12D synergized with Cbfβ-SMMHC to decrease Bim-EL protein and transcript levels, which correlated with the increase in Bim-EL protein and transcript levels by the MEK inhibitor. Alternatively, PI3K inhibitor increased Bim-EL transcript, but not protein levels, probably because Mek/Erk pathway still actively decreased Bcl2l11 transcripts and degraded Bim-EL protein. Consistent with these results, knock-down of Bim-EL levels decreased apoptosis in preleukemic progenitor cells expressing Cbfβ-SMMHC. The pharmacologic experiments also revealed that expression of Bim-EL was regulated by the Mek/Erk pathway in the Nras/CM leukemic cells. These results suggest that Bim-EL may be a critical effector of apoptosis in the transformation of preleukemic progenitor cells.
Consistent with the regulation of Bim-EL levels, pharmacologic inhibition of NRASG12D activity showed that the oncogenic Nras activity seems to be modulated during leukemia progression. Our results show that leukemic cell viability depends primarily on the activity of the Mek/Erk pathway, suggesting that MEK inhibitors may efficiently reduce leukemia in the treatment of inv16 / NrasG12D AML.
In conclusion, allelic co-expression of Cbfβ-SMMHC and NrasG12D promote the survival of preleukemic progenitors by activation of the MEK/ERK pathway and inhibition of Bim-EL protein levels. The transgenic mice characterized in this study are an attractive genetic tool for mechanistic studies and for the development of efficacious AML-targeted therapies.
The online version of this article contains a data supplement.
The publication costs of this article were defrayed in part by page charge payment. Therefore, and solely to indicate this fact, this article is hereby marked “advertisement” in accordance with 18 USC section 1734.
Acknowledgments
This work was supported by grants from the National Cancer Institute (R01 CA140398) and the Alex’s Lemonade Stand Foundation for Childhood Cancer (L.H.C.), a Scholar Award from the Leukemia & Lymphoma Society (1334-08) (L.H.C.), and a Scholar Award from the American Society of Hematology (J.A.P.).
Authorship
Contribution: L.X. contributed to the design and execution of the experiments and manuscript preparation; J.A.P. contributed to the research and manuscript preparation; P.J.M.V. contributed to the analysis of gene expression levels in leukemia samples and manuscript preparation; and L.H.C. led the experimental design, discussion of results, and manuscript preparation.
Conflict-of-interest disclosure: The authors declare no competing financial interests.
Correspondence: Lucio H. Castilla, 364 Plantation St, Worcester MA 01605; e-mail: lucio.castilla@Umassmed.edu.


