Key Points
Retroviral vector clonal diversity and T-cell receptor diversity correlated with intensity of busulfan conditioning.
Some patients had stable dominant clones with retroviral vectors adjacent to known proto-oncogenes.
Abstract
Retroviral gene therapy has proved efficacious for multiple genetic diseases of the hematopoietic system, but roughly half of clinical gene therapy trial protocols using gammaretroviral vectors have reported leukemias in some of the patients treated. In dramatic contrast, 39 adenosine deaminase–deficient severe combined immunodeficiency (ADA-SCID) patients have been treated with 4 distinct gammaretroviral vectors without oncogenic consequence. We investigated clonal dynamics and diversity in a cohort of 15 ADA-SCID children treated with gammaretroviral vectors and found clear evidence of genotoxicity, indicated by numerous common integration sites near proto-oncogenes and by increased abundance of clones with integrations near MECOM and LMO2. These clones showed stable behavior over multiple years and never expanded to the point of dominance or dysplasia. One patient developed a benign clonal dominance that could not be attributed to insertional mutagenesis and instead likely resulted from expansion of a transduced natural killer clone in response to chronic Epstein-Barr virus viremia. Clonal diversity and T-cell repertoire, measured by vector integration site sequencing and T-cell receptor β-chain rearrangement sequencing, correlated significantly with the amount of busulfan preconditioning delivered to patients and to CD34+ cell dose. These data, in combination with results of other ADA-SCID gene therapy trials, suggest that disease background may be a crucial factor in leukemogenic potential of retroviral gene therapy and underscore the importance of cytoreductive conditioning in this type of gene therapy approach.
Introduction
The enzyme adenosine deaminase (ADA) is required for the degradation of adenosine and 2′-deoxyadenosine. Humans deficient for this enzyme, unlike mice, survive through live birth, although pleiotropic effects of ADA deficiency begin to appear soon thereafter. The most pronounced phenotype is the disease ADA-deficient severe combined immunodeficiency (ADA-SCID), characterized by a paucity of T, B, and NK cells as a result of adenosine and 2′-deoxyadenosine toxicity. Because ADA is needed during DNA catabolism, the toxic metabolites adenosine and 2′-deoxyadenosine accumulate to especially high levels in tissues with abundant apoptosis, such as the thymus. This early developmental block is the primary cause of T-cell deficiency, whereas B-cell deficiency appears to result from the collusion of absent T helper cell–mediated activation and maturation defects that have yet to be fully elucidated.1 Heightened adenosine and 2′-deoxyadenosine from DNA catabolism cause additional apoptosis, perhaps creating a positive feedback loop.
Retroviral gene therapy trials around the world have successfully treated dozens of ADA-SCID patients, none of whom have gone on to develop leukemia or other cancers.2-8 In contrast to the patients in the trial reported herein and despite the similarity between the retroviral vector backbones used, the majority of patients in a clinical trial for Wiskott-Aldrich syndrome (WAS) developed leukemias after treatment.9,10 Other retroviral trials for SCID-X1 and chronic granulomatous disease (CGD) using vectors based on murine leukemia virus or spleen focus forming virus have also observed vector-related leukemias and dysplastic events.11-14
In the present study, we report molecular evidence of genotoxicity from gammaretroviral gene therapy in the absence of dysplasia. One patient developed a dramatic, but stable and clinically benign, expansion of a vector-marked clone, likely in response to Epstein-Barr virus (EBV) infection. RNA-sequencing (RNA-seq) expression analysis of this clone yielded no evidence of gene dysregulation. We also report a correlation between the delivered dose of the chemotherapeutic conditioning agent busulfan and the diversity of engrafted vector-modified cells, as well as between delivered busulfan and the diversity of the T-cell repertoire in peripheral blood as indicated by T-cell receptor (TCR) β-chain rearrangement sequencing.
Methods
Gene therapy procedure
The clinical protocol has been described previously.5 Briefly, bone marrow was harvested from the iliac crest, and a backup was cryopreserved. Mononuclear cells were obtained by density centrifugation with Ficoll-Hypaque, and CD34+ cells were enriched for the 300 series with an Isolex 300i instrument (Baxter Therapeutics) and for the 400 series with a CliniMacs (Miltenyi Biotec Inc., Auburn, CA). For the 300 series patients, cells were split equally into 2 culture vessels coated with recombinant fibronectin fragment CH-296 and stimulated for 40 to 48 hours in X-VIVO 15 medium (Lonza) with 50 ng/mL stem cell factor (Amgen), 300 ng/mL Flt-3 ligand, 50 ng/mL megakaryocyte growth and differentiation factor, and 1% human serum albumin. Cells were then pelleted and resuspended in X-VIVO 15-based retroviral supernatant containing one of either MND-ADA or GCsapM-ADA supplemented with the above cytokines, and this was repeated twice at 24-hour intervals. For the 400 series patients, the protocol was the same except for the use of a single culture vessel and only the MND-ADA retroviral supernatant. At the end of the transduction period, cells were washed thrice with Plasma-Lyte 1% human serum albumin and suspended in 10 to 25 mL Plasma-Lyte 1% human serum albumin to constitute the final cell product. Busulfan was administered intravenously in 1 or 2 doses during the ex vivo transduction procedure, and the dosage was 65 to 90 mg/m2 total for the 300 series patients and 90 mg/m2 (∼4 mg/kg) for the 400 series patients.
Vector copy number (VCN) measurement
Droplet digital polymerase chain reaction (ddPCR) was performed using the Bio-Rad QX100 Droplet Digital PCR System. Template DNA not exceeding 100 000 copies of vector or genomic normalization targets was used to set up a 20 μL ddPCR reaction with MND/GCSAP and uc378 primers and probes, with 2X ddPCR Supermix for Probes (Bio-Rad), 400 nM final concentration of each primer, 200 nM final concentration of each probe, and 1 unit of DraI enzyme (New England Biolabs) (see supplemental Table 1 [available on the Blood Web site] for all primer sequences). In the cases of integration site–specific VCN measurement, the MND/GCSAP primers were substituted with integration site–specific primer pairs (labeled 304-1 through 403-1), which also flanked the FAM-MND/GCSAP U5 probe.
Integration site sequencing
Genomic DNA was extracted from cryopreserved peripheral blood mononuclear cell (PBMCs). Template DNA amount used was dependent on availability and capped at the lesser of 75 000 proviral molecules or 150 000 haploid genomes, as estimated by ddPCR on DNA samples. An adaptation of nonrestrictive linear amplification-mediated PCR (nrLAM-PCR) was used to produce integration site sequencing libraries for Illumina sequencing.5,15-21 Fifty cycles of linear amplification were performed using AccuPrime Taq with primers MNDright linear and GCSAPright linear (94°C × 2 minutes; 50 cycles of 94°C × 15 seconds and 65°C × 5 seconds). Linear reactions were purified using 1.5 volumes of AMPure XP beads (Beckman Genomics) and captured onto M-280 Streptavidin Dynabeads (Invitrogen Dynal). Captured single-stranded DNA was ligated to read 2 linker using CircLigase II (Epicentre) in a 10 µL reaction at 65°C for 1 to 2 hours. Thirty cycles of PCR were performed on these beads using Herculase II polymerase and primers MNDright PCR, GCSAPright PCR, and index n PCR (n between 1 and 136), where n was used for only 1 sample per Illumina sequencing lane. PCR products were quantified by densitometry after gel electrophoresis, mixed in equimolar proportion, purified with 1.2 volumes of AMPure XP beads, and quantified by ddPCR using P5 and P7 primers and FAM-read 2 probe. Paired-end 100 nt sequencing was run on Illumina HiSequation 2000 instruments using v3 flow cells and an equimolar mix of custom read 1 sequencing primers GCSAPright read 1 and MNDright read 1. Raw sequence reads were processed on the University of California, Los Angeles (UCLA) Hoffman2 computing cluster using a custom Python parallel pipeline and wrapper around Bowtie2, which was used to map vector-adjacent sequences to the hg19 build of the human genome.22 Only integration sites supported by at least 4 paired-end sequence reads were kept for analysis, as this was found in other work of ours to minimize the cross-calling of integration sites between samples. Within each sequencing library prepared from a DNA sample, integrations within a 10-bp window were collapsed to the site with the highest readcount to reduce the number of sequencing artifacts in the data set. Subsequent analyses were performed using the iPython scientific computing environment.23
TCR β-chain CDR3 region sequencing
An adaptation of a previously reported multiplex PCR procedure was used to amplify CDR3 VDJ junctions from PBMC genomic DNA samples.24 The 2 PCR strategy used in the previous study was simplified into a 1 PCR strategy to minimize PCR bias and contamination risk. Fifty-microliter reactions were set up with AccuPrime Taq Polymerase, AccuPrime buffer I, 77 nM final concentration of each J primer, 1.76 nM final concentration of each V primer, and 800 nM final concentration of index n primer. Template DNA amount was dependent on availability and capped at 150 000 haploid genomes, as estimated by ddPCR. Thirty-five cycles of PCR were performed, and products were then quantified by densitometry after gel electrophoresis, mixed in equimolar ratio, purified with 1.2 volumes of AMPure XP beads, and quantified via ddPCR using P5/P7 primers and FAM-read 2 probe. Four PCR reactions on individual samples of genomic DNA were sequenced to allow for diversity estimation by Chao2 estimation.25 A custom Python wrapper script around the MiTCR software package was used to process paired end Illumina sequencing data, infer V and J segment identity, and extract CDR3 region nucleotide and amino acid sequences.26 Comparison of multiplex PCR on genomic DNA and 5′ rapid amplification of cDNA ends PCR via the TCR-ligation-anchored-magnetically captured PCR (TCR-LA-MC PCR) method on RNA extracted from the same cell pellets of healthy donors suggested method-specific biases in segment detection, but all segments were detected.27
Flow cytometry and fluorescence-activated cell sorting
Whole blood was stained with PE-Cy7 Mouse Anti-Human CD19 (BD cat no. 557835), APC Mouse Anti-Human CD11b/Mac-1 (BD cat no. 550019), PE Mouse Anti-Human CD56 (BD cat no. 340363), and Brilliant Violet 421 Mouse Anti-Human CD3 (BD cat no. 562426). After red cell lysis with PharmLyse (BD cat no. 555899), sorting was performed on a BD FacsARIA instrument.
Natural killer (NK) cell analysis was performed with NKG2C-PE clone 134591 (R&D Systems), CD56-FITC, and CD3-BV421 antibodies.
RNA-seq
RNA and DNA were isolated from sorted NK cells using the AllPrep DNA/RNA Mini Kit. RNA was quantified with the RiboGreen reagent, and 10 ng was used to generate complementary DNA using the Nugen Ovation RNA-Seq System v2 kit. Complementary DNA was then readied for Illumina paired-end 100-bp sequencing with the Nugen Encore Rapid Library System and sequenced on an Illumina HiSequation 2000 using a v3 flowcell. Raw reads were aligned with STAR v2.3.0, and gene-level expression analysis and differential expression analysis were performed using cufflinks and cuffdiff v2.1.1.28-31
Data and statistical analyses
The iPython interactive computing environment was used for all statistical analyses, which employed the packages SciPy, NumPy, and Matplotlib.23,32,33
The Chao2 method was applied by first counting the number of replicated libraries from each DNA sample in which a particular integration site was detected. For example, if 4 libraries were prepared from a 6-month PBMC DNA sample, and integration site 1 were detected in only 1 of the 4 samples, the result would be 1. To estimate the total number of sites present (ie, the number observed plus the number not observed), the Chao2 equation uses only the total number of integration sites observed, the number of sites detected in exactly 1 sampling, and the number of sites detected in exactly 2 samplings. More details are available in another study we conducted using this method, as well as in the original Chao2 manuscript.25,34
Study approval
The protocol (www.clinicaltrials.gov, #NCT00018018 and #NCT00794508) underwent reviews by the Institutional Review Boards and Institutional Biosafety Committees at Children’s Hospital Los Angeles (CHLA), UCLA, and the National Institutes of Health, and by the National Institutes of Health Office of Biotechnology Activities Recombinant DNA Advisory Committee (9908-337). It was conducted under BB IND #8556 from the US Food and Drug Administration. The National Heart, Lung, and Blood Institute Cell Therapy/Gene Therapy Data Safety Monitoring Board served as the safety monitoring entity. All human trial participants (or legal guardians for minors) provided written informed consent in accordance with the Declaration of Helsinki.
Results
Integration preferences and common insertion sites (CISs) of therapeutic vectors
We prepared nrLAM-PCR libraries for Illumina sequencing from 168 genomic DNA samples collected from 15 patients treated with ex vivo retroviral gene therapy in the context of an autologous bone marrow transplant. Five of these patients have been reported on previously (the “300 series”: 301, 303, 304, 305, and 306), and they were treated with 2 vectors to compare the efficacy of the differing viral long terminal repeats.5 The remaining 10 patients were treated on a new trial using only the MND-ADA vector (the “400 series”: 401-410), which has performed better in the laboratory and in patients than vectors more closely related to murine leukemia virus.5,8,35 Molecular methods were designed to detect both vectors with equal efficiency, and except where noted, integrations of the 2 vectors are reported together. Cumulatively across all patients and samples, we sequenced 91 680 integration sites with 49 612 692 sequence reads. We observed a pronounced integration bias around the transcription start site, consistent with that observed in other gammaretroviral gene therapy trials (supplemental Figure 1).
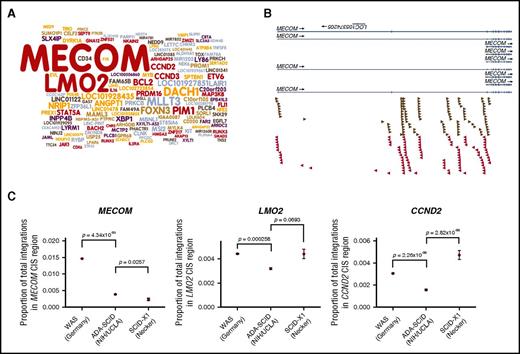
In order to call CISs in our data set, we implemented a previously reported kernel convolution approach in the Python programming language.36 This yielded 1845 significant CISs (empirical P value vs random data <.05), which show remarkable overlap with those reported using alternative statistical methods in other retroviral clinical gene therapy trials (Figure 1A and Table 1). A CIS near MECOM contained 187 ISs, the most of all CISs detected in our patients, and ISs clustered near the MDS1 and EVI1 promoters, as well as the putative enhancer region near exon 2 of MDS1 (Figure 1B). The second most frequently targeted gene, LMO2, incurred 155 ISs, mostly upstream of the gene near the promoter (supplemental Figure 2). Interestingly, a meta-analysis of IS data sets from other gammaretroviral clinical gene therapy trials revealed that a trial treating WAS using mobilized peripheral blood–derived hematopoietic stem and progenitor cells (HSPCs) had significantly more ISs detected in the MECOM CIS target area defined by our CIS analysis, whereas a trial treating SCID-X1 using bone marrow–derived HSPCs without chemotherapeutic preconditioning had fewer ISs in the MECOM CIS target area (Figure 1C).9,37 Proportionally speaking, these ADA-SCID patients also had significantly fewer ISs in LMO2 and CCND2 than patients in the WAS and SCID-X1 trials, 2 genes involved in leukemias in other trials.
Cancer-related genes are targeted and dysregulated, causing expansions. (A) Frequently targeted genes. Gene name size corresponds to frequency with which the gene’s transcription start site was the nearest transcription start site to an integration site. Gene names in red are associated with human or murine leukemias.38,39 (B) Integration clusters near MECOM among all patients. ISs in the sense and antisense orientation relative to MECOM are denoted by arrows. (C) A lower proportion of ISs was near the MECOM CIS region defined in the present analysis than in a retroviral WAS trial. The proportion of total integrations within the MECOM CIS area called by the kernel convolution approach was quantified for data sets from other clinical gene therapy trials. A Fisher exact test was used to compare the proportions, and P values are indicated. Error bars represent Gaussian approximation of a binomial 95% confidence interval.
Cancer-related genes are targeted and dysregulated, causing expansions. (A) Frequently targeted genes. Gene name size corresponds to frequency with which the gene’s transcription start site was the nearest transcription start site to an integration site. Gene names in red are associated with human or murine leukemias.38,39 (B) Integration clusters near MECOM among all patients. ISs in the sense and antisense orientation relative to MECOM are denoted by arrows. (C) A lower proportion of ISs was near the MECOM CIS region defined in the present analysis than in a retroviral WAS trial. The proportion of total integrations within the MECOM CIS area called by the kernel convolution approach was quantified for data sets from other clinical gene therapy trials. A Fisher exact test was used to compare the proportions, and P values are indicated. Error bars represent Gaussian approximation of a binomial 95% confidence interval.
Genes near CISs were significantly enriched for signaling functions, such as phosphorylation, consistent with the hypothesis that integrations dysregulate growth promoting genes such as kinases and cause clonal expansions or increased cell survival after transplantation (Table 2).
Clonal diversity varies widely between patients
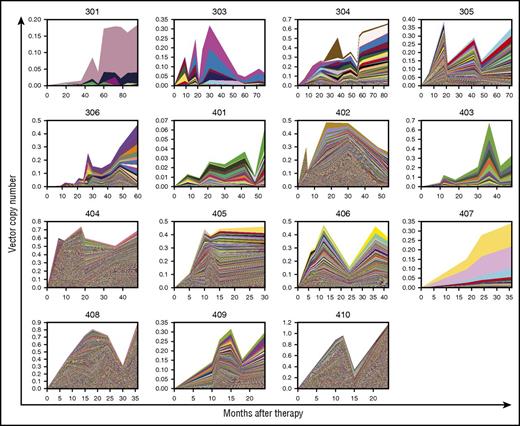
We observed a large range of clonal diversities among the 15 patients, which can be appreciated qualitatively by comparing the clonality plots of patients with highly polyclonal reconstitution (eg, 404, 408, and 410) with those of patients with relatively oligoclonal makeup (eg, 301, 303, and 407) (Figure 2). In general, we found clonal composition to be stable over multiple years in patients with oligoclonality, whereas clones in patients with more diverse reconstitution were not consistently detected across time points. This could be caused either by greater clonal turnover in the patients with more clonal diversity or by more shallow sampling of integration sites in patients with more diversity.
Clonal composition and dynamics over time. Each colored area represents a unique integration site over time, and the total height of the colored areas at a given time point indicates the VCN as measured by ddPCR.
Clonal composition and dynamics over time. Each colored area represents a unique integration site over time, and the total height of the colored areas at a given time point indicates the VCN as measured by ddPCR.
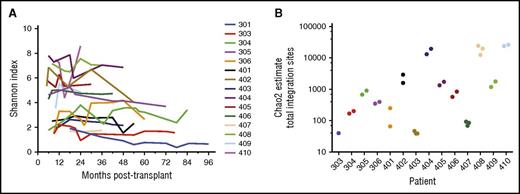
We calculated the Shannon index using readcounts from IS sequencing to estimate clonal complexity and evenness over time, and we observed that most patients exhibited a relatively consistent Shannon index over time (Figure 3A). Additionally, we made sequencing libraries from repeated samples of single genomic DNA samples in order to apply the Chao2 method to estimate total diversity within the samples (Figure 3B). The patients with the lowest diversity as indicated by stacked color clonality plots also had the lowest Shannon index and Chao2 estimated diversity values over time, whereas those with higher apparent diversity showed the highest values. In general, the 300 series patients showed lower diversity by all 3 metrics. Notably, the 3 patients with the highest diversity (404, 408, and 410) are the only ones with sufficient B-cell reconstitution to permit discontinuation of gammaglobulin replacement.8
Clonal diversity indicated by integration sites among patients. (A) Shannon indices calculated using the numbers of unique integration sites and their readcounts over time among patients. (B) Chao2 estimates of total integration sites in patients calculated by repeated sampling and sequencing of integration sites in PBMC DNA samples among patients. Each point represents a unique PBMC DNA sample that was sampled 4 times.
Clonal diversity indicated by integration sites among patients. (A) Shannon indices calculated using the numbers of unique integration sites and their readcounts over time among patients. (B) Chao2 estimates of total integration sites in patients calculated by repeated sampling and sequencing of integration sites in PBMC DNA samples among patients. Each point represents a unique PBMC DNA sample that was sampled 4 times.
Clinically benign genotoxicity
None of the patients in this trial developed leukemia or presented any signs of dysplasia. However, our CIS analysis revealed numerous integrations in leukemia-related genes. Although it is generally accepted that gammaretroviral vectors with intact long terminal repeat enhancers often upregulate genes near the IS, there is still some doubt over whether this or preferential integration into certain genomic sites contributes more to the CIS observed in trials. To shed light on this issue in our trial, we used sequence readcounts to estimate the relative abundances of clones with integrations near a set known leukemia-related genes generated in another study and near a set of genes homologous to retrovirally tagged cancer gene database (RTCGD) mouse genes identified in hematopoietic cancers caused by retroviral and transposon mutagenesis.38,39 We compared these estimates with those of all other clones for both gene sets of interest. In both cases, we found that clones with ISs near genes of interest were statistically more abundant, as indicated by the average proportion of sequence reads they accounted for within samples (supplemental Figure 3).
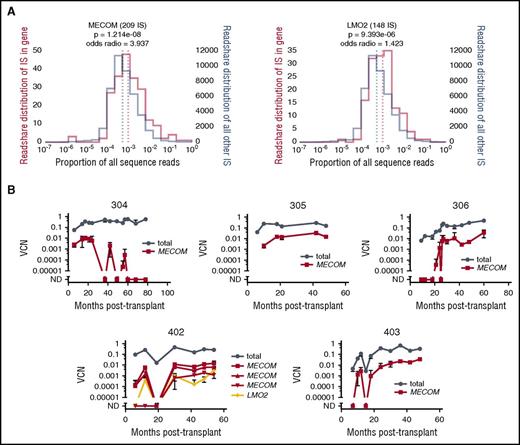
We also looked closely at the abundances of clones with ISs near MECOM and LMO2, the most frequently observed IS-proximal genes in this trial. These clones were statistically more abundant, as indicated by a higher average readcount compared with all other clones (Figure 4A).
Clones with integrations near MECOM, near sets of leukemia-related genes and near a set of retrovirally tagged cancer genes (RTCGD) are more abundant on average than other clones. (A) Clonal abundance estimation from sequence readcounts for clones with integrations near MECOM and LMO2. (B) Integration site-specific clonal tracking via ddPCR of clones with integrations near MECOM and LMO2.
Clones with integrations near MECOM, near sets of leukemia-related genes and near a set of retrovirally tagged cancer genes (RTCGD) are more abundant on average than other clones. (A) Clonal abundance estimation from sequence readcounts for clones with integrations near MECOM and LMO2. (B) Integration site-specific clonal tracking via ddPCR of clones with integrations near MECOM and LMO2.
We observed that some ISs near MECOM and LMO2 accounted for >1% of sequence readcounts at some time points. In order to assess whether these ISs may have caused clones to expand over time, we performed IS-specific ddPCR to estimate their abundances longitudinally. Most of these clonal abundances tracked with the total abundance of transduced cells over time, suggesting that these ISs did not significantly alter clonal behavior over the long term (Figure 4B). This contrasts with a gene therapy trial for CGD, in which clonal expansion followed by clonal collapse was seen for multiple clones with ISs near MECOM.14
Stable and benign clonal dominance in a clinically well patient
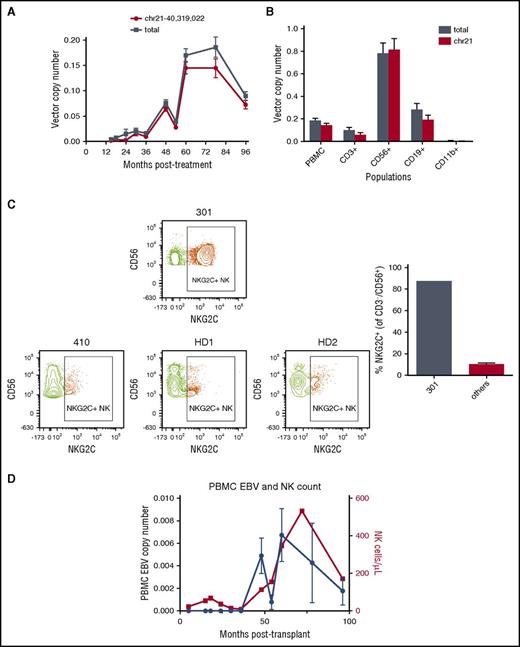
From ∼1 to 2 years posttransplant onward, we observed a marked expansion and dominance of a vector-marked clone in patient 301 via integration site sequencing (Figure 2). We confirmed the dominance of this clone via IS-specific ddPCR and found that it has repeatedly accounted for ∼85% of marked clones for the past 7 years (Figure 5A). Despite this dramatic molecular phenomenon, the patient has presented no symptoms of dysplasia over time. The integration occurred in a gene poor region of chromosome 21, ∼140 kb from the promoter of ETS2 and 285 kb from the promoter of ERG. Cell lineage sorting and VCN measurement indicated that the majority of both total and IS-specific vector marked cells were in the NK lineage, and furthermore, that the majority of NK cells were derived from this single clone (Figure 5B).
High frequency and dominance of clone with integration on chr21 in patient 301. (A) IS-specific ddPCR clonal tracking of dominant clone in patient 301. (B) Total and IS-specific ddPCR VCN measurement in sorted lineages. (C) NKG2C+ population expansion in patient 301 compared with another ADA trial patient and 2 healthy donors. Whole blood was stained with CD3, CD19, CD11b, CD56, and NKG2C antibodies and analyzed via flow cytometry. A CD56-FITC vs NKG2C-PE plot is shown for CD3−CD19−CD11b− cells gated for characteristic lymphoid forward and side scatter. (D) EBV copy number correlates with NK cell count in patient 301. EBV copy number was determined in PBMC samples via ddPCR for the BALF5 gene.
High frequency and dominance of clone with integration on chr21 in patient 301. (A) IS-specific ddPCR clonal tracking of dominant clone in patient 301. (B) Total and IS-specific ddPCR VCN measurement in sorted lineages. (C) NKG2C+ population expansion in patient 301 compared with another ADA trial patient and 2 healthy donors. Whole blood was stained with CD3, CD19, CD11b, CD56, and NKG2C antibodies and analyzed via flow cytometry. A CD56-FITC vs NKG2C-PE plot is shown for CD3−CD19−CD11b− cells gated for characteristic lymphoid forward and side scatter. (D) EBV copy number correlates with NK cell count in patient 301. EBV copy number was determined in PBMC samples via ddPCR for the BALF5 gene.
In order to determine whether vector-mediated gene dysregulation could have played a role in the expansion of this clone, we performed RNA-seq on sorted T- and NK-lineage cells, reasoning that because these populations contained the highest fractions of the clone of interest, they would present the best chance of detecting any possible gene upregulation. Cells were sorted from 2 healthy donors for comparison. None of the genes near the ISs, including ERG and ETS2, were more highly expressed in the patient samples than in the healthy donors, and no novel transcripts near the ISs were observed either (supplemental Figures 4 and 5). There was, however, a statistically significant higher expression of KLRC2 in the NK lineage. This gene encodes NK cytotoxicity receptor NKG2C, which is implicated in the acute response to cytomegalovirus infections.40,41 We analyzed whole blood from the patient via flow cytometry and found a striking abundance of NKG2C+ cells in the CD56+CD3− NK lineage, consistent with the ∼16-fold higher KLRC2 expression seen compared with healthy controls with RNA-seq (Figure 5C). Although it is a controversial idea in the literature, we hypothesize that this expansion occurred in response to a chronic, low level Epstein-Barr viremia, the onset of which coincided with the beginning of NK lineage expansion (Figure 5D).42,43
T-cell repertoire diversity correlates with vector integration site diversity
In order to estimate the adaptive immunological repertoire of these patients, we performed high-throughput sequencing of the CDR3 region of the TCR β-chain rearrangements in PBMC DNA samples via an adaptation of a reported strategy.24 The data were analyzed with custom Python scripts and the MiTCR alignment package.26 In all, 85 395 590 sequence reads were attributed to CDR3 regions in 34 DNA samples covering all patients. Four sequencing reactions were run on each DNA sample to estimate total diversity using the Chao2 mark-recapture method.25
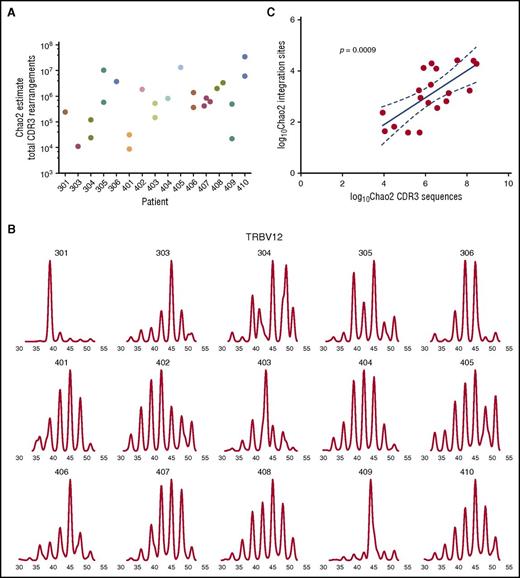
We observed a trend similar to that in the integration site diversities among patients, in that the 400 series patients overall had a higher CDR3 diversity than the 300 series patients (Figure 6A). These values track with plots of CDR3 length for rearrangements involving a single V segment, which show a nearly Gaussian distribution in patients with high Chao2 estimates, such as 410 and 408, and a skewed distribution in those with lower Chao2 estimates, such as 304 and 301 (Figure 6B). Prompted by the apparent relationship between the integration site and TCR rearrangement diversity metrics, we correlated the Chao2 estimates of diversity for both and found a significant positive correlation (Figure 6C). This could indicate that the diversity of vector-modified clones, which is indicative of engraftment efficiency, drives T-cell repertoire, or perhaps that the 2 results rely on other common factors.
TCR diversity by high-throughput sequencing. (A) Chao2 estimates of total CDR3 rearrangements in PBMC samples. (B) CDR3 lengths for rearrangements involving V segment 12. (C) Linear regression of Chao2 estimates of integration site and CDR3 sequence total diversities. Dotted lines represent 95% confidence interval, and P value indicates probability that slope is zero.
TCR diversity by high-throughput sequencing. (A) Chao2 estimates of total CDR3 rearrangements in PBMC samples. (B) CDR3 lengths for rearrangements involving V segment 12. (C) Linear regression of Chao2 estimates of integration site and CDR3 sequence total diversities. Dotted lines represent 95% confidence interval, and P value indicates probability that slope is zero.
Investigating determinants of the diversity of modified clone engraftment and T-cell development
We next sought to explore whether any parameters of the gene therapy procedure could be determinants of the varied diversities of engrafted vector-modified clones and of developing T-cell clones among patients. Unlike SCID-X1 gene therapy, in which a strong selection for corrected cells exists because of the lack of growth factor receptors on uncorrected cells, ADA-SCID gene therapy in humans has required the use of chemotherapeutic conditioning agents, such as busulfan or melphalan in order to achieve long-term and efficient engraftment of corrected cells.2,5,44 We therefore focused on the delivered dose of busulfan, which we estimated by high-performance liquid chromatography measurement of busulfan concentrations at successive times after administration of the drug, and transduced bone marrow cell dose.
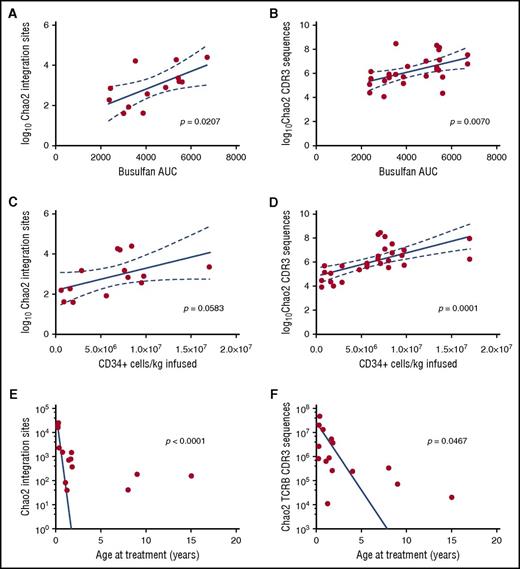
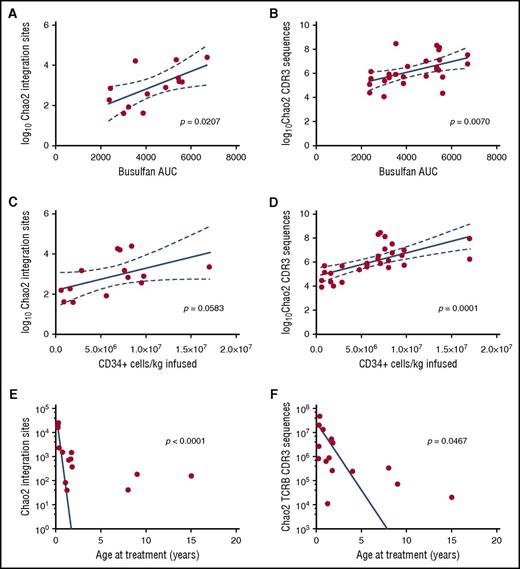
Vector integration site diversity estimates correlated positively with both busulfan area under the curve (AUC) and administered cell dose, although only the correlation with busulfan AUC was significant (Figure 7A, C). TCR rearrangement diversity estimates showed a significant positive correlation with both busulfan AUC and cell dose (Figure 7B, D). These data are consistent with the hypothesis that both conditioning intensity and transduced bone marrow cell dose are critical determinants of engraftment efficiency of gene therapy corrected cells.
Correlation of integration site and TCR rearrangement diversity with conditioning, cell dose, and age at treatment. (A-D) Dotted lines represent 95% confidence interval. (A-F) P value indicates probability that the observed values resulted from a relationship with slope zero.
Correlation of integration site and TCR rearrangement diversity with conditioning, cell dose, and age at treatment. (A-D) Dotted lines represent 95% confidence interval. (A-F) P value indicates probability that the observed values resulted from a relationship with slope zero.
Thymic function is known to decline with age, and we therefore also looked for an association between patient age at transplant and vector integration site diversity, as well as between age and TCR rearrangement diversity. Diversity estimates for both showed significant inverse associations with age, indicating that younger patients develop more diverse grafts as reflected by T-cell diversity and transduced cell clone diversity (Figure 7E-F).
Discussion
In this study, we report that retroviral gene therapy for ADA-SCID in an autologous bone marrow transplant setting continues to be safe among 15 patients after 3 to 9 years of follow-up. We observe an integration profile that is very similar to those reported in other clinical gene therapy trials, although we see significant deviations in integration site detection frequencies in certain genomic regions, such as MECOM, LMO2, and CCND2. These differences are most plausibly the result of differences in the cell sources and cytoreductive preconditioning regimens used. For example, HSPC mobilization with myeloid-stimulating cytokines may preferentially activate myeloid proliferation genes such as MECOM, thus rendering it a more likely target of integration, or it may preferentially stimulate the mobilization of myeloid-biased clones that either express higher levels of MECOM or are more affected by insertional upregulation of MECOM. These effects would be predicted to lead to the more frequent detection of clones bearing integration sites near MECOM observed in retroviral trials for WAS and for X-CGD than in this trial for ADA-SCID.
It is not known why clonal transformations have not occurred in ADA-SCID, despite the clear demonstration, both in this paper and those from other trials using gammaretroviral vectors for ADA-SCID, of expanded clones with integrants near proto-oncogenes that have caused leukoproliferation in every other disorder that had high frequencies of integrations of gammaretroviral vectors.4,6 One can speculate that the myeloid abnormalities that have been observed in ADA-deficiency may limit leukoproliferation.44 Alternatively, the trans-correction of the metabolic abnormalities in ADA-SCID, the basis for immune reconstitution with enzyme replacement therapy, decreases the proliferative pressure on the gene-corrected stem cells (or lymphoid progenitors) by allowing some noncorrected cells to survive. Potentially, the lack of cytoreductive conditioning in SCID-X1 trials led to strong competition and proliferative stress of corrected clones, which is absent in ADA-SCID because of the inability of corrected clones to engraft efficiently without conditioning.
By using sequence readcount data, we also demonstrate in a more direct fashion than previous studies that clones bearing integration sites near cancer-related genes are more abundant than others. We believe this capability is afforded by our use of an improved nonrestrictive nrLAM-PCR protocol, which enables clone size estimation using sequence readcounts.
One patient, who remains clinically well, developed and has maintained a near monoclonal state in his PBMCs. Detailed characterization showed that this is not correlated with any detectable gene dysregulation, and we hypothesize that the clonal expansion occurred in an NK cell subpopulation expressing cytotoxicity receptors that weakly recognize an unidentified aspect of EBV infection.
Finally, we use statistical clonal diversity estimates from repeated sampling of genomic DNA to investigate potential determinants of HSPC engraftment and T-cell repertoire development in ADA-SCID patients receiving gene therapy. We found that the intensity of cytoreductive conditioning and cell dose positively correlate with the diversity of engrafted clones and with the diversity of the T-cell repertoire, as indicated by the estimated total number of TCR rearrangements. Our companion clinical study found no statistical correlation between discontinuation of IV immunoglobulin therapy and cell dose or busulfan dose, which we attribute to the binary nature of that data. It is tempting to conclude that the detailed molecular data obtained from sequencing TCR rearrangements uncover more subtle correlations between treatment parameters and outcomes in patients. These data are consistent with the fact that ADA-SCID has seen multiple unsuccessful gene therapy trials without conditioning and multiple successful trials with conditioning, and they further underscore the importance of effective cytoreduction in treating this disease with gene therapy. We also observed a significant negative association between age at treatment and TCR rearrangement diversity, as well as between age and vector integration site diversity. As these metrics correlate with therapeutic success as indicated by antibody production and lack of need for ADA enzyme replacement therapy, our results suggest that treating ADA-SCID patients with gene therapy earlier could result in better immunity.
The online version of this article contains a data supplement.
The publication costs of this article were defrayed in part by page charge payment. Therefore, and solely to indicate this fact, this article is hereby marked “advertisement” in accordance with 18 USC section 1734.
Acknowledgments
The authors acknowledge the patients and families who participated in the trial, without whom this work would not be possible. The Broad Stem Cell Research Center Flow Cytometry and High-Throughput Sequencing Cores were both essential for these experiments.
This work was supported by a Clinical Research Award from the Saban Research Institute of CHLA, a Distinguished Clinical Scientist Award (2000-654) from the Doris Duke Charitable Foundation, and the US Food and Drug Administration (1 RO1 FD003005). The Clinical Gene Therapy Core Laboratory of the CHLA/University of Southern California General Clinical Research Center (MO1 RR0043) and the UCLA General Clinical Research Center also helped support this study (MO1 RR000865). Support was also received from the intramural funds of National Human Genome Research Institute, National Institute of Diabetes and Digestive and Kidney Diseases, and National Cancer Institute, National Institutes of Health. A.R.C. was supported by the Philip J. Whitcome Predoctoral Fellowship from the UCLA Molecular Biology Institute and the Ruth L. Kirschstein National Research Service Award (GM007185).
Authorship
Contribution: A.R.C. and G.R.L. designed experiments, performed experiments, analyzed data, and wrote the manuscript; K.S., D.A.C.-S., A.D., R.S., and F.C. performed the clinical trial, collected patient samples and data, and approved the final manuscript; M.P. provided bioinformatics mentorship; and D.B.K. directed the clinical trial and experiments and wrote the manuscript.
Conflict-of-interest disclosure: D.A.C.-S. has consulted for Orchard Therapeutics and is currently an employee with ownership interests (stock options) at Orchard Therapeutics. D.B.K. is a member of the Scientific Advisory Board of Orchard Therapeutics. The remaining authors declare no competing financial interests.
The current affiliation for D.A.C.-S. is Orchard Therapeutics, London, United Kingdom.
Correspondence: Donald B. Kohn, 3163 Terasaki Life Science Building, 610 Charles E. Young Dr South, Los Angeles, CA 90095; e-mail: dkohn1@mednet.ucla.edu.

