Key Points
Exposure to melphalan and bortezomib and quality of response to up-front treatment prolong time to second-line therapy in AL amyloidosis.
Patients who need second-line therapy after initial response have a good outcome if they are rescued before cardiac progression.
Abstract
The management of light chain (AL) amyloidosis has improved in recent years thanks to accurate biomarker-based staging systems and response criteria and availability of novel effective therapies. However, previous studies have focused on newly diagnosed patients, and little is known on relapsed patients, despite the fact that trials of new agents are often performed in this setting. In the present study, we report the outcome of 259 patients who responded to up-front therapy. Ninety-two patients (35%) needed second-line therapy after a median of 49 months. Cardiac and renal progression were observed in 22% and 12% of patients who received second-line therapy, respectively. Complete response after up-front treatment and frontline therapy with combined bortezomib, melphalan, and dexamethasone independently prolonged time to second-line therapy. Median survival of relapsing patients was 59 months. Patients who had a “high-risk dFLC progression,” which we defined as a difference between involved and uninvolved free light chains (dFLC) of >20 mg/L, a level >20% of baseline value, and a >50% increase from the value reached at best response, had a shorter survival after initiation of second-line therapy on univariate, but not on multivariate, analysis, where cardiac progression was the only independent predictor of survival after starting rescue treatment. Patients with AL amyloidosis who need second-line therapy after response to up-front treatment generally have a good outcome. A “high-risk dFLC progression” should trigger rescue treatment, and cardiac progression should not be awaited.
Introduction
The introduction of biomarkers of clonal and organ disease has greatly improved the management of patients with light chain (AL) amyloidosis, allowing accurate treatment selection based on risk stratification.1 Our understanding of the biology of the amyloidogenic plasma cell clone is also improving,2-4 leading to better ability to predict patients’ outcome based on multiparametric flow cytometry,5 revealing differential susceptibility to melphalan and bortezomib based on cytogenetic abnormalities,6-9 and indicating features that can be exploited for the design of targeted therapies,10,11 moving toward a more personalized treatment approach. These advancements, coupled with the availability of new effective drugs, resulted in a significant improvement of patients outcome over the years.12,13 Moreover, the availability of validated criteria for early assessment of hematologic and organ response, which can reliably predict overall survival (OS) and progression to dialysis14,15 and have been proposed as surrogate end points for clinical trials,16 are accelerating the development of novel therapeutic agents. Currently, up-front treatment is based on autologous stem cell transplant (ASCT) and bortezomib combinations,17-19 and an increasing number of novel agents, such as novel proteasome inhibitors, third-generation immunomodulatory drugs, or anti plasma cell antibodies, are being tested in relapsed and refractory patients.20-25 Moreover, different therapeutic approaches targeting the amyloid deposits are being developed.26
However, most of currently available data on the natural history and outcome of AL amyloidosis refer to newly diagnosed, treatment-naïve patients, whereas little is known on clinical presentation and prognostic factors at the time of relapse, although 3 studies recently reported patterns of relapse after ASCT.27-29 This is particularly relevant because AL amyloidosis is still characterized by a high rate of early deaths, while long-term outcome is superior to that of multiple myeloma,30 and relapsed and refractory patients are selected for a relatively good outcome. This lack of knowledge results in the absence of validated criteria of progression, in lack of uniformity in the timing of retreatment in relapsing patients across referral centers,31 and in varying, noncomparable reporting of progression-free survival in clinical trials. This is acutely relevant because most of the clinical trials of new drugs take place in the relapsed and refractory setting.
In the present study, we report the outcome, variables leading to second-line therapy initiation, and variables predicting survival after rescue treatment in 259 consecutive patients with AL amyloidosis who responded to up-front nontransplant chemotherapy.
Methods
The prospectively maintained database of the Pavia Amyloidosis Research and Treatment Center was systematically searched for patients with AL amyloidosis who responded to up-front chemotherapy. Response to up-front chemotherapy was deemed satisfactory in case any of the following were reached: (1) complete response (CR), (2) very good partial response (VGPR), or (3) partial response (PR) plus organ response.16,32-34 Patients who received ASCT up-front were excluded. All patients gave written informed consent for the use of their clinical data for research purposes according to the institutional review board guidelines. The diagnosis of AL amyloidosis was biopsy proven, and the deposits were characterized as AL type by immuno-electron microscopy35 or mass spectrometry36 in all cases.
The patients were stratified according to the modified 2004 Mayo Clinic staging system,37,38 based on N-terminal pro-natriuretic peptide type-B (NT-proBNP; cutoff, 332 ng/L) and cardiac troponin I (cTnI; cutoff, 0.1 ng/mL), with stage I, II, and III patients having none, 1, or both markers above the cutoff. Stage III patients were classified as stage IIIa or IIIb based on whether their NT-proBNP was below or above 8500 ng/L. Staging of renal involvement was based on estimated glomerular filtration rate (eGFR; cutoff, 50 mL/min per 1.73 m2) and proteinuria (cutoff, 5 g/24 h), with stage I, II, and III patients having none, 1, or both unfavorable markers.15
Hematologic, cardiac, and renal responses were assessed according to current validated criteria.14,15 CR required negative serum and urine immunofixation and normal free light chain (FLC) ratio, VGPR was defined as a difference between involved (amyloidogenic) and uninvolved FLCs (dFLC) <40 mg/L, and PR was defined as a >50% decrease in dFLC. A pretreatment dFLC >50 mg/L was required to assess VGPR and PR. Cardiac response was defined as a decrease both >30% and >300 ng/L of NT-proBNP in patients with a pretreatment NT-proBNP of at least 650 ng/L. Renal response required a >30% decrease in 24-hour proteinuria or a reduction of proteinuria below 0.5 g/24 h in the absence of a >25% decrease in eGFR in subjects whose pretreatment proteinuria was >0.5 g/24 h.
For the purpose of the present study, relapse was defined as initiation of second-line therapy. The decision to start rescue treatment was made after review of case by at least 2 physicians of the Pavia Amyloidosis Research and Treatment Center. The variables considered to decide retreatment were organ progression, absolute dFLC level before initiation of up-front therapy, and change in dFLC compared with the nadir reached after up-front therapy. Time from discontinuation of up-front therapy to initiation of second-line therapy was defined as treatment-free survival (TFS). Clonal (bone marrow plasma cell infiltrate [BMPC], dFLC, involved FLC concentration, ratio of involved and uninvolved FLC, and depth of hematologic response) and organ markers (stage, concentration of NT-proBNP, cTnI, eGFR, proteinuria, ventricular wall thickness and ejection fraction at echocardiography), as well as type of frontline therapy were tested for their ability to predict TFS. Receiver operator characteristic (ROC) analyses based on initiation of second-line therapy at 2 years were used to identify cutoffs of tested variables best predicting this end point. A different set of ROC analyses based on death within 2 years from initiation of second-line therapy was used to identify cutoffs of tested variables best predicting survival after initiation of second-line therapy. OS was measured from diagnosis in the whole cohort and from the time of second-line therapy initiation in a separate analysis of patients who needed second-line therapy. The analysis of factors affecting the outcome after initiation of second-line therapy was based on OS after second-line therapy initiation. Survival curves were plotted according to Kaplan-Meier, and differences in survival were tested for significance with the log-rank test. Cox multivariate models were fitted including variables that predicted TFS and OS at univariate analysis. Continuous variables are presented as median and interquartile range (IQR). MedCalc Statistical Software version 14.12.0 (MedCalc Software bvba, Ostend, Belgium; http://www.medcalc.org) was used for computation.
Results
Between 2006 and 2015, 865 newly diagnosed treatment-naïve patients were seen at the Pavia Amyloidosis Research and Treatment Center. Twenty-two patients were excluded because they received ASCT up-front. Of the remaining patients, 208 died before the evaluation of response, and 180 were refractory to up-front therapy. In 196 cases, best response to up-front therapy was deemed unsatisfactory, and these patients immediately proceeded to second-line therapy. Levels of FLC and markers of organ involvement in the 196 patients who required second-line therapy immediately after discontinuation of up-front chemotherapy because of unsatisfactory response are reported in supplemental Table 1 (available on the Blood Web site). The remaining 259 patients discontinued therapy after attainment of response to up-front therapy and were included in the study. Their median age was 66 years (range, 39-84 years), and 138 subjects (53%) were male. The heart was involved in 184 patients (71%); the kidney, in 179 (69%); the soft tissues, in 46 (18%); the peripheral nervous system, in 34 (13%); and the liver, in 29 (11%). At the time of diagnosis, cardiac stage was I in 75 subjects (29%), II in 119 (46%), IIIa in 47 (18%), and IIIb in 18 (7%). Renal stage was I in 124 patients (48%), II in 101 (39%), and III in 34 (13%). Up-front treatment was melphalan and dexamethasone (MDex) in 129 patients (50%); cyclophosphamide, bortezomib, and dexamethasone (CyBorD) in 71 (27%); bortezomib plus MDex (BMDex) in 46 (18%); bortezomib and dexamethasone (BDex) in 10 (4%); and rituximab plus BDex in 3 subjects (1%) with immunoglobulin M–AL amyloidosis. The criteria guiding the choice of up-front therapy at our center have been reviewed by Palladini and Merlini.1 Briefly, MDex was preferred in patients with neuropathy or other contraindications to bortezomib, and cyclophosphamide was preferred over melphalan in patients with renal failure and in those with potentially reversible contraindications to ASCT. Best hematologic response after up-front therapy was CR in 82 patients (32%), VGPR in 134 (52%), and PR in 43 (16%). Cardiac response was achieved in 38% of patients, and renal response in 27%. All patients in whom treatment was discontinued after achievement of PR had also achieved organ response.
Patterns leading to initiation of rescue therapy
After a median follow-up of living patients of 41 months, 92 subjects (35%) needed second-line therapy. Values of dFLC and markers of cardiac and renal involvement in patients who required second-line therapy are reported in Table 1.
At the time of rescue therapy initiation, median dFLC was 55 mg/L (IQR, 26-108 mg/L, >20 mg/L in 80% of patients), corresponding to 41% of baseline value (IQR, 19% to 84%, >20% in 74% of patients) and to a 237% increase from the value reached at best response (IQR, 54% to 538%, >50% in 76% of patients). Importantly, dFLC at the time of second-line therapy initiation remained lower than the threshold of measurable disease (50 mg/L) in 44 patients (48%). However, when considered the new threshold proposed for assessing “low-dFLC response” (20 mg/L),39,40 75 patients (81%) had measurable disease.
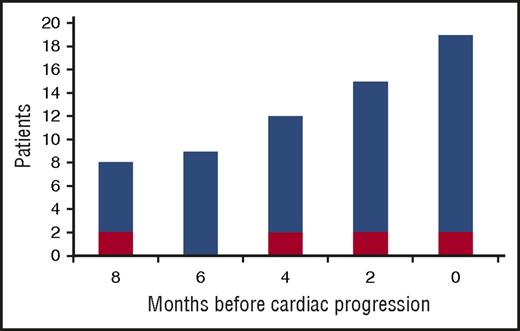
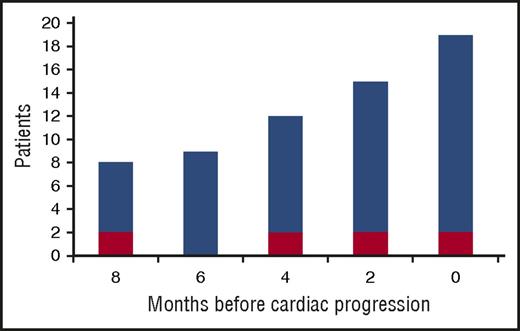
Progression of NT-proBNP was observed in 20 patients (22%). Response to up-front therapy in these patients was CR in 5 (25%), VGPR in 11 (55%), and PR in 4 (20%). At the time of cardiac progression, dFLC had reached a median of 50% of baseline value (IQR, 20% to 83%), had increased by a median of 402% from the value reached at best response (IQR, 121% to 1201%), and was >20 mg/L in 17 patients (85%). In 4 patients, dFLC increase and cardiac progression were noted simultaneously, at the same evaluation, whereas in 15 subjects dFLC increase preceded cardiac progression by a median of 6 months (range, 2-8 months; Figure 1). However, in 1 patient NT-proBNP progression occurred with stable dFLC. In this subject, NT-proBNP increased from 3034 ng/L (achieved at best response) to 6544 ng/L 16 months after up-front therapy discontinuation with stable dFLC (baseline 90 mg/L, best response 0 mg/L with positive serum and urine immunofixation, time of second-line therapy 0 mg/L with positive serum and urine immunofixation). In this patient, baseline NT-proBNP was 7049 ng/L, cardiac response was reached after 8 cycles of CyBorD, eGFR was stable, and no other causes of NT-proBNP increase were identified. The patient died because of heart failure 5 months after NT-proBNP progression. There was no other known cause of heart disease.
Increase of dFLC from the nadir reached after up-front therapy in 20 patients with cardiac progression. Cardiac progression is defined by an increase in NT-proBNP that is both >30% and >300 ng/L. Red bars: >10% increase in dFLC. Blue bars: “high-risk dFLC progression,” defined as an increase in dFLC that is >20 mg/L, >20% of baseline value observed at diagnosis, and >50% of the value reached at best response.
Increase of dFLC from the nadir reached after up-front therapy in 20 patients with cardiac progression. Cardiac progression is defined by an increase in NT-proBNP that is both >30% and >300 ng/L. Red bars: >10% increase in dFLC. Blue bars: “high-risk dFLC progression,” defined as an increase in dFLC that is >20 mg/L, >20% of baseline value observed at diagnosis, and >50% of the value reached at best response.
In 11 patients (12%), eGFR decreased by >25%. Renal progression was associated with a dFLC increase to >20 mg/L in all cases (median 40% of baseline value [IQR, 22% to 76%], median 225% increase from the value reached at best response [IQR, 60% to 1030%]). A >50% increase in proteinuria to >0.5 g/24 h was observed in 17 patients (18%). In all of them, dFLC also increased to >20 mg/L, reaching a median of 41% of the baseline value (IQR, 24% to 71%) and with a median increase of 118% compared with the value reached at best response (IQR, 24% to 201%). Notably, among the 167 patients in whom rescue treatment was not deemed necessary, 8 (5%) had renal progression defined as a >25% decrease in eGFR, with an increase in dFLC from the value reached at best response that was <20% in all cases.
TFS
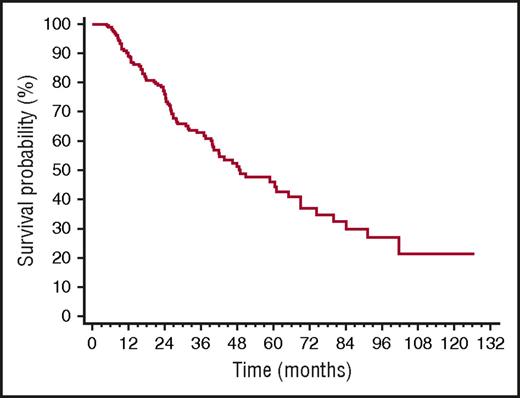
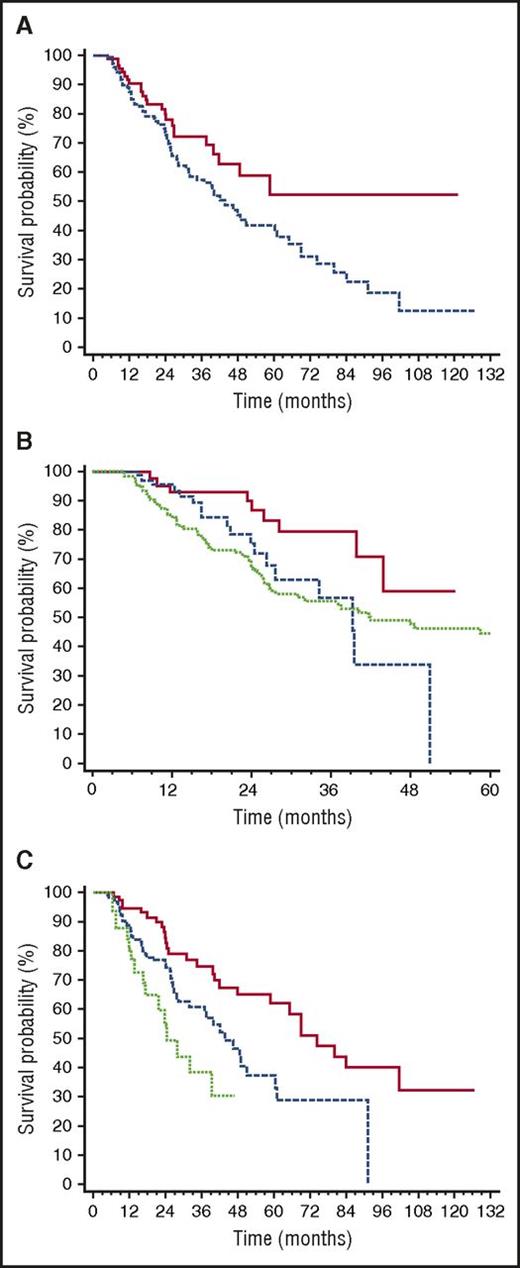
Median TFS was 49 months (Figure 2). The only baseline clonal marker predicting earlier initiation of second-line therapy was high involved/uninvolved FLC ratio (iuFLCR). The cutoff best predicting TFS was 6 (56% vs 72% at 3 years, P = .027; Figure 3A). Markers of severity of organ involvement at diagnosis did not predict TFS in responders to up-front therapy. Treatment with BMDex granted a longer TFS (Figure 3B) compared with MDex (80% vs 56% at 3 years, P = .022) and CyBorD (80% vs 57% at 3 years, P = .027). The quality of hematologic response after up-front therapy significantly affected TFS, with 25%, 39%, and 62% of patients who achieved CR, VGPR, and PR after up-front treatment requiring second-line therapy at 3 years, respectively (Figure 3C). At multivariate analysis, achievement of CR after up-front therapy and frontline treatment with BMDex remained independent predictors of prolonged TFS (Table 2).
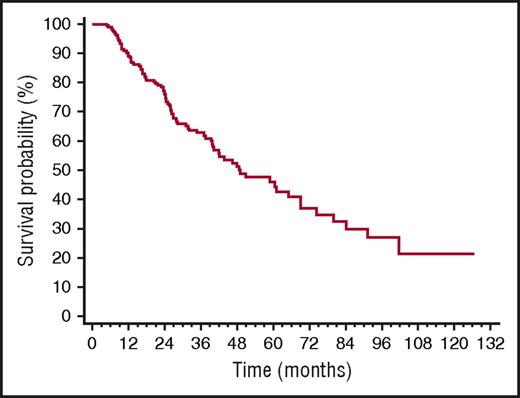
Time to second-line therapy in 259 patients with AL amyloidosis who achieved hematologic response after up-front therapy. Median 49 months.
Time to second-line therapy in 259 patients with AL amyloidosis who achieved hematologic response after up-front therapy. Median 49 months.
Variables affecting time to second-line therapy in 259 patients with AL amyloidosis who achieved hematologic response after up-front therapy. (A) Impact of iuFLCR at baseline on time to second-line therapy. Solid line, iuFLCR <6, 94 patients; dashed line, iuFLCR ≥6, 165 patients. P = .027. (B) Impact of up-front treatment type on time to second-line therapy. Solid line, BMDex (46 patients); dashed line, CyBorD (71 patients, P = .027 compared with BMDex); dotted line, MDex (129 patients, P = .022 compared with BMDex). (C) Impact of quality of hematologic response after up-front therapy on time to second-line therapy. Solid line, CR (82 patients, median 74 months); dashed line, VGPR (134 patients, median 44 months, P = .006 compared with CR); dotted line, PR (43 patients, median 24 months, P = .036 compared with VGPR). All the patients in PR had also achieved organ response.
Variables affecting time to second-line therapy in 259 patients with AL amyloidosis who achieved hematologic response after up-front therapy. (A) Impact of iuFLCR at baseline on time to second-line therapy. Solid line, iuFLCR <6, 94 patients; dashed line, iuFLCR ≥6, 165 patients. P = .027. (B) Impact of up-front treatment type on time to second-line therapy. Solid line, BMDex (46 patients); dashed line, CyBorD (71 patients, P = .027 compared with BMDex); dotted line, MDex (129 patients, P = .022 compared with BMDex). (C) Impact of quality of hematologic response after up-front therapy on time to second-line therapy. Solid line, CR (82 patients, median 74 months); dashed line, VGPR (134 patients, median 44 months, P = .006 compared with CR); dotted line, PR (43 patients, median 24 months, P = .036 compared with VGPR). All the patients in PR had also achieved organ response.
Second-line therapy
Second-line therapy was BDex in 22 patients (24%) 13 of whom (59%) reached hematologic response, CyBorD in 22 (24%) with 16 (73%) responders, MDex in 19 (21%) with 14 (74%) responders, lenalidomide-based in 11 (12%) with 6 (54%) responders, thalidomide-based in 10 (11%) with 6 (60%) responders, high-dose dexamethasone in 5 (5%) with 3 (50%) responders, BMDex in 2 (2%) both responders, and ASCT in 1 (1%) in whom hematologic response was restored. Patients who had become transplant-eligible were offered ASCT. Patients who received up-front MDex were considered for bortezomib-based combinations unless contraindications to bortezomib persisted. In other cases, we repeated up-front therapy if possible. If this was not possible, patients received lenalidomide, or thalidomide in case of nephrotic syndrome or renal failure.
Survival after initiation of second-line therapy
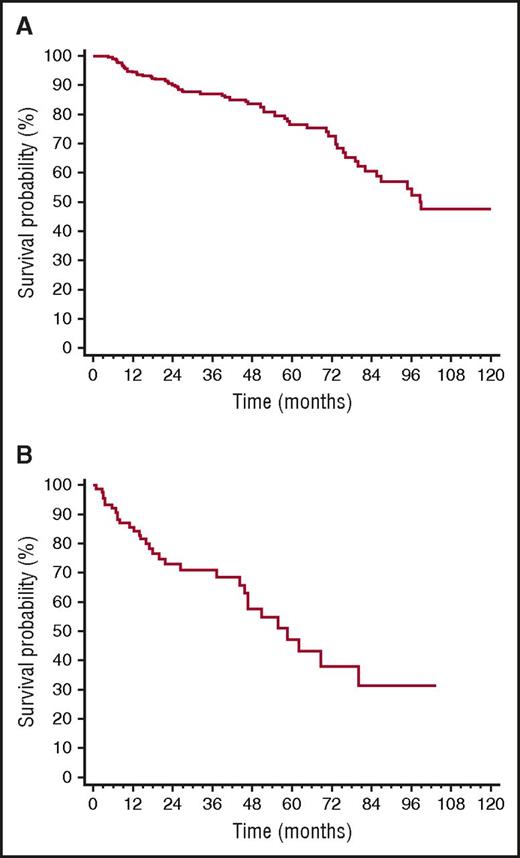
Overall, 32 patients died (12% of the whole cohort, 35% of patients who underwent rescue therapy). All deaths occurred in patients who needed second-line treatment. Median survival of the whole cohort was 99 months (Figure 4A), whereas median survival from the time of second-line therapy initiation of the 92 patients who underwent rescue therapy was 59 months (Figure 4B). CR, up-front treatment with BMDex, and iuFLCR <6 were not associated with survival after second-line therapy initiation. Moreover, rechallenge with the same therapy used up-front (54 patients, 59%) and treatment with a different therapy (38 patients, 41%) did not affect survival from the time of second-line therapy initiation (median 59 vs 52 months, P = .709), in agreement with the recent observation by Tandon et al.41
OS. (A) Survival from diagnosis of the whole cohort (259 patients, median 99 months). (B) Survival from the time of initiation of second-line therapy (92 patients, median 59 months).
OS. (A) Survival from diagnosis of the whole cohort (259 patients, median 99 months). (B) Survival from the time of initiation of second-line therapy (92 patients, median 59 months).
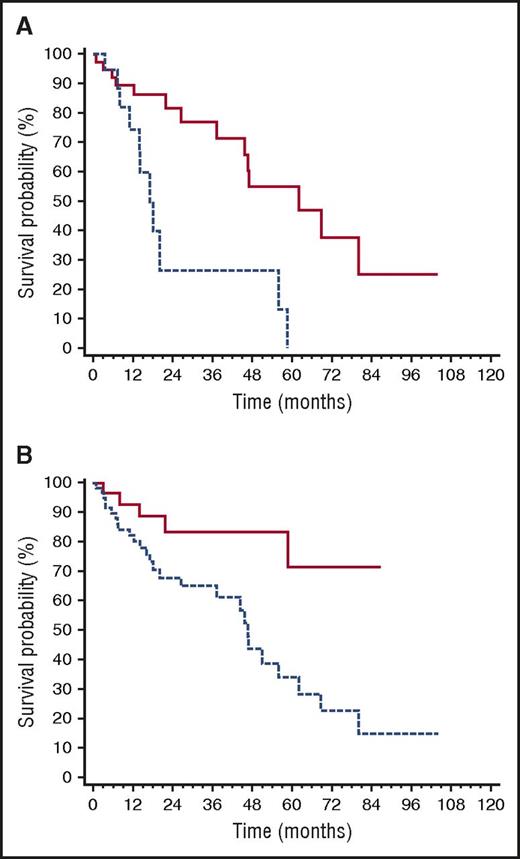
The ROC analyses showed that dFLC cutoffs best predicting death after second-line therapy initiation were an absolute value of >20 mg/L, a level >20% of baseline value, and an increase from the value reached at best response of >50%. Based on these findings, we defined as “high-risk dFLC progression” having reached all of these cutoffs. The dFLC level in the 60 patients with “high-risk dFLC progression” was above the standard threshold of measurable disease (>50 mg/L) in 70% of cases, while, by definition, the updated threshold for patients with low dFLC burden (>20 mg/L)39,40 was reached in all cases. Among patients who required rescue therapy, “high-risk progression” occurred in 56% of those who had achieved CR after up-front therapy, in 65% of patients in VGPR (P = .402 compared with CR), and in 81% of patients in PR (P = .089 compared with CR, P = .231 compared with VGPR). As reported previously, “high-risk dFLC progression” was associated with cardiac progression in 85% of cases (Figure 1). Patients with NT-proBNP progression at the time of second-line treatment had a significantly shorter survival after rescue treatment was started (median 17 vs 62 months, P = .002; Figure 5A), as well as those with “high-risk dFLC progression” (median 46 months vs not reached, P = .004; Figure 5B).
Variables affecting survival after second-line therapy initiation. (A) Impact of NT-proBNP progression on survival after second-line therapy initiation (P = .002). Solid line, no NT-proBNP progression (40 patients, median survival 62 months); dashed line, NT-proBNP progression (20 patients, median survival 17 months). (B) Impact of dFLC progression on survival after second-line therapy initiation (P = .004). Dashed line, patients with “high-risk dFLC progression” (60 patients, median survival 46 months); all of the following are required to define “high-risk dFLC progression”: dFLC >20 mg/L, dFLC >20% of baseline value, and dFLC increase by >50% of value reached at best response. Solid line, all other patients (32 patients, median survival not reached).
Variables affecting survival after second-line therapy initiation. (A) Impact of NT-proBNP progression on survival after second-line therapy initiation (P = .002). Solid line, no NT-proBNP progression (40 patients, median survival 62 months); dashed line, NT-proBNP progression (20 patients, median survival 17 months). (B) Impact of dFLC progression on survival after second-line therapy initiation (P = .004). Dashed line, patients with “high-risk dFLC progression” (60 patients, median survival 46 months); all of the following are required to define “high-risk dFLC progression”: dFLC >20 mg/L, dFLC >20% of baseline value, and dFLC increase by >50% of value reached at best response. Solid line, all other patients (32 patients, median survival not reached).
We assessed the impact of type and severity of organ involvement at diagnosis on survival after second-line therapy initiation. Renal involvement and renal stage at presentation did not affect survival after rescue treatment. There was a nonsignificant trend for a shorter survival for patients who presented with heart involvement (median 47 months vs not reached, P = .085). Advanced (stage III) heart involvement at diagnosis did not predict survival after rescue therapy initiation (median 45 vs 58 months, P = .537). The number of organs involved at the time of second-line therapy initiation did not predict survival.
At multivariate analysis, only NT-proBNP progression (HR, 4.15; 95% CI ,1.72-10.00; P = .002), and not “high-risk dFLC progression” (HR, 2.19; 95% CI, 0.69-7.18; P = .198) and heart involvement at diagnosis (HR, 1.14; 95% CI, 0.30-4.34), remained an independent predictor of survival in patients who required rescue therapy.
Discussion
In the present study, we elucidated the clinical characteristics and outcome of a large series of patients with AL amyloidosis who required second-line therapy after initial response to chemotherapy. We identified factors predicting shorter time to second-line therapy, and we identified variables associated with a poor outcome after second-line therapy initiation. The relatively long follow-up (median 3.4 years for living patients) allowed a reliable assessment of outcome. The median TFS of patients who achieved a satisfactory response (CR, VGPR, or PR plus organ response) to up-front therapy by Kaplan-Meier analysis was 4.1 years in the overall population and 6.2 years in patients who achieved CR after up-front therapy. In our study, the patients who needed further treatment received second-line therapy after a median of 2.7 years (range, 1.2-9.1 years; IQR, 1.6-3.9 years) in the overall series and of 3.9 years (range, 1.2-10.1 years; IQR, 2.1-5.5 years) in patients who achieved CR. This is in agreement with the study from the Boston University group, reporting a median time to hematologic relapse of 4.3 years (range, 1.5-21.6 years) in patients who achieved CR after ASCT,28 and with the study from the Mayo Clinic group, reporting that the median time from ASCT to initiating a second-line therapy was 2.1 years (IQR, 0.9-4.1 years).29
Outcome of patients who respond to up-front therapy: implications for clinical trial design
In the present study, the OS of patients who achieved PR plus organ response, VGPR, or CR after frontline therapy was very good, with a median exceeding 8 years from diagnosis. Also, patients who needed rescue treatment after an initial response to up-front treatment maintain quite a good outcome, with a 5-year median OS after initiation of rescue treatment. This is in agreement with the results of a study by Warsame et al, reporting a 4.3-year median OS after relapse in 146 patients who received up-front ASCT.27 In the study by Sanchorawala et al focusing on patients relapsing after an initial CR induced by ASCT, the OS from the time of relapse was 8.5 years.28 Overall, these data compare favorably with refractory patients. In 2 small series of homogeneously treated subjects with refractory AL amyloidosis who received lenalidomide- or pomalidomide-based rescue treatment, median OS was 1.2 and 2.2 years, respectively.22,42 Overall, these findings indicate that relapsing patients are selected for favorable prognostic factors: survival in the first months after diagnosis, when most patients with advanced heart involvement die of the disease, and sensitivity of the plasma cell clone to chemotherapy. This should be considered when designing clinical trials of new drugs in previously treated patients that usually enroll both relapsed and refractory patients. These 2 groups have very different outcomes, and appropriate stratification should be planned to avoid biased results.
Characteristics of patients who receive second-line therapy
Despite the lack of validated criteria for disease progression in AL amyloidosis, the present study revealed some uniformity in the changes triggering rescue treatment at our center. Importantly, no deaths were observed in subjects who were believed to have no need of second-line therapy.
We were able to identify factors predicting time to second-line therapy initiation. It was reassuring that the depth of hematologic response as assessed by current criteria also predict TFS, and this is the first validation of the ability of current response criteria to predict progression, further corroborating their utility as end points in AL amyloidosis. However, novel prognostic factors for progression also emerged. They were high iuFLCR and exposure to both melphalan and bortezomib up-front. High iuFLCR reflects suppression of nonclonal plasma cells and its relevance is in agreement with the observation that immunoparesis is a marker of poor prognosis in AL amyloidosis.43 Treatment with BMDex conferred a prolonged TFS in this series that was able to overcome the impact of high iuFLCR and was independent of the quality of hematologic response. It is possible that this combination can remain highly effective independently of the cytogenetics abnormalities gain 1q21 and t(11:14) that reduce the efficacy of melphalan- and bortezomib-based therapy, respectively.6-9 However, data on immunoparesis as defined by Muchtar et al43 and results of fluorescence in situ hybridization studies were not available in the present series.
Outcome after initiation of second-line therapy
In the present study, patients who required second-line therapy had a relatively low dFLC level (median 55 mg/L). We and the Heidelberg group have recently shown that ∼20% of patients with AL amyloidosis have a low dFLC value (<50 mg/L) at diagnosis.39,40 This is associated with a longer survival compared with other patients. Nevertheless, reduction to very low levels (below 10 mg/L in subjects who have at least 20 mg/L at baseline, defined as low-dFLC response) results in even better survival and improved renal outcome. Moreover, in a pilot study of evaluation of minimal residual disease by flow cytometry in AL amyloidosis, we observed that the persistence of minimal residual disease can prevent organ improvement in patients otherwise in CR.44 In the present study, relatively small increases in the absolute dFLC value preceded cardiac progression by several months. Taken together, these observations indicate that even small amounts of circulating amyloidogenic FLCs can be able to foster organ progression in AL amyloidosis and should not be underestimated. Novel sensitive methods to identify and measure monoclonal amyloidogenic light chains will improve our ability to monitor these small clones in the future.45-47 Almost two-thirds of patients who started rescue therapy had at least a 50% increase in dFLC from the value reached after up-front therapy to an absolute value of ≥20 mg/L that corresponded to at least 20% of the baseline value observed at diagnosis. This was defined “high-risk dFLC progression.” “High-risk dFLC progression” preceded cardiac progression by a median of 6 months in 85% of cases and was associated with a significantly shorter survival after second-line therapy initiation. Moreover, initiation of rescue therapy after cardiac progression was associated with a median survival of only 17 months. This emphasizes the prognostic relevance of NT-proBNP progression also in the relapsing setting. Importantly, multivariate analysis showed that the impact of dFLC increase on survival was not independent of cardiac progression. These data indicate that cardiac progression should not be awaited to start rescue therapy. A “high-risk dFLC progression” defined as in the present study could probably be considered a trigger to start second-line therapy, also taking into account that the novel hematologic response criteria for patients with low dFLC level, requiring a dFLC above 20 mg/L to have “measurable disease,” can be applied to all subjects with “high-risk dFLC progression.”39,40 However, validation in independent series is warranted.
In the present study, a total of 19 patients had renal progression during follow-up. Rescue treatment was started in 11 of them with more pronounced dFLC increases, all fulfilling the criteria of “high-risk dFLC progression.” It should be kept in mind that in AL amyloidosis renal progressions can occur also in the absence of hematologic progression, particularly in patients with advanced renal failure. Thus, renal progression should not always be considered a trigger for rescue treatment initiation.
Conclusion
Patients with AL amyloidosis who need rescue treatment after response to up-front therapy generally have a very good outcome that is better than that reported for refractory patients. This indicates that clinical trials in relapsed/refractory patients with AL amyloidosis require appropriate stratification based on response to previous therapy. Depth of hematologic response and exposure to melphalan and bortezomib up-front delay progression. A “high-risk dFLC progression” could be considered a trigger for rescue therapy initiation before cardiac progression, which is associated with poor survival. However, the generalizability of the results of the present study in independent populations treated up-front with different approaches, including ASCT, is warranted through large, international validation studies of “high-risk dFLC progression” as a possible hematologic progression criterion in AL amyloidosis.
The online version of this article contains a data supplement.
The publication costs of this article were defrayed in part by page charge payment. Therefore, and solely to indicate this fact, this article is hereby marked “advertisement” in accordance with 18 USC section 1734.
Acknowledgments
The authors acknowledge the study coordinator and data manager Anna Carnevale Baraglia.
This work was supported in part by grants from “Associazione Italiana per la Ricerca sul Cancro–Special Program Molecular Clinical Oncology 5 per mille n. 9965,” from CARIPLO “Structure-function relation of amyloid: understanding the molecular bases of protein misfolding diseases to design new treatments n. 2013-0964,” and from CARIPLO “Molecular mechanisms of immunoglobulin toxicity in age-related plasma cell dyscrasias n. 2015-0591.” G.P. is supported in part by the Bart Barlogie Young Investigator Award from the International Myeloma Society.
Authorship
Contribution: G.P. and P.M. designed the study, evaluated patients, collected data, analyzed data, wrote the manuscript, and gave final approval; G.M. designed the study, evaluated patients, critically reviewed the manuscript, and gave final approval; and M.B., F.R., A.F., and S.P. evaluated patients, collected data, critically reviewed the manuscript, and gave final approval.
Conflict-of-interest disclosure: G.P. received honoraria from Jannsen-Cilag, honoraria and travel support from Prothena, and travel support from Celgene. G.M. is a consultant for Millennium Pharmaceuticals Inc., Pfizer, Janssen, Prothena, and IONIS. The remaining authors declare no competing financial interests.
Correspondence: Giampaolo Merlini, Amyloidosis Research and Treatment Center, Fondazione IRCCS Policlinico San Matteo, Viale Golgi, 19, 27100 Pavia, Italy; e-mail: gmerlini@unipv.it.

