Key Points
Mutations in genes other than RPS19 result in significant imbalance between globin and heme synthesis, leading to excess free heme.
Decreased levels of HSP70 and GATA1 account for excess free heme in DBA erythroblasts; HSP70 reexpression restores the globin/heme synthesis.
Abstract
Diamond-Blackfan anemia (DBA) is a congenital erythroblastopenia that is characterized by a blockade in erythroid differentiation related to impaired ribosome biogenesis. DBA phenotype and genotype are highly heterogeneous. We have previously identified 2 in vitro erythroid cell growth phenotypes for primary CD34+ cells from DBA patients and following short hairpin RNA knockdown of RPS19, RPL5, and RPL11 expression in normal human CD34+ cells. The haploinsufficient RPS19 in vitro phenotype is less severe than that of 2 other ribosomal protein (RP) mutant genes. We further documented that proteasomal degradation of HSP70, the chaperone of GATA1, is a major contributor to the defect in erythroid proliferation, delayed erythroid differentiation, increased apoptosis, and decreased globin expression, which are all features of the RPL5 or RPL11 DBA phenotype. In the present study, we explored the hypothesis that an imbalance between globin and heme synthesis may be involved in pure red cell aplasia of DBA. We identified disequilibrium between the globin chain and the heme synthesis in erythroid cells of DBA patients. This imbalance led to accumulation of excess free heme and increased reactive oxygen species production that was more pronounced in cells of the RPL5 or RPL11 phenotype. Strikingly, rescue experiments with wild-type HSP70 restored GATA1 expression levels, increased globin synthesis thereby reducing free heme excess and resulting in decreased apoptosis of DBA erythroid cells. These results demonstrate the involvement of heme in DBA pathophysiology and a major role of HSP70 in the control of balanced heme/globin synthesis.
Introduction
Diamond-Blackfan anemia (DBA) is a congenital erythroblastopenia with an incidence of 7 to 10 cases per million live births.1,2 DBA is one of the inherited bone marrow failure syndromes related to a defect in ribosome biogenesis,3 with a mutation in a ribosomal protein identified in >70% of cases,4-14 primarily in the RPS19,6 RPL5, and RPL119,12 genes.
We have recently shown that HSP70, the chaperone of GATA1, is one of the factors involved in the erythroid tropism of DBA.15 Indeed, proteasomal degradation of polyubiquitinated HSP70 in DBA-affected patients with RPL5 and RPL11 mutations and other non-RPS19 genes leads to decreased levels of HSP70, with resultant caspase-3 dependent GATA1 cleavage. Decreased GATA1 levels account for delayed erythroid differentiation, low proliferative rate, and increased apoptosis of erythroid cells in these in vitro phenotypes with non-RPS19 gene mutations.15
Because the phenotype of DBA patients is highly heterogeneous, we wondered whether excess heme may account for the variable phenotypic expression of the disease, because an excess of free heme is toxic for the cells by increasing reactive oxygen species (ROS) production, lipid peroxidation, and apoptosis.16 During adult terminal erythroid differentiation, there is a tight regulation for balanced globin and heme synthesis to produce hemoglobin. Unbalanced globin/heme production due to excess α-globin chains leads to accumulation of free heme in β-thalassemia and resultant pathophysiology.17,18 HSP70 has also been implicated in the mechanistic understanding of thalassemia pathophysiology.19,20
The cellular mechanisms involved in the elimination of excess free heme in different subcellular compartments has been described extensively.21 The transcription repressor BTB domain and cnc homolog 1 (BACH1) regulates the expression of heme oxygenase 1 (HMOX1) and globin genes. Free heme trapped by BACH1 in the nucleus inhibits BACH1 DNA binding activity and induces BACH1 nuclear export and proteasomal degradation.22 The translation regulator heme-regulated EIF2α kinase (HRI) is active in heme deficiency; HRI phosphorylates eIF2α, which inhibits globin chain synthesis. When free heme is in excess, it may be captured by HRI, which is able to bind 2 heme molecules on its second heme-binding domain, maintaining HRI in an inactive state. As a consequence, there is a decrease in the phosphorylation of eIF2α, which leads to an increase in globin chain translation. The aim of this cellular regulation is to increase the globin chain translation to incorporate excess free heme to generate hemoglobin and decrease free heme levels.17,18,23
Feline leukemia virus subgroup C receptor 1 (FLVCR1)24-26 has been described as the major heme exporter in erythropoiesis,27 and it can balance the globin/heme ratio as well.28 flvcr1−/− mice exhibit erythroblastopenia, with a malformative syndrome similar to DBA.29 FLVCR1 has been proposed to play a role in modulating DBA phenotype.29,30
In the present study, we explored the hypothesis that the imbalanced synthesis of globin and heme in DBA may be responsible for the excess free heme content in DBA erythroid cells and the consequent deleterious effects on erythropoiesis. We documented, in primary erythroid cells, a greater imbalance in the globin/heme ratio and resultant large excess of free heme in the DBA patients who carried mutations in RPL5 and RPL11, RP genes other than RPS19. These findings enabled us to account for the duality of the RP phenotypes based on excess free heme and a role for HSP70 in this process. Furthermore, we showed that HSP70 controls GATA1 and globin chain expression, as well as heme levels and the other GATA1 targets involved in heme metabolism, such as HRI and δ-aminolevulinate synthase 2 (ALAS2).
Methods
Study population
Twelve individuals affected with DBA registered in the French DBA registry (National Commission for Computing and Liberties [CNIL] acceptance #911387, Advisory Committee on Information Processing in Material Research in the Field of Health [CCTIRS] #11.295) and 12 hematologically normal individuals were studied. DBA was diagnosed according to established criteria.2 Table 1 shows the biological and clinical data for the DBA patients.
Cell culture
Cell lines and human primary cells
The UT-7–erythropoietin (EPO) and HEK-EBNA 293T cell lines, as well as human primary CD34+ cells isolated from the peripheral blood of DBA patients and controls or from human cord blood, were cultured as previously described.31 The UT-7-EPO–dependent cell line, a human leukemic cell line, was used because of its ability to proliferate and differentiate specifically along the erythroid lineage and its ability for cell hemoglobinization. Titers of viral particles were determined by quantifying the number of GFP+ or mCherry+ cells following infection of the HEK-EBNA 293T cell line.
Cell culture and heme treatment
UT-7–EPO and primary erythroid cells were treated for 4 hours with heme arginate (Normosang human hemin; Orphan Europe, Puteaux, France) at concentrations ranging from 0 to 0.3 mg/mL.
Sorting of erythroblasts at burst–forming unit-erythroid (BFUe) and colony–forming unit-erythroid (CFUe) stages by flow cytometry
Synchronized erythroid cells from phase 1 of culture were sorted to obtain pure populations of erythroid progenitors using a previously published method.32
Erythroid cell proliferation and differentiation of CD34+ cells
Erythroid differentiation was characterized based on the extent of cell hemoglobinization (benzidine staining), cell cytology (May–Grünwald–Giemsa staining), and stage of erythroid differentiation by immunophenotyping by flow cytometry (FACSCanto; Becton Dickinson).31
Lentiviral vectors and infection
The short hairpin RNA (shRNA) constructs targeting RPS19, RPL5, and RPL11 have been generated and validated by our group.15,31 The effectiveness of shRNA was assessed at day 9 (supplemental Figure 1, available on the Blood Web site). pTRIP-ZEPHYR-mCherry control or the pTRIP-ZEPHYR-HSP70-mCherry lentivirus was cotransduced as previously described.15
RT-qPCR
Real–time reverse transcription-polymerase chain reaction (RT-qPCR) assays were performed using a LightCycler FastStart DNA Master SYBR Green I kit (Roche, Bale, Switzerland). The specific human primers used are listed in supplemental Table 1.
Western blotting
Pellets of 2.5 to 5 × 10⁴ cells (DBA patients and controls) or 105 shRNA-infected erythroid cells were lysed in Laemmli buffer. Nitrocellulose membrane was immunostained overnight with the primary antibody (anti-human FLVCR1, β-globin, α-globin, HSP70, HMOX1, ferrochelatase [FECH], GATA1, EIF2α, phosphorylated EIF2α [P-EIF2α], RPL5, RPS19, RPL11, ALAS2 [courtesy of Agios Pharmaceuticals], BACH1, HRI, β-actin, or GAPDH) (supplemental Table 2).
Heme measurements
Total heme quantification
A QuantiChrom Heme Assay kit (DIHM-250; Gentaur, Kampenhout, Belgium) was used to assess heme content. A total of 105 cells was lysed for 5 minutes at 95°C in 50 μL of ultrapure water. Heme content was quantified in a spectrophotometer at 400 nm in conjunction with a 62.5-μM heme standard. The total heme concentration of a sample is calculated as [(ODsample − ODblank)/(ODstandard − ODblank)]*62.5*50, where OD = optical density. Another method based on protoporphyrin quantification by direct molecule fluorescence and adapted from the protocol of Sinclair et al was also used.33
Free heme quantification
Pellets of 105 cells were lysed in 50 μL of buffer (0.1 M NaOH) and protease inhibitor cocktail and centrifuged for 5 minutes at 1500 rpm (4°C). An OD scan from 200 to 800 nm was performed with a spectrophotometer. Free heme was calculated as the ratio between 380 nm ± 2 nm (heme band) and 560 nm ± 2 nm (hemoglobin band).
FLVCR1 flow cytometry measurement
To analyze FLVCR1 expression by flow cytometry, we used a new methodology based on the FLVC sequence cloned as a receptor binding domain (FLVCR1-R100 kit; Metafora Biosystems, Institut Cochin, Paris, France).
ROS quantification
A total of 1 × 10⁴ cells was washed and suspended in 500 μL of Hanks’ Balanced Salt Solution - No Phenol Red (Invitrogen, Carlsbad, CA) with 10 μM luminol and 2.5 IU/mL horseradish peroxidase. Samples were incubated for 200 minutes in the dark at 37°C in a luminometer AutoLumat LB 953 (EG&G Berthold, Bad Wildbad, Germany). Relative ROS production was calculated as the ratio between integral of sample curve/integral of control curve over 200 minutes. The second method used is based on flow cytometry using a CellROX Deep Red Reagent kit, according to the manufacturer’s instructions (Invitrogen).
Statistical analysis
Statistical analyses were performed with GraphPad Prism (version 5.0; GraphPad Software). Differences were considered significant at P < .05 (*P < .05; **P < .01; ***P < .001).
Results
Kinetics of heme and globin synthesis during normal erythroid differentiation
Prior to characterization of the kinetics of heme and globin synthesis and on defining potential changes in DBA, we first analyzed the expression levels of a large number of proteins involved in heme metabolism and trafficking and total heme production during normal human erythroid differentiation. The proteins studied included (1) the housekeeping heme synthesis enzyme ALAS1, the first enzyme in the mammalian heme biosynthetic pathway, and the erythroid tissue–specific ALAS2 and FECH, the first and the last mitochondrial enzymes, respectively, which are responsible for heme synthesis in erythroid cells; (2) HMOX1, FLVCR1, and BACH1, proteins involved in regulating intracellular levels of free heme; (3) GATA1, which controls globin transcription; (4) EIF2α and P-EIF2α, proteins that control globin translation; (5) TfR1 (CD71), the transferrin receptor involved in iron delivery; and (6) the α- and β-globin chains, which generate hemoglobin following incorporation of heme and iron.
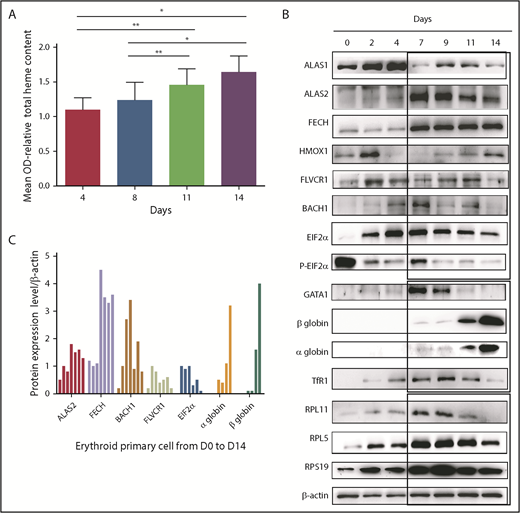
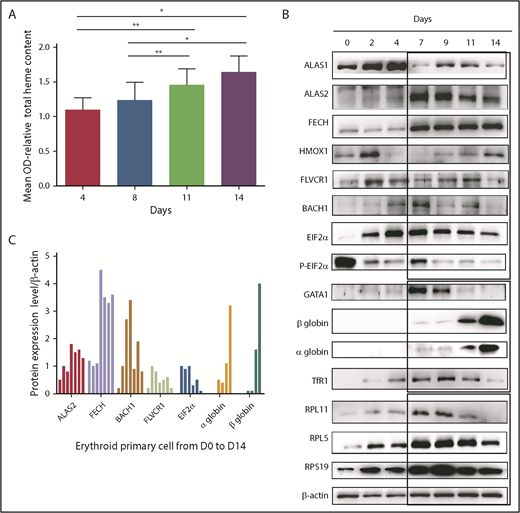
Total heme content of cells increased gradually, as expected, during normal terminal erythroid differentiation that occurs from day 7 to day 14 in our human erythroid culture system as proerythroblasts differentiate to orthochromatic erythroblasts (Figure 1A). Concomitant with the increase in heme content, expression levels of FECH and ALAS2 increased starting at day 7 and were expressed at high levels during all stages of erythroid differentiation (days 7-14). Interestingly, the expression level of nontissue-specific ALAS1 was highest in erythroid progenitors generated during the first phase of culture (days 1-4), suggesting that ALAS1 sustained heme synthesis in progenitor cells prior to the expression of erythroid-specific ALAS2 during terminal erythroid differentiation (Figure 1B-C). GATA1 expression increased gradually from day 0 to day 4, with maximal expression at day 7. GATA1 expression decreased with the progression of terminal erythroid differentiation from day 7 to day 14. Strikingly, the highest GATA1 expression occurs at the time when α and β globin chains are beginning to be synthesized, and the maximum level of synthesis occurs at the end of erythroid differentiation, at day 14. The expression of proteins linked to translation, such as the ribosomal proteins (RPS19, RPL5, RPL11), and that of the EIF2α/P-EIF2α ratio is also highest at the onset of globin chain translation, at day 7. Expression of TfR1 (CD71) tracked with expression levels of proteins involved in heme biosynthesis.
Heme metabolism pathway analysis during normal human erythroid differentiation. (A) Measurement of total heme content from day 4 to day 14. Quantification based, after iron removal, on the protoporphyrin quantification by direct molecule fluorescence. Mean OD relative to that obtained at day 4 (mean OD = 1). The data are mean ± standard deviation of 3 independent experiments. (B) Expression levels of the major proteins involved in heme synthesis (ALAS1, ALAS2, FECH), excess free heme removal (FLVCR1, BACH1, HMOX1), globin transcription (GATA1), globin translation (HRI, EIF2α, α and β globins, some RP involved as well in DBA, RPS19, RPL5, RPL11), and iron uptake (TfR1). Immunoblots of 50 000 human normal primary erythroid cells during the normal erythroid culture time course from day 0 to day 14 (0, 2, 4, 7, 9, 11, and 14) obtained from healthy CD34+ cord blood. Proteins were compared with β-actin expression. (C) Protein expression of ALAS2, FECH, BACH1, FLVCR1, EIF2α, and α and β globins relative to β-actin at days 0, 2, 4, 7, 9, 11, and 14 of normal erythroid differentiation. *P < .05, **P < .010.
Heme metabolism pathway analysis during normal human erythroid differentiation. (A) Measurement of total heme content from day 4 to day 14. Quantification based, after iron removal, on the protoporphyrin quantification by direct molecule fluorescence. Mean OD relative to that obtained at day 4 (mean OD = 1). The data are mean ± standard deviation of 3 independent experiments. (B) Expression levels of the major proteins involved in heme synthesis (ALAS1, ALAS2, FECH), excess free heme removal (FLVCR1, BACH1, HMOX1), globin transcription (GATA1), globin translation (HRI, EIF2α, α and β globins, some RP involved as well in DBA, RPS19, RPL5, RPL11), and iron uptake (TfR1). Immunoblots of 50 000 human normal primary erythroid cells during the normal erythroid culture time course from day 0 to day 14 (0, 2, 4, 7, 9, 11, and 14) obtained from healthy CD34+ cord blood. Proteins were compared with β-actin expression. (C) Protein expression of ALAS2, FECH, BACH1, FLVCR1, EIF2α, and α and β globins relative to β-actin at days 0, 2, 4, 7, 9, 11, and 14 of normal erythroid differentiation. *P < .05, **P < .010.
The balance between heme and globin chain production during erythropoiesis can be monitored indirectly by studying the expression pattern of proteins involved in the generation and elimination of heme from erythroid cells. Because globin chain production does not reach significant levels until day 11, we expect increased expression levels of proteins involved in heme scavenging during the early stages of erythropoiesis (days 0-9). Indeed, we noted that, starting at day 2, free heme scavengers FLVCR1 and HMOX1 were highly expressed. Interestingly, BACH1, which is subject to proteasomal degradation due to excess free heme, was expressed at low levels. Thus, at steady-state during the early stages of erythropoiesis, there is little or no excess free heme due to the expression of heme scavengers. When the globin chains are synthesized at later stages of erythropoiesis (days 7-14), the pool of free heme is incorporated into the globin chains, and there is little need for heme scavengers. Indeed, at day 7 we observed a decrease in the expression of FLVCR1 and HMOX1 and increased BACH1 expression (Figure 1B-C).
Depletion of RPS19, RPL5, or RPL11 leads to excess free heme and increased ROS production in human erythroid cells
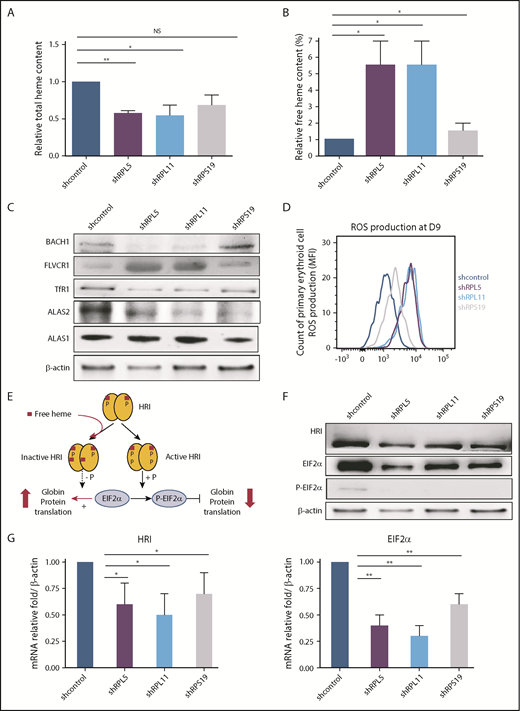
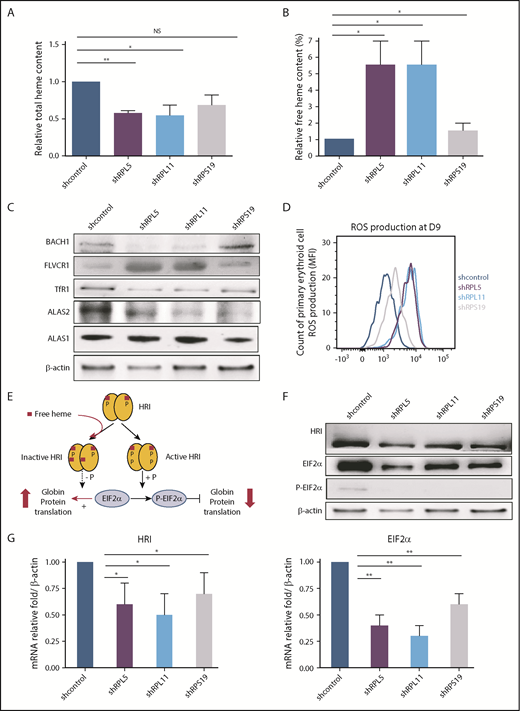
shRNAs against RPS19, RPL5, and RPL11 were generated and validated as previously described (supplemental Figure 1).31 Following knockdown of RPS19, RPL5, or RPL11 messenger RNA (mRNA), total heme content of erythroid cells at day 9 of culture decreased significantly (Figure 2A). Strikingly, free heme levels increased significantly in all ribosomal-depleted erythroid cells (Figure 2B; supplemental Figure 2). To confirm these increased free heme levels in RP-deficient erythroid cells, we monitored the expression level of proteins directly regulated by free heme: BACH1 and FLVCR1. FLVCR1 protein expression in human erythroid cells is increased following depletion of RPL5 or RPL11 (Figure 2C; supplemental Figure 3). In contrast, BACH1 expression is decreased, suggesting the degradation of BACH1 in RPL5- and RPL11-depleted cells compared with controls. In marked contrast, we noted only a mild increase in FLVCR1 expression and a slight decrease in BACH1 expression following depletion of RPS19, suggesting less excess free heme in RPS19-depleted cells (Figure 2C; supplemental Figure 3). Accordingly, production of ROS in cells at day 9 increased to a much greater extent following depletion of RPL5 and RPL11 compared with RPS19 (Figure 2D). These findings imply that there are larger amounts of excess free heme in erythroid cells depleted of RPL5 and RPL11 compared with RPS19-depleted cells.
Excess free heme in the shRNA model reproducing DBA (human primary erythroid cells depleted in RPS19, RPL5, or RPL11). (A) Quantification of the total heme in depleted RPS19, RPL5, or RPL11 erythroid cells after CD34+ cord blood infection with specific shRNAs at day 9 of primary human erythroid cell culture. The data are mean ± standard deviation of 3 independent experiments, relative to total heme content of shcontrol (value = 1). (B) Excess free heme in depleted RPS19, RPL5, or RPL11 erythroid cells after CD34+ cord blood infection with specific shRNAs. Pellets of 100 000 RP-depleted erythroid cells were analyzed, and OD scans were measured from 200 to 800 nm with a spectrophotometer. The day-9 measurement is shown. Free heme was calculated as the ratio between 380 nm ± 2 nm (heme band) and 560 nm ± 2 nm (hemoglobin band) (supplemental Figure 2A). The data are mean ± standard deviation of 3 independent experiments, relative to free heme content of shcontrol (value = 1). (C) Major excess free heme after depletion of RPL5 or RPL11 compared with RPS19 lentivirus–depleted erythroid cells. Immunoblots of 100 000 RPL5 or RPL11 depleted erythroid cells revealed a significant decrease in ALAS2 expression levels, whereas ALAS1 was normal, reinforcing the decreased total heme content and the specificity of the defect in erythroid cells. The iron uptake based on TfR1 expression level was decreased significantly under all conditions. Immunoblots also revealed indirect signs of the large amount of excess free heme in depleted RPL5 and RPL11 erythroid cells on the decreased BACH1 and a large increase in FLVCR1 expression levels. Proteins BACH1, FLVCR1, TfR1, ALAS2, and ALAS1 were compared with the β-actin expression level. A western blot representative of 3 experiments at day 9 of the primary erythroid cell culture is shown (statistics are shown in supplemental Figure 3B). (D) Quantification of ROS production in RPS19-, RPL5-, or RPL11-depleted erythroid cells at day 9 of erythroid culture. We show the second method used for ROS production based on flow cytometry with a CellROX Deep Red Reagent kit (Invitrogen). RPL5- and RPL11-depleted erythroid cells at day 9 produced a higher ROS compared with the control, whereas RPS19 ones exhibited a slight increase in ROS production. Data are representative of 3 experiments. (E) Brief reminder of the HRI/EIF2α pathway (adapted from Chen17 ). (F) HRI/EIF2α protein pathway analysis in DBA erythroid cells after CD34+ cord blood infection with specific shRNA-RPS19, -RPL5, -RPL11. Immunoblots of 100 000 RPS19-, RPL5-, or RPL11-depleted primary erythroid cells compared with β-actin expression and shcontrol. A western blot representative of 3 experiments at day 9 of the primary erythroid cell culture is shown (statistics are shown in supplemental Figure 3B). (G) HRI (left panel) and EIF2α (right panel) mRNA expression in DBA erythroid cells after CD34+ cord blood infection with specific shRNA-RPS19, -RPL5, -RPL11. We observed a significant decrease in HRI and EIF2α mRNA compared with the reporter gene mRNAs at day 9 of terminal erythroid differentiation. The data are mean ± standard deviation of 3 independent experiments relative to mRNA expression level of shcontrol compared with β-actin (value = 1). *P < .05, **P < .01. NS, nonsignificant.
Excess free heme in the shRNA model reproducing DBA (human primary erythroid cells depleted in RPS19, RPL5, or RPL11). (A) Quantification of the total heme in depleted RPS19, RPL5, or RPL11 erythroid cells after CD34+ cord blood infection with specific shRNAs at day 9 of primary human erythroid cell culture. The data are mean ± standard deviation of 3 independent experiments, relative to total heme content of shcontrol (value = 1). (B) Excess free heme in depleted RPS19, RPL5, or RPL11 erythroid cells after CD34+ cord blood infection with specific shRNAs. Pellets of 100 000 RP-depleted erythroid cells were analyzed, and OD scans were measured from 200 to 800 nm with a spectrophotometer. The day-9 measurement is shown. Free heme was calculated as the ratio between 380 nm ± 2 nm (heme band) and 560 nm ± 2 nm (hemoglobin band) (supplemental Figure 2A). The data are mean ± standard deviation of 3 independent experiments, relative to free heme content of shcontrol (value = 1). (C) Major excess free heme after depletion of RPL5 or RPL11 compared with RPS19 lentivirus–depleted erythroid cells. Immunoblots of 100 000 RPL5 or RPL11 depleted erythroid cells revealed a significant decrease in ALAS2 expression levels, whereas ALAS1 was normal, reinforcing the decreased total heme content and the specificity of the defect in erythroid cells. The iron uptake based on TfR1 expression level was decreased significantly under all conditions. Immunoblots also revealed indirect signs of the large amount of excess free heme in depleted RPL5 and RPL11 erythroid cells on the decreased BACH1 and a large increase in FLVCR1 expression levels. Proteins BACH1, FLVCR1, TfR1, ALAS2, and ALAS1 were compared with the β-actin expression level. A western blot representative of 3 experiments at day 9 of the primary erythroid cell culture is shown (statistics are shown in supplemental Figure 3B). (D) Quantification of ROS production in RPS19-, RPL5-, or RPL11-depleted erythroid cells at day 9 of erythroid culture. We show the second method used for ROS production based on flow cytometry with a CellROX Deep Red Reagent kit (Invitrogen). RPL5- and RPL11-depleted erythroid cells at day 9 produced a higher ROS compared with the control, whereas RPS19 ones exhibited a slight increase in ROS production. Data are representative of 3 experiments. (E) Brief reminder of the HRI/EIF2α pathway (adapted from Chen17 ). (F) HRI/EIF2α protein pathway analysis in DBA erythroid cells after CD34+ cord blood infection with specific shRNA-RPS19, -RPL5, -RPL11. Immunoblots of 100 000 RPS19-, RPL5-, or RPL11-depleted primary erythroid cells compared with β-actin expression and shcontrol. A western blot representative of 3 experiments at day 9 of the primary erythroid cell culture is shown (statistics are shown in supplemental Figure 3B). (G) HRI (left panel) and EIF2α (right panel) mRNA expression in DBA erythroid cells after CD34+ cord blood infection with specific shRNA-RPS19, -RPL5, -RPL11. We observed a significant decrease in HRI and EIF2α mRNA compared with the reporter gene mRNAs at day 9 of terminal erythroid differentiation. The data are mean ± standard deviation of 3 independent experiments relative to mRNA expression level of shcontrol compared with β-actin (value = 1). *P < .05, **P < .01. NS, nonsignificant.
As a result of the observed discrepancies between the decreased total heme and the increased free heme content following depletion of RPL5, RPL11, and RPS19, we studied heme synthesis and iron uptake in these cells in more detail. Both enzymes involved in heme synthesis, FECH and ALAS2, as well as TfR1 expression at the mRNA and protein levels, decreased in erythroid cells at day 9 following depletion of RPL5 and RPL11 and, to a lesser extent, after depletion of RPS19, supporting a global reduction in heme synthesis (Figure 2C; supplemental Figure 3). Confirming the specificity of the defect in ALAS2 dependent heme production in the erythroid lineage, housekeeping heme synthesis enzyme, ALAS1 expression was normal (Figure 2C).
To determine whether excess free heme also occurs at the BFUe and CFUe progenitor stages, we analyzed FLVCR1 and BACH1 expression levels in flow-sorted BFUe (IL3R−/CD34+/CD36−) and CFUe (IL3R−/CD34−/CD36+) cells following shRNA knockdown. Strikingly, excess free heme was noted, even at the BFUe stage, following depletion of RPL5 and RPL11, as documented by increased FLVCR1 and decreased BACH1 expression levels (supplemental Figure 4).
Ineffective HRI/EIF2α-dependent globin chain synthesis in DBA
In association with decreased levels of GATA1, expression levels of α- and β-globin chains are downregulated in RPL5-, RPL11-, and RPS19-depleted erythroid cells, but these decreases are more pronounced in RPL5- and RPL11-depleted cells (supplemental Figure 3). To assess the contribution of the defect in translation of the globin chains to the observed decrease, we studied the HRI–EIF2α/P-EIF2α pathway (Figure 2E). We found that HRI was hypophosphorylated in the primary human erythroid cells at day 9 following depletion of RPS19, RPL5, or RPL11 compared with control cells, consistent with the increased concentration of free heme in these cells (Figure 2F). As expected, due to the decreased amount of inactive HRI, P-EIF2α protein expression decreased, suggesting that EIF2α–dependent globin translation was increased in these cells to restore globin-heme balance. However, we confirmed repeatedly at the transcriptional and protein levels that α and β globin chains were decreased (supplemental Figure 3). In addition, the levels of HRI and EIF2α mRNA and protein expression are reduced in RP-depleted erythroid cells compared with the control, suggesting that, even if translation is not downregulated in the RP-depleted cells by the P-EIF2α pathway, the translation process is decreased (Figure 2F-G). Thus, the positive HRI-dependent upregulation of globin translation, in conjunction with free heme excess, seemed insufficient to adequately increase the globin chain to reduce excess heme. Thus, another mechanism is likely responsible for the decreased globin chain translation in DBA. ALAS2, HRI, and α- and β-globins are transcriptionally regulated by GATA1. Therefore, we hypothesized that GATA1 may be the root cause of the globin chain/heme imbalance in DBA.
DBA-affected patients also exhibit excess free heme, and its extent depends on the mutant RP gene
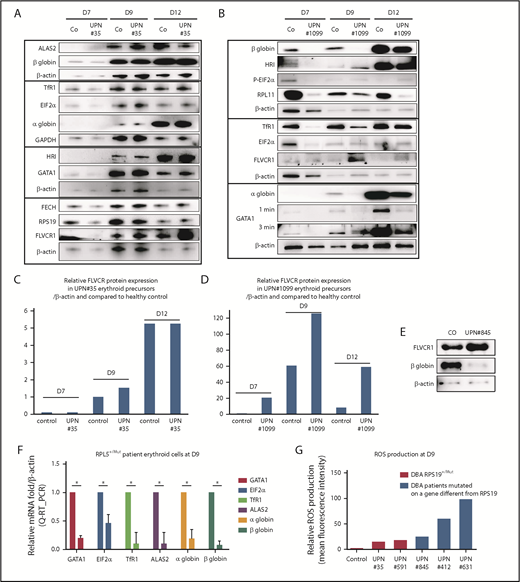
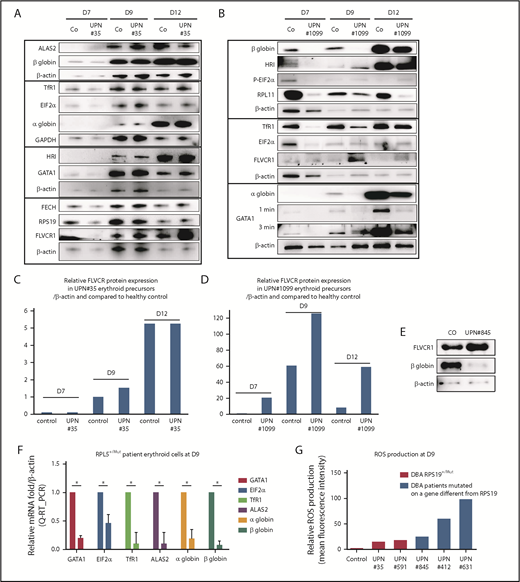
To validate the relevance of the findings from our in vitro knockdown studies of normal CD34+ cells, we quantitated free heme levels in primary erythroid cells from DBA-affected patients. Patients with a mutant RPS19 gene (RPS19+/Mut) (UPN#35 and UPN#826) exhibited a gene-expression pattern similar to that of age-matched controls for globin chains, GATA1, ALAS2, FECH, TfR1, HRI, and EIF2α (Figure 3A; supplemental Figure 5). Patients with a mutant RPL11 gene (RPL11+/Mut), such as UPN#1099, exhibited an important delay in erythroid differentiation, as shown by decreased expression of α and β globin chains, GATA1, TfR1, EIF2α, and HRI (Figure 3B-D). Interestingly, in RPS19+/Mut DBA patients and in RPL11+/Mut DBA patients, but more prominently in RPL11 cases, there is increased expression of FLVCR1 protein during the entire course of erythroid differentiation compared with controls (Figure 3A-D; supplemental Figure 5). Furthermore, in patients with a mutant RPL5 gene (RPL5+/Mut), such as UPN#845, there is also decreased expression of β globin at day 9 (Figure 3E) and large decreases in GATA1, α and β globin chains, ALAS2, EIF2α, and TfR1 mRNAs (Figure 3F). FLVCR1 protein expression was also increased compared with controls, suggesting a large excess of free heme in these cells (Figure 3E). Although we were unable to directly measure free heme in cells from DBA patients due to the low numbers of available erythroid cells, the increased expression of FLVCR1 and the decreased expression of BACH1 in RPL5 and RPL11 haploinsufficient cells lend strong support for the increased excess free heme in these cells. In addition, we found a significantly increased production of ROS in erythroid cells from RPL5+/Mut patients (UPN#845 and UPN#412) compared with controls (Figure 3G). Interestingly, we measured increased ROS production in RPS19+/Mut erythroid cells from both DBA patients (UPN#35 and UPN#591), but this increase was far less than that seen in cells with mutant RPL5 and RPL11 (Figure 3G).
DBA-affected patients also exhibit excess free heme. (A) Expression levels of the major proteins involved in heme metabolism and their regulators in a DBA patient who carried a mutation in the RPS19 gene during terminal erythroid differentiation compared with a healthy control. Immunoblots of 50 000 human primary erythroid cells in each lane obtained from purified peripheral blood CD34+ cells from the affected DBA patient (UPN#35) during terminal erythroid differentiation from day 7 (D7) to day 12 (D12). Protein expression compared with β-actin or GAPDH, depending on the size of the proteins, to optimize the numbers of proteins analyzed on the same western blot. Due the difficulty in obtaining samples from DBA patients, this patient has been studied once; other DBA-affected patients have been studied. We validated the data because the same protein profile on the western blots in all of the mutated RPS19 DBA patients have been seen (as example another mutated RPS19Mut/+ patient, supplemental Figure 5). (B) Same data as in (A) for a DBA-affected patient who carried a mutation in the RPL11 gene (UPN#1099). (C) From the immunoblot in panel A, representation of the level of protein expression of FLVCR1 in the erythroid precursors of DBA patient UPN#35 relative to β-actin and in a healthy control at each day of the studied terminal erythroid differentiation. (D) From the immunoblot in panel B, representation of the level of FLVCR1 expression in the erythroid precursors of DBA patient UPN#1099 relative to β-actin and to the healthy control during terminal erythroid differentiation (value = 1 at day 7 in the control erythroid cells). (E) Increased FLVCR1 and decreased globin expression levels in a DBA-affected patient with a mutated RPL5 gene (RPL5Mut/+) (UPN#845). (F) Relative mRNA expression of GATA1, ALAS2, EIF2α, α and β globins, and TfR1 in a DBA-affected patient (UPN#845) compared with a healthy control (value = 1). (G) Relative ROS production by various DBA-affected patients. These DBA patients carried mutations in the RPS19 or RPL5 gene or even an unknown gene compared with their healthy controls (mean fluorescence intensity = 1). *P < .05 in triplicate experiments.
DBA-affected patients also exhibit excess free heme. (A) Expression levels of the major proteins involved in heme metabolism and their regulators in a DBA patient who carried a mutation in the RPS19 gene during terminal erythroid differentiation compared with a healthy control. Immunoblots of 50 000 human primary erythroid cells in each lane obtained from purified peripheral blood CD34+ cells from the affected DBA patient (UPN#35) during terminal erythroid differentiation from day 7 (D7) to day 12 (D12). Protein expression compared with β-actin or GAPDH, depending on the size of the proteins, to optimize the numbers of proteins analyzed on the same western blot. Due the difficulty in obtaining samples from DBA patients, this patient has been studied once; other DBA-affected patients have been studied. We validated the data because the same protein profile on the western blots in all of the mutated RPS19 DBA patients have been seen (as example another mutated RPS19Mut/+ patient, supplemental Figure 5). (B) Same data as in (A) for a DBA-affected patient who carried a mutation in the RPL11 gene (UPN#1099). (C) From the immunoblot in panel A, representation of the level of protein expression of FLVCR1 in the erythroid precursors of DBA patient UPN#35 relative to β-actin and in a healthy control at each day of the studied terminal erythroid differentiation. (D) From the immunoblot in panel B, representation of the level of FLVCR1 expression in the erythroid precursors of DBA patient UPN#1099 relative to β-actin and to the healthy control during terminal erythroid differentiation (value = 1 at day 7 in the control erythroid cells). (E) Increased FLVCR1 and decreased globin expression levels in a DBA-affected patient with a mutated RPL5 gene (RPL5Mut/+) (UPN#845). (F) Relative mRNA expression of GATA1, ALAS2, EIF2α, α and β globins, and TfR1 in a DBA-affected patient (UPN#845) compared with a healthy control (value = 1). (G) Relative ROS production by various DBA-affected patients. These DBA patients carried mutations in the RPS19 or RPL5 gene or even an unknown gene compared with their healthy controls (mean fluorescence intensity = 1). *P < .05 in triplicate experiments.
HSP70 overexpression rescues GATA1 expression, decreases excess free heme, and rescues the heme/globin imbalance
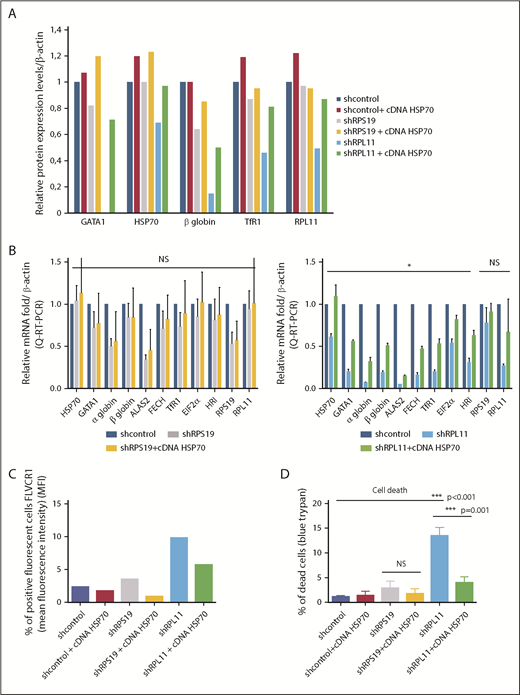
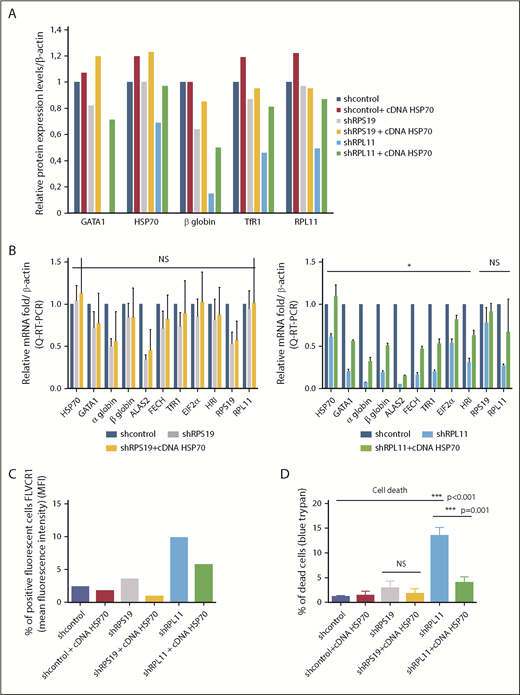
We have previously shown15 that, in haploinsufficient RPL5 or RPL11 erythroid cells, HSP70 is subjected to proteasomal degradation leading to decreased levels of GATA1. Because ALAS2 and HRI are GATA1 targets, we hypothesized that decreased HSP70 may contribute to the imbalance in heme/globin synthesis resulting in an excess of free heme. Overexpression of wild-type HSP70 complementary DNA (cDNA) in RPL11-depleted human erythroid primary cells increased mRNA and protein levels of HSP70 with a resultant increase in GATA1 expression levels, which, in turn, restored the expression of globin levels and improved cell hemoglobinization (Figure 4A-B [lower panel]). As expected, increased mRNA expression of GATA1 targets, such as ALAS2 and HRI, was noted along with increased expression of other proteins, such as FECH, TfR1, and EIF2α, following HSP70 overexpression (Figure 4A-B). The effect of HSP70 in RPS19-depleted cells was much less pronounced and was not significant. FLVCR1 expression, as monitored by flow cytometry, decreased following HSP70 overexpression in RPS19- and RPL11-depleted cells (Figure 4C). Because excess free heme induces ROS production, we analyzed ROS levels in RPL11-depleted erythroid cells transduced with wild-type HSP70 cDNA and observed a reduction in ROS compared with controls (data not shown), with a resultant decrease in cell death (Figure 4D). Taken together, the findings from HSP70 rescue experiments imply that restoring the globin/heme balance will improve erythropoiesis by reducing the toxic free heme content of erythroid cells.
HSP70 overexpression rescued GATA1 expression, decreased ROS production, limited free heme content, and rescued the heme/globin balance. (A) Relative protein expression of GATA1, HSP70, β-globin chain, TfR1, and RPL11 after depletion of RPS19 or RPL11 in primary erythroid cells and rescue with overexpression of wild-type HSP70 cDNA. Data at day 9 of terminal erythroid culture, obtained from immunoblots of 100 000 human erythroid primary cells derived from CD34+ cells from cord blood and depleted in RPS19 or RPL11 by specific shRNAs. Proteins are compared with β-actin. The data are relative to the protein expression levels in the shcontrol for each protein studied (value = 1). (B) Relative mRNA expression compared with β-actin and shcontrol gene expression (value = 1) after depletion of erythroid cells in RPS19 (left panel) or RPL11 (right panel) mRNA after cord blood CD34+ cell lentiviral infection by specific shRNAs and rescue with overexpression of wild-type HSP70 cDNA. The data are mean ± standard deviation of 3 independent experiments and correspond to the relative mRNA expression of each gene (HSP70, GATA1, α and β globin, ALAS2, FECH, TfR1, EIF2α, HRI, RPS19, and RPL11) compared with the reporter genes, such β-actin, and the shcontrol (value = 1). No significant effect of HSP70 overexpression has been noted in depleted RPS19 erythroid cells (left panel), whereas a significant increase in all mRNAs tested, with the exception of RPS19 and RPL11 mRNA, was found after HSP70 overexpression in depleted RPL11 erythroid cells (right panel). (C) HSP70 overexpression rescued the FLVCR1 increase in depleted RPS19 erythroid cells and, to a greater extent, in depleted RPL11 erythroid cells. (D) HSP70 overexpression significantly increased erythroid cell survival in depleted RPL11 erythroid cells. Cell mortality was assessed with 0.2% trypan blue. The data are mean ± standard deviation of 3 independent experiments. *P < .05, ***P ≤ .001.
HSP70 overexpression rescued GATA1 expression, decreased ROS production, limited free heme content, and rescued the heme/globin balance. (A) Relative protein expression of GATA1, HSP70, β-globin chain, TfR1, and RPL11 after depletion of RPS19 or RPL11 in primary erythroid cells and rescue with overexpression of wild-type HSP70 cDNA. Data at day 9 of terminal erythroid culture, obtained from immunoblots of 100 000 human erythroid primary cells derived from CD34+ cells from cord blood and depleted in RPS19 or RPL11 by specific shRNAs. Proteins are compared with β-actin. The data are relative to the protein expression levels in the shcontrol for each protein studied (value = 1). (B) Relative mRNA expression compared with β-actin and shcontrol gene expression (value = 1) after depletion of erythroid cells in RPS19 (left panel) or RPL11 (right panel) mRNA after cord blood CD34+ cell lentiviral infection by specific shRNAs and rescue with overexpression of wild-type HSP70 cDNA. The data are mean ± standard deviation of 3 independent experiments and correspond to the relative mRNA expression of each gene (HSP70, GATA1, α and β globin, ALAS2, FECH, TfR1, EIF2α, HRI, RPS19, and RPL11) compared with the reporter genes, such β-actin, and the shcontrol (value = 1). No significant effect of HSP70 overexpression has been noted in depleted RPS19 erythroid cells (left panel), whereas a significant increase in all mRNAs tested, with the exception of RPS19 and RPL11 mRNA, was found after HSP70 overexpression in depleted RPL11 erythroid cells (right panel). (C) HSP70 overexpression rescued the FLVCR1 increase in depleted RPS19 erythroid cells and, to a greater extent, in depleted RPL11 erythroid cells. (D) HSP70 overexpression significantly increased erythroid cell survival in depleted RPL11 erythroid cells. Cell mortality was assessed with 0.2% trypan blue. The data are mean ± standard deviation of 3 independent experiments. *P < .05, ***P ≤ .001.
Heme induces decreased HSP70 expression
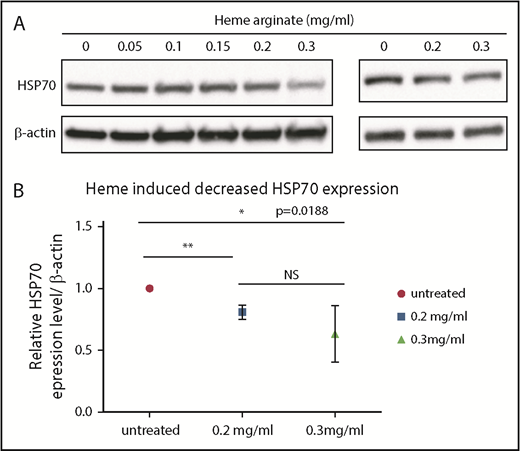
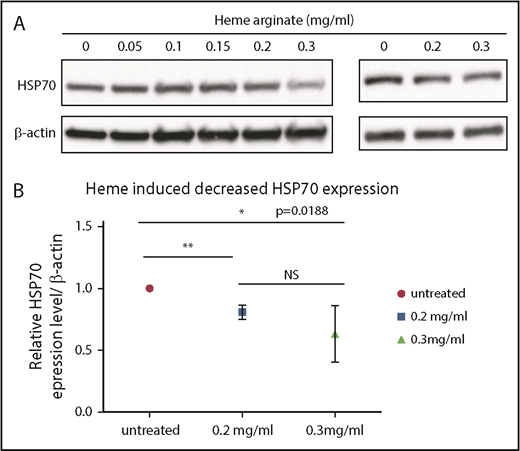
Because we documented a link between the defect in HSP70 in the RPL5 and RPL11 DBA in vitro phenotype and excess of free heme, we wondered whether an increase in cell heme content will affect HSP70 expression. UT-7–EPO cells (Figure 5A, left panel) and healthy human erythroid primary cells (Figure 5A [right panel]-B) were treated with varying concentrations of heme arginate. Strikingly, a significant decrease in HSP70 expression could be documented starting at 0.2 mg/mL heme arginate (Figure 5). This finding suggests that excess free heme after HSP70 depletion is self-sustaining: a depletion in HSP70 increases excess free heme in erythroid cells, and this secondary excess further exacerbates the decrease in HSP70.
Heme induced a decrease in HSP70 expression. (A) Immunoblots performed using lysates of UT7 cells (left panel) or day-2 CD36+ human primary erythroid cells (right panel) that were treated for 4 hours with the indicated concentrations of heme arginate. (B) Immunoblot quantification. Values are quantified relative to actin and normalized to untreated cells. The mean ± standard deviation of 4 experiments are shown. *P < .05, **P < .01, unpaired Student t test.
Heme induced a decrease in HSP70 expression. (A) Immunoblots performed using lysates of UT7 cells (left panel) or day-2 CD36+ human primary erythroid cells (right panel) that were treated for 4 hours with the indicated concentrations of heme arginate. (B) Immunoblot quantification. Values are quantified relative to actin and normalized to untreated cells. The mean ± standard deviation of 4 experiments are shown. *P < .05, **P < .01, unpaired Student t test.
Discussion
Our findings implicate an important role for imbalances in heme/globin synthesis and excess free heme in erythroid progenitors and precursors in the disordered erythropoiesis of DBA. We identified an important role for HSP70 in this imbalance and documented that HSP70 overexpression decreased excess free heme and restored globin synthesis.
A role for free heme accumulation resulting in the erythroid phenotype of DBA had been previously reported in murine systems and in human cell models29,34,35 ; however, to our knowledge, our findings are the first to document its role in RPL5- or RPL11-depleted early progenitors (BFUe and CFUe) and in primary human precursor erythroid cells derived from various DBA-affected patients with free heme accumulation depending on the mutated RP gene. Furthermore, in normal erythroid progenitor and precursor cells, we were able to characterize heme excess when the globin chain synthesis starts at the CFUe stage, and heme can be incorporated into the globin chains. Indeed, we observed from day 0 to day 4, prior to globin chain production, that heme biosynthesis enzymes, ALAS1, and, to a lesser extent, ALAS2 and FECH, are already expressed.
Interestingly, in spite of the previous studies in mice29 or in cell lines36 that suggested the lower expression of FLVCR1 in the erythroid phenotype mimicking DBA, we found increased expression of FLCVR1 in erythroid cells of DBA patients and in erythroid cells following knockdown of RPL5, RPL11, and RPS19. These findings imply that FLVCR1 indeed plays a regulatory role in controlling excess heme content of human erythroid cells. Recently, in TF-1 and K562 cells, knockdown of RPS19 resulted in decreased transcription of FLVCR1a compared with controls, but FLVCR1 protein levels were not assessed in the study. Nevertheless, the knockdown cells showed increased ROS production and apoptosis.37 In contrast to the findings from cell lines and in accordance with our findings, a recent study showed an increase in FLVCR1a transcriptional expression in 3 RPS19-mutated DBA patients at the end of erythroid differentiation.38
We confirmed, at the transcriptional and translational levels, decreased expression of α and β globin chain expression in DBA, but we showed for the first time that the globin defect was present as early as the CFUe erythroid progenitor stage. This defect is more extensive in progenitor cells depleted of RPL5 and RPL11 than in cells depleted of RPS19. Although the hemoglobinization defect with reduced α and β mRNA and protein expression levels is to be expected in DBA, it was indeed surprising that it is found as early as the erythroid progenitor stage. In morpholino zebrafish models of depletion of rpl539 or rps19, rpl11,40 as in our studies, the expression levels of the globin chain varied, with a major decrease in globin expression in rpl5 gene– and rpl11 gene–depleted cells and a more modest decrease in the rps19 gene–depleted ones, confirming our data regarding 2 distinct phenotypes in vitro.
We15 and other investigators41,42 have previously shown that the level of GATA1 protein expression is decreased in DBA and that this is responsible for the delay in erythroid differentiation and the increased apoptosis of erythroid cells, which are more extensive in patients with a genotype different from mutated RPS19 gene. Importantly, in the present study, we documented excess free heme in erythroid cells, in particular in the DBA-affected patients who carry a mutation in the RPL5 or RPL11 gene or in CD34+ primary erythroid cells depleted in RPL5 or RPL11, by showing increased expression of the adaptive intracellular pathways that limit the toxicity of the free heme (apoptosis and ROS production). However, the increased expression of these adaptive and heme scavengers was insufficient to prevent toxicity in haploinsufficient RPL5 or RPL11 DBA patients. In contrast, in the less severe in vitro phenotype15 (ie, DBA-affected patients who carry a mutation in RPS19 gene), the increased expression of these adaptive and heme scavengers was sufficient to reduce the excess heme to limit its toxicity.
In our previous studies, we reported in the RPL5 or RPL11 in vitro phenotype that, as a consequence of proteasomal degradation, HSP70 is not able to translocate into the nucleus and protect GATA1 cleavage by caspase 3 during terminal erythropoiesis upon EPO stimulation.15 Caspase 3–dependent GATA1 cleavage43,44 leads to decreased GATA1 expression, p53 activation, and, consequently, increased apoptosis.15 Overexpression of wild-type HPS70 cDNA increased GATA1 expression in the nucleus, restoring erythroid proliferation and differentiation, and decreased p53 activation and apoptosis.15 In the present study, we explored the hypothesis that the HSP70/GATA1 axis, by controlling heme-regulated globin synthesis, also regulates excess free heme in erythroid cells. Indeed, we confirmed that HSP70 is a major factor involved in the imbalance between heme/globin synthesis by documenting that HSP70 overexpression was able to increase α and β globin expression in RPL11-depleted erythroid cells, as well as increased iron uptake (increased TfR1) and heme synthesis (increased ALAS2 and FECH) to restore the heme/globin equilibrium. Thus, the importance of HSP70 in DBA is related to its effect on GATA1 expression, as well as to its role as a key protein chaperone of HRI promoting HRI inactivation and enhancing translation.45
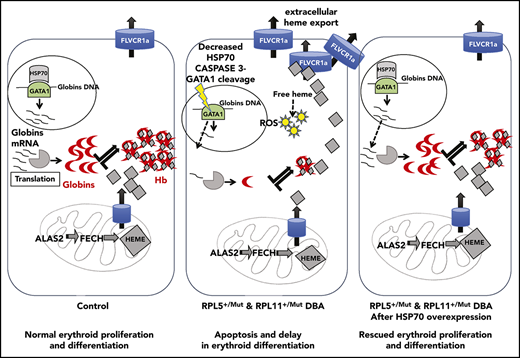
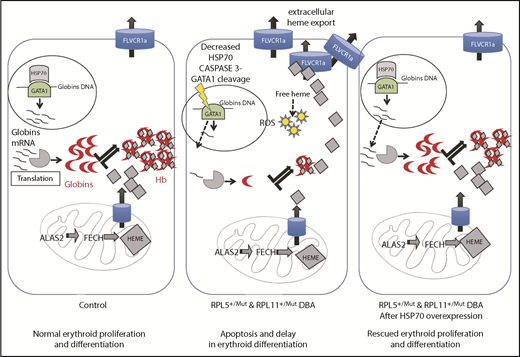
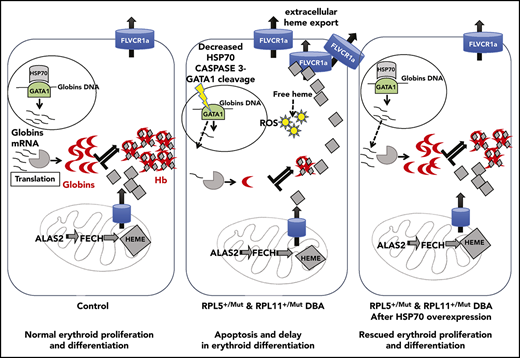
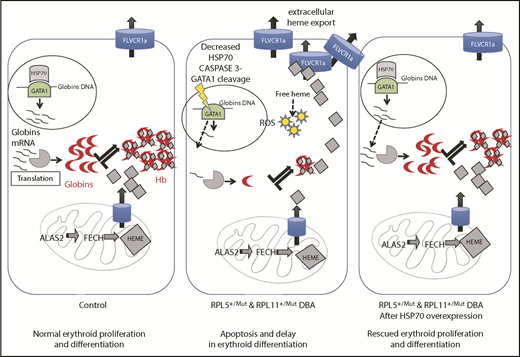
In summary, as illustrated in Figure 6, we critically validated a major and central role for the HSP70/GATA1 axis in the intrinsic erythroid defect in DBA. A model integrating all of our findings summarizes how HSP70 accounts for the intrinsic defect in DBA by controlling not only erythroid differentiation and survival in DBA via GATA1 but also excess free heme, resulting from the imbalanced heme/globin equilibrium, either via a GATA1 defect, as well as its role as an HRI chaperone.
Take home message of this study. Model integrating all of our findings about how HSP70 accounts for the intrinsic defect in DBA by controlling erythroid differentiation and survival in DBA via GATA1, as well as excess free heme, resulting from the imbalanced heme/globin equilibrium.
Take home message of this study. Model integrating all of our findings about how HSP70 accounts for the intrinsic defect in DBA by controlling erythroid differentiation and survival in DBA via GATA1, as well as excess free heme, resulting from the imbalanced heme/globin equilibrium.
The online version of this article contains a data supplement.
The publication costs of this article were defrayed in part by page charge payment. Therefore, and solely to indicate this fact, this article is hereby marked “advertisement” in accordance with 18 USC section 1734.
Acknowledgments
The authors are grateful to the patients affected with DBA and their families, the French DBA patients association AFMBD, and the Maria Daniella Arturi and DBA foundations. The authors recognize Gil Tchernia for his inspiration, scientific discussions, and perpetual interest in DBA. The authors thank Carole Beaumont for scientific discussions, Isabelle Marie for efforts with the French DBA registry, and Julie Galimand, Hélène Bourdeau, and Laurène Guion for work related to DBA patient mutation screening analysis (Hematology Laboratory, R. Debré Hospital, Paris). They also thank Metafora Biosystems (Vincent Petit and Luc Auriol, Evry, France) for providing the FLVCR–receptor binding domain kit.
This work was supported by the French National Research Agency (ANR): the ANR-HSPathies-ANR-2012-BLAN-SVSE1, ANR-2015-AAP générique-CE12, the laboratory of excellence for Red cells (LABEX GR-Ex)-ANR Avenir-11-LABX-0005-02 (PhD funding for S.R.), and e-RARE ANR-15-RAR3-0007-04 and ANR-12-RARE-0007-02. The work was also supported by The French National PHRC-AOM09177 (OFABD), The Fondation ARC pour la recherche contre le cancer (PhD funding for M.G.) (DOC20150602868), and National Institutes of Health, National Institute of Diabetes and Digestive and Kidney Diseases grant DK32094.
Authorship
Contribution: L.D.C., H.P., and L.G. conceived the project; S.R., M.G., N.K., R.D., and A.M.-G. performed the research; C.S. designed RT-qPCR; J.E.B. mentored S.R. for ROS techniques; S.A. mentored S.R. for free heme content measurement; J.L. provided human cord blood; T.L. provided clinical data and samples; N.M. and J.-J.C. provided scientific input; N.M. mentored N.K. for the erythroid cell culture synchronization experiments; S.R., M.G., N.K., R.D., H.M., H.P., Z.K., L.G., and L.D.C analyzed the data; T.S., G.C., and O.H. provided data on heme arginate erythroid cell treatment; and L.D.C., N.M., L.G., and H.P. wrote the manuscript with input from all authors.
Conflict-of-interest disclosure: The authors declare no competing financial interests.
Correspondence: Lydie Da Costa, Hôpital Robert Debré, Service d’Hématologie Biologique, 48 Blvd Sérurier, 75019 Paris, France; e-mail: lydie.dacosta@aphp.fr.
REFERENCES
Author notes
S.R. and M.G. contributed equally to this work.

