Key Points
Peripheral T-cell lymphomas have distinct DNMT3A mutation patterns and prognostic outcomes.
DNMT3A mutations are associated with an activated, cytotoxic phenotype in the PTCL-TBX21 subtype.
Abstract
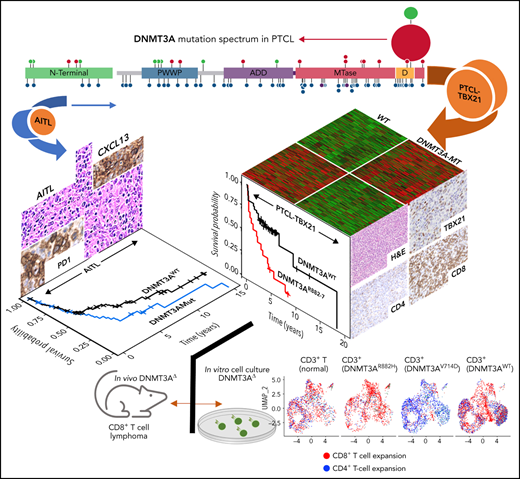
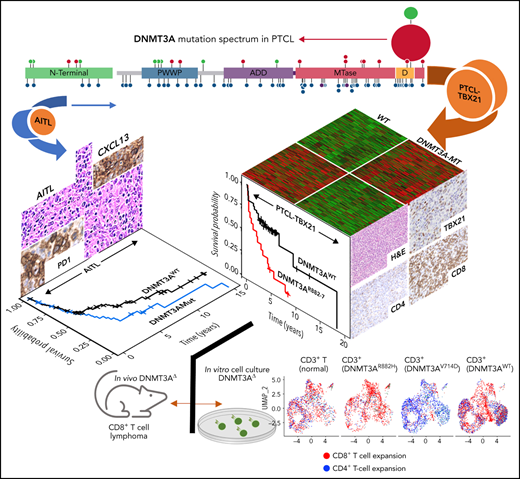
Peripheral T-cell lymphomas (PTCLs) are heterogenous T-cell neoplasms often associated with epigenetic dysregulation. We investigated de novo DNA methyltransferase 3A (DNMT3A) mutations in common PTCL entities, including angioimmunoblastic T-cell lymphoma and novel molecular subtypes identified within PTCL–not otherwise specified (PTCL-NOS) designated as PTCL-GATA3 and PTCL-TBX21. DNMT3A-mutated PTCL-TBX21 cases showed inferior overall survival (OS), with DNMT3A-mutated residues skewed toward the methyltransferase domain and dimerization motif (S881–R887). Transcriptional profiling demonstrated significant enrichment of activated CD8+ T-cell cytotoxic gene signatures in the DNMT3A-mutant PTCL-TBX21 cases, which was further validated using immunohistochemistry. Genomewide methylation analysis of DNMT3A-mutant vs wild-type (WT) PTCL-TBX21 cases demonstrated hypomethylation in target genes regulating interferon-γ (IFN-γ), T-cell receptor signaling, and EOMES (eomesodermin), a master transcriptional regulator of cytotoxic effector cells. Similar findings were observed in a murine model of PTCL with Dnmt3a loss (in vivo) and further validated in vitro by ectopic expression of DNMT3A mutants (DNMT3A-R882, -Q886, and -V716, vs WT) in CD8+ T-cell line, resulting in T-cell activation and EOMES upregulation. Furthermore, stable, ectopic expression of the DNMT3A mutants in primary CD3+ T-cell cultures resulted in the preferential outgrowth of CD8+ T cells with DNMT3AR882H mutation. Single-cell RNA sequencing(RNA-seq) analysis of CD3+ T cells revealed differential CD8+ T-cell subset polarization, mirroring findings in DNMT3A-mutated PTCL-TBX21 and validating the cytotoxic and T-cell memory transcriptional programs associated with the DNMT3AR882H mutation. Our findings indicate that DNMT3A mutations define a cytotoxic subset in PTCL-TBX21 with prognostic significance and thus may further refine pathological heterogeneity in PTCL-NOS and suggest alternative treatment strategies for this subset.
Introduction
Non-Hodgkin lymphomas (NHLs) derived from mature T cells represent a highly heterogeneous group of malignancies with varied morphological and clinical features. These entities represent ∼10% to 15% of NHLs in the Western world1,2 with an increasing incidence of 4% per annum in the United States.3,4 The World Health Organization currently recognizes at least 29 categories of mature T cell and natural killer cell (NK)/NHLs with angioimmunoblastic T-cell lymphoma (AITL) and peripheral T-cell lymphomas–not otherwise specified (PTCL-NOS) accounting for >40% of diagnoses.5 Currently, T-cell NHLs (T-NHLs) are diagnosed with a discrete set of immunohistochemical markers in combination with clinical and pathological features; however, 30% to 50% of cases cannot be classified using current methods and are categorized as PTCL-NOS, which represents the most prevalent PTCL group.6,7
To better understand the pathobiology, in-depth genomic approaches, including gene expression profiling (GEP),8-13 copy number alteration analysis,14-16 and next-generation sequencing, have been performed in major PTCL subgroups.17-20 These efforts have generated robust molecular classifiers for PTCL entities and meaningful subclassification of PTCL-NOS.18 Transcriptional profiling has demonstrated 2 major biological subgroups, designated as PTCL-TBX21 and PTCL-GATA3, within PTCL-NOS, suggesting distinct cells-of-origin (TH1/CD8+ and TH2, respectively)11,12,15 with significant differences in clinical outcome and unique oncogenic drivers.15 The prognostic significance has been further validated in an independent PTCL-NOS cohort using immunohistochemistry approaches.21-24 In our earlier studies, we identified 2 cytotoxic subtypes within PTCL-NOS, one with transcriptomic signatures like NK-cell and designated as γδ-PTCLs upon detailed morphological and immunohistochemical analysis.10 The second distinct cytotoxic subtype within PTCL-NOS, called cytotoxic (αβ)-PTCL, had transcriptomic signatures similar to CD8+ T cells and enrichment in interferon-γ (IFN-γ) signaling, including TBX21 and EOMES (eomesodermin) with inferior OS compared with other PTCL-NOS.11 Subsequent studies revealed that latter subtype was associated with PTCL-TBX21 and exhibited high expression of cytotoxic molecules and a depleted tumor milieu.11,12
While there are no singular defining genetic features of major PTCL entities (with the exception of anaplastic lymphoma kinase positive anaplastic large cell lymphoma), recurrent mutations in epigenetic regulators25-27 and mutations leading to T-cell activation17,28-30 dominate the genomic landscape in major PTCL subtypes. The most studied of these recurrent mutations (ie, TET2 and RHOAG17V or IDH2R172K) have been associated with a T-follicular helper(TFH) phenotype and the latter being unique to AITL.31-34 Conversely, less studied is the impact of mutations in DNMT3A, a highly conserved DNA methyltransferase that catalyzes the 5mC modification35 and interacts with histones and transcription factors through several regulatory domains to regulate gene expression.36,37 DNMT3A mutations have been shown to be prognostic and biologically significant in acute myeloid leukemia (AML)38,39 and T-cell acute lymphoblastic leukemia (T-ALL),40,41 warranting more intensive study in other hematological malignancies. While the DNMT3A mutational profile in PTCL entities indicates loss of function, as aberrations target the entire coding region, hotspot mutations (eg, DNMT3AR882) are predicted to affect dimerization and protein: DNA interaction has been observed and is preferentially found in PTCL-NOS as compared with AITL.42,43 Herein, we examined DNMT3A mutations in the molecular subgroups of PTCL12 and observed distinct biological and prognostic significance associated with these mutations. PTCL-TBX21 cases with DNMT3A mutations bore a resemblance to our previously described αβ cytotoxic-PTCL subgroup featuring a high expression of CD8+ T-cell signatures and the key transcription factor EOMES.
Material and methods
Patient materials, molecular classification, and data availability
Three hundred and thirty-five PTCL cases were included; summary information and data availability are included in supplemental Table 1. PTCL specimens were collected from the Nebraska Lymphoma Study Group Registry and Tissue Bank, the International Peripheral T-cell Lymphoma Consortium, or in collaborative efforts. The details regarding the PTCL diagnosis and full curation of these samples have been extensively described.10-12,15,21,28,30 Cases with HG-U133 plus2 expression data (Affymetrix, Inc) and their classification have been previously described.10-12,15,21,28,30
Sequencing and variant calling
The custom capture targeted, amplicon sequencing, RNA sequencing (RNA-Seq), and variant calling were carried out in accordance with our previous reports15,27,29
Overall survival (OS) outcome analysis
The estimation of the differences in OS was assessed using the Kaplan-Meier method and log-rank test. All patients were treated with cyclophosphamide, hydroxydaunorubicin, Oncovin, and prednisone (CHOP) or a CHOP-based regimen, and statistical differences among subgroups were considered significant at P < .05.
Gene expression analysis
The GEP was generated using HG-U133-plus 2.0 arrays (Affymetrix, Inc) or RNA-Seq. Data analysis is described in the supplemental material.
DNA methylation data analysis
Methylated DNA immunoprecipitation sequencing (MeDIP-Seq) was performed using the MeDIP-Seq kit from Diagenode. Details on assay performance and analyses are described in the supplement. Summary data can be found in supplemental Tables 2-4.
Single-cell RNA-Seq
CD3+ T cells were cultured for 3 days in the presence of 50 U/mL interleukin-2 (IL-2) and 0.5× CD3 and CD28 beads (Gibco, Inc) to ensure high cell viability. We employed a recently developed approach for single cell RNA-seq multiplexing44 (ie, CD3+ T cells transduced with different DNMT3A mutants, DNMT3AWT, DNMT3AR882H, DNMT3AV716D, and control CD3+ T cells) labeled with sample-specific “hashtags” (ie, DNA-barcoded antibodies) and performed CITE-seq (Cellular Indexing of Transcriptomes and Epitopes by sequencing) simultaneously to generate separate sequencing libraries. Details of cell culture, expression vector antibodies, and sequencing procedures and analysis are described in the supplemental material and supplemental Table 5.
Statistical analyses
Statistical tests and P value cutoffs for OS and bioinformatics analyses are as described above. For all else, comparisons between 2 groups were conducted using a 2-tailed Student t test, and comparisons between ≥3 groups were conducted using a one-way ANOVA with corrections for multiple comparisons within GraphPad Prism 8. P values < .05 were considered significant.
Data sharing
Data can be found at accession numbers GSE204877 (me-DIP) and GSE204876 (RNA-seq).
Results
Patient cohort, molecular classification, and DNMT3A mutation spectrum in molecular PTCL subtypes
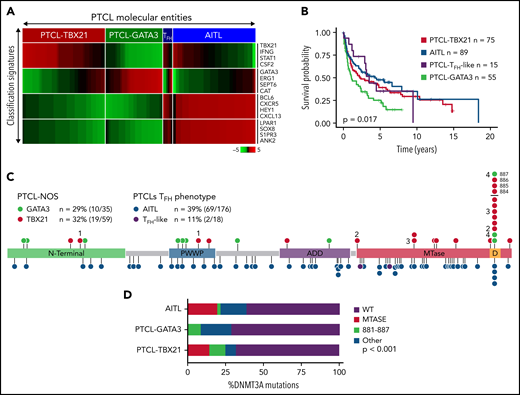
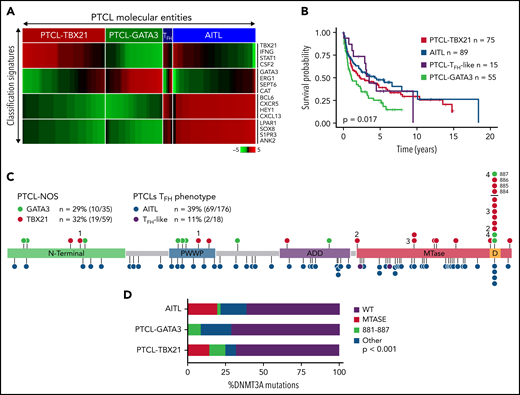
PTCL-NOS cases (n = 159) were classified using our GEP signatures (Figure 1A and supplemental Table 6)11,12,15 and subclassified into either PTCL-TBX21 (n = 80) or PTCL-GATA3 (n = 61) following exclusion of PTCL cases with TFH phenotype5,45 (PTCL-TFH) (n = 18 cases). These cases (n = 18) and AITL cases (n = 176) were included for comparative purposes. The clinical features and OS data (available for n = 234 cases) are similar to previously published reports (Figure 1B).11,12,15,21,45
DNMT3A mutations in peripheral T-cell lymphoma entities. (A) Heatmap of the molecular PTCL classification signatures. (B) Kaplan-Meier curve of the OS of PTCL cases included in this study. (C) Lollipop plot of DNMT3A mutations in PTCL-NOS molecular subtypes (top) and PTCLs of TFH origin (bottom). Lollipops represent mutated residues; cases with >1 mutation plotted are identified numerically. Mutations in the dimerization region (S881-R887) past R882 (884, 885, 886, and 887) are stacked above for visual clarity. (D) Graph of the distribution of DNMT3A mutations per PTCL entity.
DNMT3A mutations in peripheral T-cell lymphoma entities. (A) Heatmap of the molecular PTCL classification signatures. (B) Kaplan-Meier curve of the OS of PTCL cases included in this study. (C) Lollipop plot of DNMT3A mutations in PTCL-NOS molecular subtypes (top) and PTCLs of TFH origin (bottom). Lollipops represent mutated residues; cases with >1 mutation plotted are identified numerically. Mutations in the dimerization region (S881-R887) past R882 (884, 885, 886, and 887) are stacked above for visual clarity. (D) Graph of the distribution of DNMT3A mutations per PTCL entity.
Targeted-, whole-exome–, and RNA-Seq approaches were used to interrogate DNMT3A mutations in the PTCL-TBX21 and PTCL-GATA3 subtypes and PTCLs with TFH origin (ie, PTCL-TFH–like and AITL) (n = 288) (Figure 1C and supplemental Table 1). DNMT3A mutations were observed in ∼30% of PTCL entities, consistent with the earlier studies (Figure 1C).46,47 However, there was a marked difference in the distribution of the mutated residues within the functional domains of DNMT3A (ie, N-terminal, PWWP, ATRX-DNMT3-DNMT3L (ADD), and methyltransferase) in the molecular subtypes (Fisher’s exact, P < .01) (Figure 1D). DNMT3A mutations in AITL were observed throughout the coding region and infrequently at the R882 hotspot residue within the methyltransferase (MTase) domain (n = 4 mutations, 6% of mutant cases). In contrast, DNMT3A mutations in PTCL-NOS molecular subtype cases were almost exclusively within functional domains and featured the R882H/C hotspot mutation at rates comparable to T-ALL40,41 and AML48 (n = 8 mutations, ∼28% of mutant cases). In addition, several novel mutations within the dimerization region (defined as S881-R887) (n = 12 mutations across n = 11 cases, ∼38% of mutant cases) were present in PTCL-NOS molecular subtypes. When the mutation spectrum was correlated with molecular subtypes, there was a skewed distribution, with mutations in the MTase domain and dimerization region (n = 16 cases, ∼84% of mutant cases) most prominently seen in the PTCL-TBX21 subtype, whereas aberrations outside the MTase domain were mostly present in PTCL-GATA3 subtype (Figure 1C-D). Among AITL, PTCL-GATA3, and PTCL-TBX21, there was no difference in DNMT3A variant allele frequencies and DNMT3A mutations regardless of type or localization, and they did not influence gene expression in PTCL cases analyzed (supplemental Figure 1A-C). Since DNMT3A mutants show cooccurrence with TET2 mutations in AITL,25 we observed such cooccurrence in the PTCL-TBX21 subtype, albeit less frequently, with similar observations with respect to RHOAG17V mutations when compared with other molecular PTCL entities (supplemental Figure 1E-F).
Prognostic significance of DNMT3A mutations
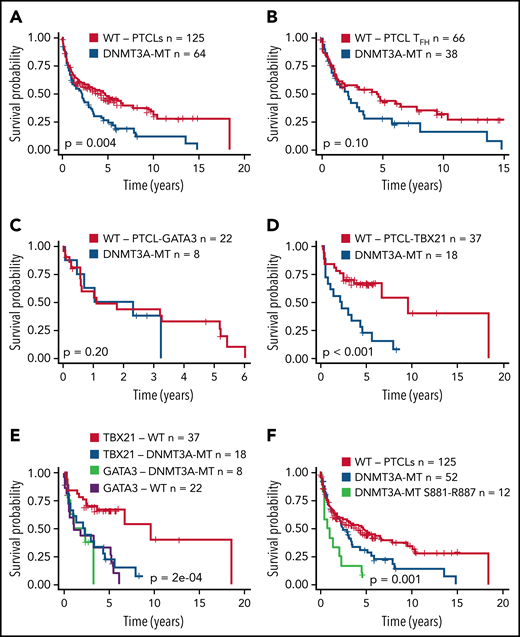
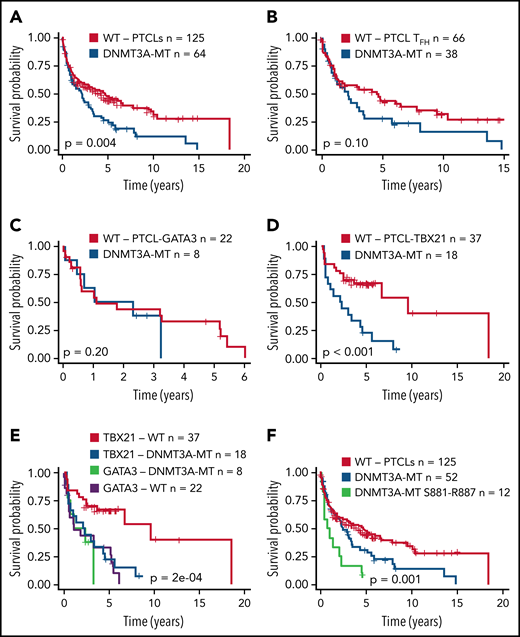
Several studies have shown an association of DNMT3A mutations with poor clinical outcomes in myeloid neoplasms38,49 or T-ALL.40,41 We observed a significant association of DNMT3A mutations with inferior OS in the entire PTCL cohort (P = .004) (Figure 2A). When correlated with molecular subtypes, a nonsignificant trend was observed in AITL and TFH lymphomas (P = .1) (Figure 2B), with no significant difference in PTCL-GATA3 (Figure 2C). Strikingly, DNMT3A mutations in PTCL-TB21 were significantly associated with inferior OS (P < .001) (Figure 2D), with these samples presenting with a similarly poor outcome to the PTCL-GATA3 subtype (Figure 2E). When analyzing the entire cohort, the mutations in the protein dimerization region of DNMT3A (residues S881-R887) were observed to be associated with the worst OS (Figure 2F), but the exclusion of these samples did not influence the prognostic significance of other DNMT3A mutations (Figure 2F).
Prognostic significance of DNMT3A mutations in peripheral T-cell lymphoma entities. (A) Kaplan-Meier curve of the OS of DNMT3A-MT and WT cases for the entire PTCL cohort. All patients were treated with a CHOP-based regimen. (B) OS for DNMT3A-MT and WT cases for PTCLs of TFH origin (AITL n = 89, PTCLTFH-like = 15). (C) OS for DNMT3A-MT and WT cases for PTCL-GATA3. (D) OS for DNMT3A-MT and WT cases for PTCL-TBX21. (E) OS comparison of PTCL-TBX21 and PTCL-GATA3 cases with respect to DNMT3A mutation status. (F) OS of DNMT3A mutants within the dimerization region (881-887), other DNMT3A mutants, and WT cases for the entire PTCL cohort. MT, mutant.
Prognostic significance of DNMT3A mutations in peripheral T-cell lymphoma entities. (A) Kaplan-Meier curve of the OS of DNMT3A-MT and WT cases for the entire PTCL cohort. All patients were treated with a CHOP-based regimen. (B) OS for DNMT3A-MT and WT cases for PTCLs of TFH origin (AITL n = 89, PTCLTFH-like = 15). (C) OS for DNMT3A-MT and WT cases for PTCL-GATA3. (D) OS for DNMT3A-MT and WT cases for PTCL-TBX21. (E) OS comparison of PTCL-TBX21 and PTCL-GATA3 cases with respect to DNMT3A mutation status. (F) OS of DNMT3A mutants within the dimerization region (881-887), other DNMT3A mutants, and WT cases for the entire PTCL cohort. MT, mutant.
DNMT3A mutations associate with a T-cytotoxic group within the PTCL-TBX21 subtype
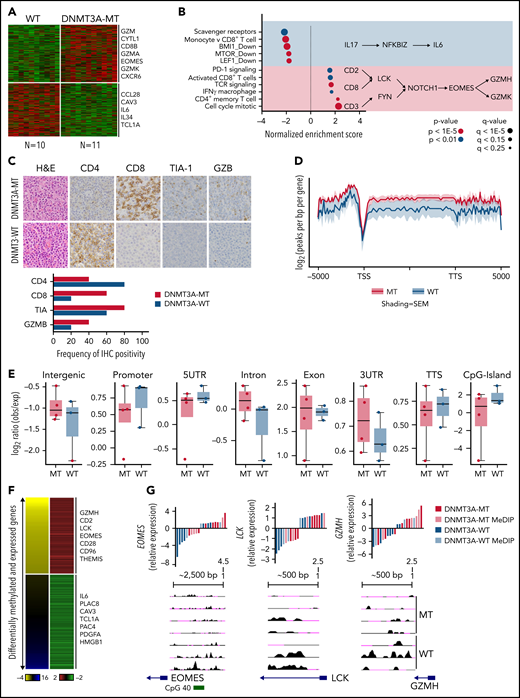
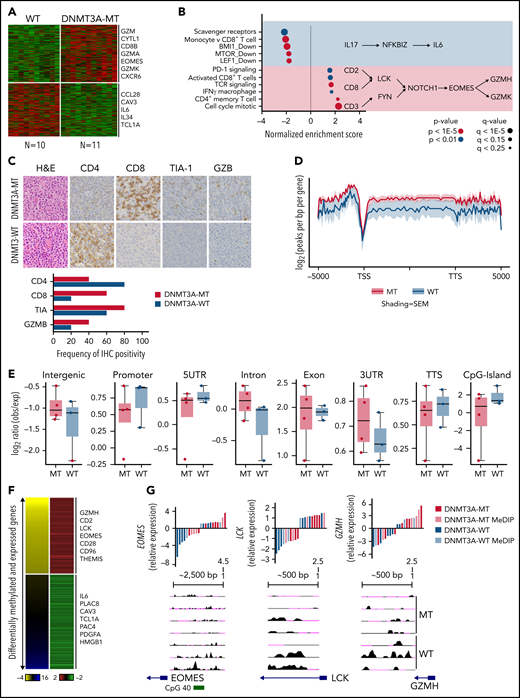
As shown above, DNMT3A mutations show prognostic significance in PTCL-TBX21. Therefore, we analyzed GEP data of the DNMT3A-mutant (DNMT3A-MT) vs wild-type (DNMT3A-WT) cases in PTCL-TBX21 (Figure 3A and supplemental Table 7). We observed an upregulation of several CD8+ T-cell genes associated with cytotoxic function (eg, EOMES, GZMA, KLRC4, and CD8B) in DNMT3A-MT PTCL-TBX21 cases, with these genes being highly expressed in activated (in vitro stimulation) CD8+ T cells (supplemental Figure 2A). Gene set enrichment analysis50 and cell-type signature analyses (CIBERSORT51 and xCell52) revealed DNMT3A-MT cases had an enrichment for activated CD8+ T-cell genes, CD4+ memory T-cell genes, IFN-γ gene signatures, T-cell receptor (TCR) signaling genes, and proliferation signatures, suggesting an increased cytotoxic phenotype in DNMT3A-MT PTCL-TBX21 cases (Figure 3B and supplemental Figure 2B-C).
DNMT3A-MT PTCL-TBX21 cases are enriched for an activated CD8+ cytotoxic phenotype. (A) Heatmap of differentially expressed genes between DNMT3A-MT and WT PTCL-TBX21 cases. (B) Gene set enrichment analysis (GSEA) for DNMT3A-MT PTCL-TBX21 cases as compared with WT cases. Pathway diagrams containing differentially expressed genes of interest are displayed within shaded regions. (C, top) Representative images of CD4 and CD8 tumor antigen staining in PTCL-NOS cases. Images are taken at identical high-power magnifications. (C, bottom) Bar graph of the frequency of immunohistochemistry positivity for n = 10 PTCL-TBX21 cases with respect to DNMT3A mutation status. (D) Pooled metagene plot for MeDIP-Seq profiles of DNMT3A-MT PTCL-TBX21 cases as compared with WT cases. Lines represent sample-type average log2 (peaks per bp per gene) for indicated regions, and shading represents standard error among samples. (E) Box plots of the log2 ratio (observed/expected) for 5mC peaks within the indicated genomic regions. (F) Heatmap of concordant differentially expressed and methylated genes. (G) University of California, Santa Cruz (UCSC) genome browser visualization of MeDIP-Seq peaks in DNMT3A-MT samples and WT samples for the listed genes. Gene diagrams represent the position of TSS relative to displayed genomic regions. Histograms display median-centered expression of genes of interest. Sequencing and GEP status are denoted by the in-figure key. TSS, transcriptional start site; TTS, transcriptional termination site; MT, mutant.
DNMT3A-MT PTCL-TBX21 cases are enriched for an activated CD8+ cytotoxic phenotype. (A) Heatmap of differentially expressed genes between DNMT3A-MT and WT PTCL-TBX21 cases. (B) Gene set enrichment analysis (GSEA) for DNMT3A-MT PTCL-TBX21 cases as compared with WT cases. Pathway diagrams containing differentially expressed genes of interest are displayed within shaded regions. (C, top) Representative images of CD4 and CD8 tumor antigen staining in PTCL-NOS cases. Images are taken at identical high-power magnifications. (C, bottom) Bar graph of the frequency of immunohistochemistry positivity for n = 10 PTCL-TBX21 cases with respect to DNMT3A mutation status. (D) Pooled metagene plot for MeDIP-Seq profiles of DNMT3A-MT PTCL-TBX21 cases as compared with WT cases. Lines represent sample-type average log2 (peaks per bp per gene) for indicated regions, and shading represents standard error among samples. (E) Box plots of the log2 ratio (observed/expected) for 5mC peaks within the indicated genomic regions. (F) Heatmap of concordant differentially expressed and methylated genes. (G) University of California, Santa Cruz (UCSC) genome browser visualization of MeDIP-Seq peaks in DNMT3A-MT samples and WT samples for the listed genes. Gene diagrams represent the position of TSS relative to displayed genomic regions. Histograms display median-centered expression of genes of interest. Sequencing and GEP status are denoted by the in-figure key. TSS, transcriptional start site; TTS, transcriptional termination site; MT, mutant.
Thus, to corroborate the cytotoxic immunophenotype, surface-antigen staining (ie, CD8+ and CD4+) was assessed in 22 PTCL-TBX21 cases (19 via immunohistochemistry, 3 via flow cytometry), and cytotoxic maker staining (ie, TIA and GZMB) in 10 PTCL-TBX21 cases (Figure 3C and supplemental Table 8). CD4+ T-cell positivity was observed in 64% (14 of 22), and CD8+ positivity was observed in 32% (7 of 22), with 1 case as double-negative. Fifty-seven percent (n = 4/7) of PTCL-TBX21 cases with CD8+ T-cell immunophenotype were DNMT3A-MT and associated with increased CD8+ T-cell gene signatures (supplemental Figure 2D). Forty-three percent (6/14) of PTCL-TBX21 cases with a CD4+ T-cell immunophenotype were DNMT3A-MT, with these cases showing high expression of key cytotoxic/effector genes (eg, EOMES, GZMA, and CD2) and an increased CD4+ T-cell memory signature (supplemental Figure 2E).
To further explore the relationship between DNMT3A mutations in PTCL-TBX21 and the cytotoxic phenotype, we validated our gene expression findings detailed above in an additional PTCL-TBX21 cohort with RNA-seq data (n = 33) (supplemental Figure 2F-H) and analyzed the αβ cytotoxic-PTCL (CT-PTCL) signature in our earlier PTCL cohort (n = 40) as described previously (supplemental Figure 3A).11,12 Interestingly, of the 7 sequenced cases expressing the CT-PTCL signature in the highest quartile, 5 cases (71%) had DNMT3A mutations (supplemental Figure 3B). As anticipated, CD8+ T-cell signatures showed the highest concordance with both CT-PTCL signature expression (supplemental Figure 3C) and independent association with OS in PTCL-TBX21 (supplemental Figure 3D). Of note, other cell-type signatures, including CD4+ T-cell memory or macrophage, were enriched in cases in the highest quartile of CT-PTCL signature expression but showed no prognostic significance (supplemental Figure 3E). Similar results were observed in the RNA-seq PTCL-TBX21 cohort and combined cohorts (supplemental Figure 3F-G), indicating the association of high expression of CD8+ T-cell signatures with DNMT3A-MT PTCL-TBX21 was robust and capable of prognostic stratification. DNMT3A-MT cases in the AITL and PTCL-GATA3 molecular entities showed similar T-cell activation signatures but not the enhanced cytotoxic phenotype demonstrated in PTCL-TBX21 (supplemental Figure 4A-H).
To understand how the DNMT3A-MT–mediated methylation may impact cytotoxic gene expression in PTCL-TBX21, we performed MeDIP-Seq analysis of cases with DNMT3A mutations (n = 3 DNMT3AR882H and n = 1 DNMT3AQ886Stop) vs DNMT3A-WT (Figure 3D) and integrated the corresponding cohort GEP data to identify differentially methylated regions (DMRs) that were concurrent with changes in gene expression (Figure 3E, supplemental Figure 5A, and supplemental Tables 9-10). We observed that hypomethylated regions associated with increased gene expression in the DNMT3A-MT PTCL-TBX21 samples were enriched for pathways involving TCR signaling (eg, LCK), IFN-γ signaling (eg, CD2 and CD96), and IL-2 signaling (eg, GZMH) (Figure 3E-F). Of note, we identified a hypomethylated DMR for the transcription factor EOMES, which was associated with its increased gene expression in DNMT3A-MT samples (Figure 3E-F). Analysis of hypermethylated DMRs associated with decreased expression of genes within DNMT3A-MT PTCL-TBX21 samples identified enrichment for pathways involving IL-6 signaling (eg, IL6), regulation of apoptosis (eg, PERP), and the actin cytoskeleton (eg, CAV3 and CRP) (Figure 3E-F and supplemental Figure 5B).
As human PTCLs have high heterogeneity, we investigated a murine model wherein homozygous or heterozygous loss of Dnmt3a in the hematopoietic stem cell compartment leads to the development of a CD8+ T-cell lymphoma in a subset of mice (supplemental Figure 6A).53,54 Malignant CD8+ T-cells showed an upregulation of cytotoxic molecules (eg, Gzma and Gzmb) and transcription factors associated with CD8+ T-cell development and effector function (ie, Tbx21 and Eomes) when compared with WT CD8+ T cells (supplemental Figure 6B). GEP analysis identified pathways involving Tbx21-signaling, IFN-γ signaling, and T-cell activation in murine neoplastic CD8+ T cells (supplemental Figure 6C), similar to the findings in human PTCL as shown above. DNA methylation analysis demonstrated that hypomethylated genes were enriched for pathways involving TCR stimulation (eg, Zap70, Lck, and Fyn), costimulation (eg, Cd28), and TH1 responses (eg, Rela, Ifng, Nfkb1, and Prf1) (supplemental Figure 6D) with concurrent hypomethylation observed for the transcription factors Tbx21 and Eomes (supplemental Figure 6D).
Validation of functional impact of DNMT3A-MT proteins in T-cell lines
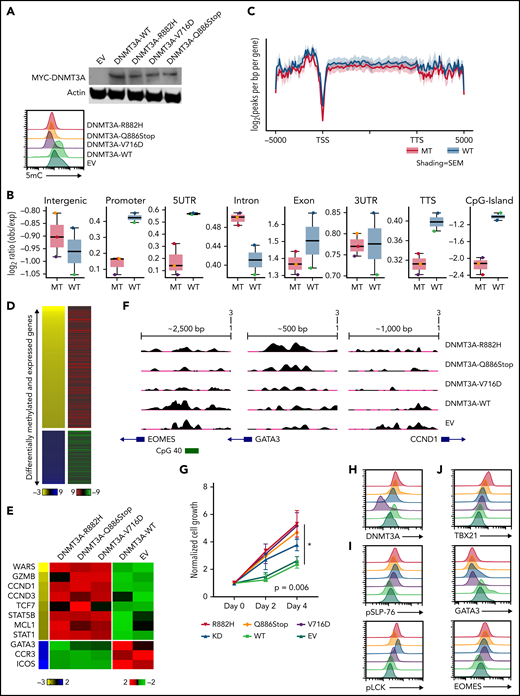
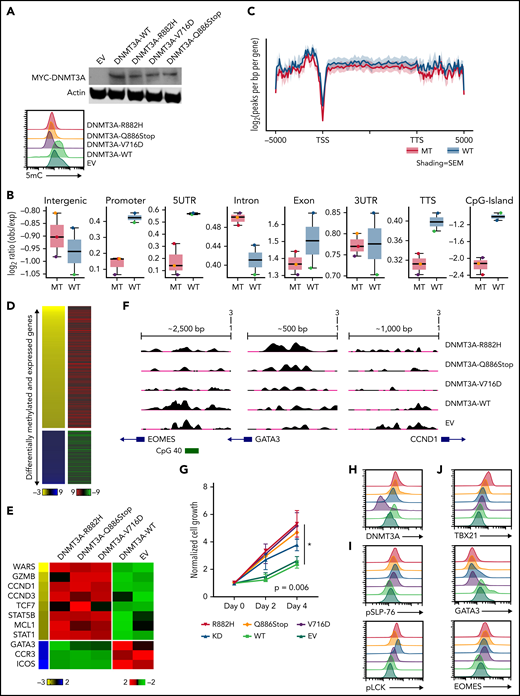
To examine our findings in vitro, we generated several DNMT3A-MT constructs (ie, R882H, V716D, and Q886Stop mutations) and stably expressed them in the CD8+ PTCL cell line T8ML155 (Figure 4A and supplemental Figure 7A). Consistent with previous reports,36,56-59 expressions of DNMT3A-MT proteins led to subtle decreases in global-5mC content compared with vector and expression of exogenous WT DNMT3A protein (Figure 4A-C and supplemental Figure 7A-B). We then generated both MeDIP-Seq and RNA-Seq data sets to perform an integrative analysis (Figure 4B-D and supplemental Tables 11-13). Hypomethylated regions associated with increases in gene expression in the DNMT3A-MT T8ML1 cell lines were enriched for cytotoxic genes (ie, IFN-γ– and NF-κB–annotated genes) and genes involved in T-cell activation while hypomethylated genes showing downregulation were enriched for genes associated with TGFβ and the TH2 pathway (eg, GATA3, CCR3, and ICOS) (Figure 4D-F and supplemental Figure 5B).
Expression of DNMT3A mutations in a cytotoxic CD8+ PTCL cell line. (A, top) Representative Western blot of MYC-tagged DNMT3A. (A, bottom) Representative histogram of 5mC (MFI) in indicated T8ML1 cells. (B) Box plots of the log2 ratio (observed/expected) for 5mC peaks within the indicated genomic regions. (C) Pooled metagene plot for MeDIP-Seq profiles of DNMT3A-MT (R882H, V716D, and Q886Stop) and DNMT3A-WT (WT, EV) cell lines. Lines represent sample-type average log2 (peaks per bp per gene) for indicated regions, and shading represents standard error among samples. (D) Heatmap of concordant differentially expressed and methylated genes. (E) Supervised heatmap of representative differentially expressed and methylated genes. (F) UCSC genome browser visualization of MeDIP-Seq peaks in DNMT3A-MT samples and DNMT3A-WT samples for the listed genes. Gene diagrams represent the position of TSS relative to displayed genomic regions. (G) Normalized cell growth for T8ML1 cells with indicated DNMT3A alterations. Symbols represent mean ± standard error, n = 3 independent experiments. (H-J) Representative histograms of (H) DNMT3A expression, (I) phosphorylation status of LCK (pY505) and SLP-76 (pY128) under normal culture conditions, and (J) expression of T-cell development transcription factors. Representative histograms and blots are taken from n = 3 independent experiments. TSS, transcriptional start site; TTS, transcriptional termination site; MT, mutant; EV, empty vector.
Expression of DNMT3A mutations in a cytotoxic CD8+ PTCL cell line. (A, top) Representative Western blot of MYC-tagged DNMT3A. (A, bottom) Representative histogram of 5mC (MFI) in indicated T8ML1 cells. (B) Box plots of the log2 ratio (observed/expected) for 5mC peaks within the indicated genomic regions. (C) Pooled metagene plot for MeDIP-Seq profiles of DNMT3A-MT (R882H, V716D, and Q886Stop) and DNMT3A-WT (WT, EV) cell lines. Lines represent sample-type average log2 (peaks per bp per gene) for indicated regions, and shading represents standard error among samples. (D) Heatmap of concordant differentially expressed and methylated genes. (E) Supervised heatmap of representative differentially expressed and methylated genes. (F) UCSC genome browser visualization of MeDIP-Seq peaks in DNMT3A-MT samples and DNMT3A-WT samples for the listed genes. Gene diagrams represent the position of TSS relative to displayed genomic regions. (G) Normalized cell growth for T8ML1 cells with indicated DNMT3A alterations. Symbols represent mean ± standard error, n = 3 independent experiments. (H-J) Representative histograms of (H) DNMT3A expression, (I) phosphorylation status of LCK (pY505) and SLP-76 (pY128) under normal culture conditions, and (J) expression of T-cell development transcription factors. Representative histograms and blots are taken from n = 3 independent experiments. TSS, transcriptional start site; TTS, transcriptional termination site; MT, mutant; EV, empty vector.
Functional assessment of the identified dysregulated pathways revealed that expression of DNMT3A-MT proteins or knockdown of DNMT3A lead to increased proliferation in T8ML1 cells (Figure 4G-H and supplemental Figure 7C-D), with higher basal phosphorylation of TCR proteins such as LCK and SLP-76 as well as downstream signaling pathways (Figure 4I and supplemental Figure 7E-G). Concurrent with findings described previously, we observed hypomethylation of EOMES at a CpG site within the promoter region that corresponded to increases in protein expression (Figure 4J and supplemental Figure 7H) and concurrent upregulation of its paralogue TBX21 and downregulation of the crossregulated GATA3 (Figure 4G and supplemental Figure 7I-J). For further investigation, we modified CD4+ Jurkat T cells to express DNMT3AR882H using CRISPR/Cas9 methods (supplemental Figure 8A-B). In these cells, we identified concomitant decreases in 5mC levels with increased expression of EOMES without modulation of CD4+/CD8+ coreceptor expression (supplemental Figure 8C-E). Thus, consistent with our observations in human PTCL-TBX21 tumor samples and the murine model of CD8+ PTCL development, we identified hypomethylation in EOMES in DNMT3A-MT cells coupled with the increased protein expression, suggesting that DNMT3A mutation may in part regulate an EOMES-driven cytotoxic transcriptional program in T cells.
In vitro analysis of DNMT3AR882H mutation in primary CD3+ T cells demonstrates skewed cell culture advantage to CD8+ T cells
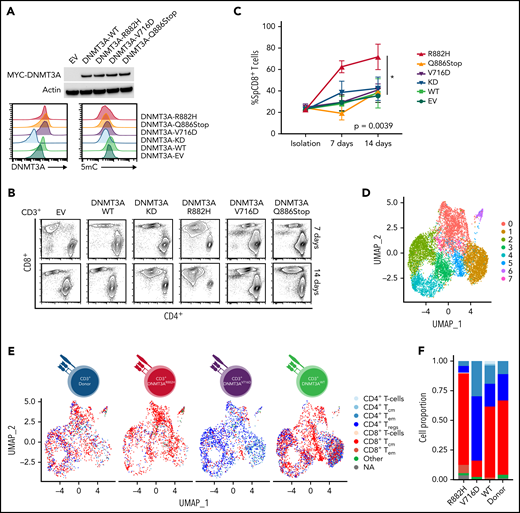
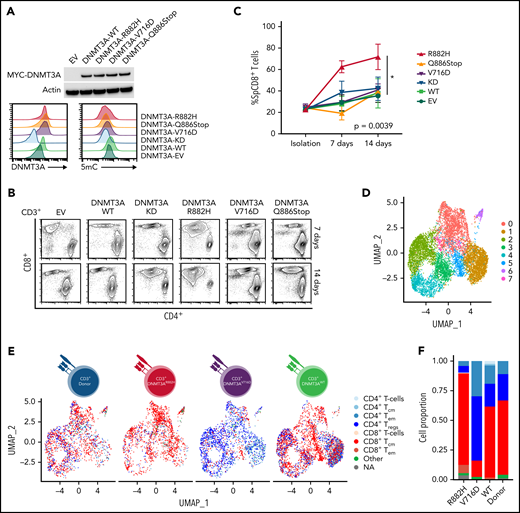
To understand how DNMT3A-MT–induced signaling changes will alter primary T cells in vitro, we stably transduced CD3+ T-cell cultures (Figure 5A and supplemental Figure 9A-B) and observed an increased outgrowth of CD8+ T cells in DNMT3AR882H CD3+ T cells compared with other DNMT3A mutants (ie, DNMT3AV716D and DNMT3AQ886Stop), WT, knockdown, and empty vector over a 14-day culture period (P < .05) (Figure 5B-C). To further interrogate these changes, we used single-cell RNA-sequencing (ScRNA-seq) on representative CD3+ T-cell cultures (Figure 5D-G and supplemental Figure 9C-I). ScRNA-Seq analysis identified 8 clusters (numbered c0-c7, resolution = 0.4) within the CD3+ T-cell cultures with DNMT3AR882H T cells most prevalent in clusters c0, c5, and c7 (Figure 5D-E, supplemental Figure 9J, and supplemental Tables 14 and 15). These clusters were enriched for genes involving both T-cell activation (eg, FYN and JUN) and components of the cytotoxic signature (eg, CRTAM, CD84, and CTSW) (Figure 5G), with further validation of the master transcription factor EOMES (supplemental Figure 9K-L). For unbiased immunophenotypic analysis, we used SingleR to assign cellular identity by comparison with reference data sets61 (Figure 5E-F). SingleR identified the increased CD8+ T-cell proportion in DNMT3AR882H T cells and annotated these CD8+ T cells as predominantly T-central memory (TCM) with a fraction of effector memory (TEM) cells (Figure 5F). While all analyzed T-cell cultures featured the presence of CD8+ TCM cells, TEM cells were fewer than the DNMT3AR882H T cells (Figure 5F), a finding further validated by flow cytometry in CD8+ T cells using α-CD45RO and α-CCR7 (Figure 5H). Additionally, an expansion of the CD4+ TEM population was noted in DNMT3AV716D T cells in comparison with other samples (Figure 5F).
In vitro and ScRNA-Seq analysis of DNMT3A mutations in primary CD3+ T-cell cultures. (A, top) Representative Western blot of MYC-tagged DNMT3A. (A, bottom) Representative histogram of DNMT3A expression (MFI) and 5mC concentrations (MFI) in CD3+ T-cell cultures. (B) Representative flow cytometry plots for indicated cell types at listed time points. (C) Single-positive CD8+ T-cell percentages in vitro over indicated times in listed cell types (symbols represent mean ± standard error from n = 4 total donors covering n = 3 individual experiments) (D-E) UMAP (uniform manifold approximation and projection) plot of Seurat-identified clusters in CD3+ T-cell cultures. (E) Seurat-identified clusters annotated by SingleR for sample composition and immune cell identity. (F) Bar graph of the proportion of immune cell identities per sample as annotated by SingleR. (G) Violin plots of representative genes enriched in Seurat-identified clusters c0, c5, and c7. (H) Flow cytometry plots for listed cell types identifying CD8+ TCM and TEM cells. The gating strategy is shown graphically. Representative histograms, plots, and blots from (A-B) are taken from n = 3 independent experiments. Plots from H are from single-donor used for ScRNA-seq analysis. EV, empty vector; KD, knockdown; TCM, T-central memory; TEM, T-effector memory; Treg, regulatory T cell.
In vitro and ScRNA-Seq analysis of DNMT3A mutations in primary CD3+ T-cell cultures. (A, top) Representative Western blot of MYC-tagged DNMT3A. (A, bottom) Representative histogram of DNMT3A expression (MFI) and 5mC concentrations (MFI) in CD3+ T-cell cultures. (B) Representative flow cytometry plots for indicated cell types at listed time points. (C) Single-positive CD8+ T-cell percentages in vitro over indicated times in listed cell types (symbols represent mean ± standard error from n = 4 total donors covering n = 3 individual experiments) (D-E) UMAP (uniform manifold approximation and projection) plot of Seurat-identified clusters in CD3+ T-cell cultures. (E) Seurat-identified clusters annotated by SingleR for sample composition and immune cell identity. (F) Bar graph of the proportion of immune cell identities per sample as annotated by SingleR. (G) Violin plots of representative genes enriched in Seurat-identified clusters c0, c5, and c7. (H) Flow cytometry plots for listed cell types identifying CD8+ TCM and TEM cells. The gating strategy is shown graphically. Representative histograms, plots, and blots from (A-B) are taken from n = 3 independent experiments. Plots from H are from single-donor used for ScRNA-seq analysis. EV, empty vector; KD, knockdown; TCM, T-central memory; TEM, T-effector memory; Treg, regulatory T cell.
Discussion
PTCLs represent a challenging disease clinically and scientifically, highlighting the need to further understand PTCL pathobiology and improve dismal clinical outcomes. GEP studies have recognized likely cell-of-origin counterparts within PTCL-NOS corresponding to recognized TH-cell effector subtypes designated as PTCL-TBX21 and PTCL-GATA3.11,12 While recent genomics studies implicated distinct driver mutations/oncogenic pathways in these subtypes,62 the mutation profile is led by epigenetic regulators TET2, a methylcytosine dioxygenase, and DNMT3A, a de novo methyltransferase.15 While the cooccurrence of these mutations in PTCLs is paradoxical, the loss of 5hmC because of TET2 mutation and DNA hypomethylation because of DNMT3A loss in key target genes may act synergistically in lymphomagenesis.63,64 Consistent with earlier studies15,25,27,46 our findings showed DNMT3A mutations in entire functional domains of the protein in AITL, whereas in PTCL-TBX21 and DNMT3A mutations skewed toward the MTase domain and the R882H/C hotspot. In contrast, mutations in the PTCL-GATA3 subtype were observed primarily in the N-terminal and PWWP domains. The distinct prevalence of the DNMT3AR882H/C variant in PTCL-NOS compared with AITL is intriguing. Earlier studies have shown the R882 mutation results in a hypomorphic protein that acts in a dominant–negative manner.59,65,66 The frequent identification of the DNMT3AR882H/C variant in PTCL-PBX21 suggests it may have a unique role in its pathogenesis, signifying that a better understanding of the functional impact of mutant alleles would provide valuable insight into how these T-cell malignancies develop.
In this study, DNMT3A mutation status showed different impacts on prognosis dependent on the molecular PTCL subtypes in patients treated with CHOP-based therapies. In the PTCL-TBX21 subtype, DNMT3A mutations were associated with a significantly worse prognosis, but this association was not seen in AITL or PTCL-GATA3. While reports have identified DNMT3AR882 mutations to be associated with poor responses to therapy in AITL,67 it has not been convincingly demonstrated to be an independent factor. Further, the highly aggressive nature of PTCL-GATA3 makes prognostic stratification of this molecular subtype difficult.15 Analysis of future cohorts with a larger population and more complete clinical information (eg, International Prognostic Index status availability) are needed to validate the current observations.
In our GEP findings, DNMT3A mutations in PTCL-TBX21 were associated with enrichment of T-cell memory signatures and CD8+ T-cell signatures among PTCL-TBX21, and a CD8+/cytotoxic gene expression phenotype is associated with worse OS in PTCL-TBX21. Thus, the poorer prognosis associated with DNMT3A mutations in PTCL-TBX21 seemed to be related to cases exhibiting the cytotoxic phenotype. Clinically, these findings should prompt further investigation into targeted treatment strategies for PTCLs with cytotoxic phenotypes, as current treatment approaches are clearly inadequate. Routine sequencing of PTCLs upon diagnosis in conjunction with clinically applicable gene signature-based molecular tools (eg, for molecular classification) may greatly improve PTCL patient stratification and allow better clinical trials or treatment. For alternative treatments, cytotoxic PTCLs may benefit from therapy strategies mirroring that of NK/T-cell lymphomas,68-70 and while counterintuitive, hypomethylating agents (eg, azacitidine and decitabine) have shown promise in AML patients with DNMT3A mutations.71-73
To understand methylation differences due to DNMT3A mutations, we performed MeDIP-Seq on a small subset of cases and observed that DNMT3AR882/Q886 cases had hypomethylation of genes enriched in pathways associated with T-cell receptor and TH1/CD8+ signaling compared with DNMT3A-WT cases. Similar findings were seen when analyzing murine CD8+ tumors, indicating these pathways may play an important role in DNMT3A-mediated lymphomagenesis and are activated partly through the dysregulation of genes in these pathways. However, while pathway analyses between GEP and MeDIP both implicate TCR signaling and CD8+ T cells, different GEPs were observed in AITL and PTCL-GATA3. These differences suggest DNMT3A mutations may play a role in T-cell activation and differentiation in PTCL, but the resulting effector programs may be dependent on coexisting epigenetics/mutations and the tumor microenvironment and require further studies in different model systems.49,74,75
With both human and murine tumor-sample gene expression and methylation data demonstrating an association of DNMT3A mutations with TCR activation and several T-cell phenotypes, we sought to validate these findings in an in vitro setting. While few model systems exist for T-cell lymphoma, we were able to use the sole CD8+ PTCL cell line, T8ML1,55,76 to experimentally investigate alterations due to DNMT3A. We observed expression of DNMT3A-MT proteins leads to changes in the methylation landscape wherein an accumulation of focal areas of hypomethylation were identified in distinct regulatory regions (eg, promoters, CpG islands) as opposed to genomewide hypomethylation of all CpGs.35,54,56,57,59,60,77 Expression of DNMT3A-MT proteins led to changes in T-cell development transcription factors, in agreement with previously conducted studies outlining a role for DNMT3A as a regulator of TH1/CD8+ signaling responses.78-82 Integrated analysis of GEP and MeDIP data in T8ML1 cells demonstrated an overlap between high expression of T-cell activation and cytotoxic signatures with hypomethylation of overlapping genes; however, an individual gene-level understanding of this relationship remains to be determined.49,74,75
In healthy CD3+ T-cell cultures, we observed an expansion of CD8+ T cells in the DNMT3AR882H-modified cell cultures, a finding not seen in other DNMT3A mutants or control subjects. In the absence of other oncogenic signals (which would be present in a neoplastic cell line system), the hotspot R882 mutation may serve as a more foundational event to initiate T-cell lymphomagenesis and may exert a stronger polarization signal than other DNMT3A mutations examined in this study. ScRNA-Seq analysis of cultures of DNMT3AR882H-modified CD3+ T cells validated the enhanced cytotoxic transcriptional program associated with DNMT3AR882H and provides a rationale for a similar approach in the further investigation of different DNMT3A mutations (eg, mutated residue within the coding region) in primary cell models regarding T-cell differentiation and plasticity. The expanded CD8+ T cells in DNMT3AR882H cells were annotated mostly TCM cells with a cluster of TEM. In contrast, the DNMT3AV716D T cells had a predominant expansion of CD4+ Treg and TEM cells. Thus, 2 of the expanded CD3+ populations in the DNMT3A-MT cultures mirrored the 2 differentially expressed signatures identified in our PTCL-TBX21 cohort (ie, CD8+ T cells and CD4+ T memory cells). DNMT3A has been shown to be a critical regulator of the memory–phenotype in T cells following activation,81 but different mutants could have discrete influences on T-cell differentiation and may thus have unique implications in their differential association with PTCL entities. Additionally, upregulation of EOMES is a consistent observation in our human and murine CD8+Dnmt3a-loss tumors, the DNMT3A-MT T8ML1 and Jurkat cells, and the DNMT3A-MT normal CD3+ T-cell cultures. With EOMES being a master transcription factor for cytotoxic T cells and involved in T-cell memory function,83 this known DNMT3A target84 could play an important role in DNMT3A-MT–associated PTCL and warrants further study into the mechanisms by which EOMES may influence both CD8+ and CD4+ T cells with DNMT3A mutations.
In conclusion, a distinct DNMT3A mutation spectrum is associated with molecular PTCL subtypes, and DNMT3A variants affecting MTase and dimerization domain are enriched in the PTCL-TBX21 subtype, and the R882 variant is particularly correlated with cytotoxic differentiation and inferior clinical outcome. Regions of hypomethylation associated with DNMT3A variants can influence T-cell activation, growth, and differentiation through dysregulated gene expression (eg, EOMES) but the identification and validation of specific critical genes in each of these functional alterations need further investigations.
Acknowledgments
The authors thank the University of Nebraska Medical Center Human Genetics Laboratory at the Munroe-Meyer Institute, the University of Nebraska DNA Sequencing Core, The University of Nebraska Medical Center Flow Cytometry Core, the Genomic Core Facility at City of Hope, SingHealth Tissue Repository, Advanced Molecular Pathology Laboratory at SingHealth, and Duke–National University of Singapore (NUS) Genome Biology Facility. The authors also thank Francoise Berger for the contribution of cases to the International Peripheral T-Cell Lymphoma Consortium.
This work would not be possible without the support provided by the National Institutes of Health (NIH), National Cancer Institute (NCI) grants UH2 CA206127-02 (J.I. and W.C.C.) and P01 CA229100 (L.M.R., J.I., and W.C.C.), the Leukemia and Lymphoma Society (TRP-6129-04 [J.I.]), and NIH NCI Eppley Cancer Center Support grant P30 CA036727 (J.I.), NIH NCI Strategic Partnering to Evaluate Cancer Signatures (SPECS) II 5 UO1 CA157581-01 (W.C.C.), NIH NCI Specialized Programs of Research Excellence 1P50 CA136411-01 01A1 PP-4 (W.C.C.), City of Hope internal funds (W.C.C.), and AIRC 5x1000 grant (n. 21198 [S.P.]). T.A.H. is supported by the University of Nebraska Medical Center NIH training grant (5T32CA009476-23). The University of Nebraska DNA Sequencing Core receives support from the National Institute for General Medical Science (NIGMS) IDeA Networks of Biomedical Research Excellence (P20GM103427-14) and the Centers of Biomedical Research Excellence (1P30GM110768-01) grants, as well as The Fred & Pamela Buffett Cancer Center Support Grant (P30CA036727).
Authorship
Contribution: T.A.H., A.B., W.L., Y.L., W.C.C., and J.I. designed and performed the research; T.A.H., T.B.H., A.B., W.L., Y.L., Q.W., D.J., C.A., and S.S. collected, analyzed/and or interpreted the data; T.C.G., L.S., S.P., A.L.F., A.R., G.O., S.T.L., C.K.O., J.S., E.S.J., G.G.W., L.S., L.M.R., J.V., F.d’A., D.D.W., and W.C.C. provided materials, conducted the pathological review, and/or contributed clinical data; T.A.H, A.B., W.L., and J.I. wrote the manuscript; and all authors edited and approved the manuscript.
Conflict-of-interest disclosure: The authors declare no competing financial interests.
Correspondence: Javeed Iqbal, Department of Pathology and Microbiology, University of Nebraska Medical Center, Omaha, NE 68198-7660; e-mail: jiqbal@unmc.edu; and Wing C. Chan, Department of Pathology, City of Hope National Medical Center, Duarte CA, 91010; e-mail: jochan@coh.org.
The online version of this article contains a data supplement.
The publication costs of this article were defrayed in part by page charge payment. Therefore, and solely to indicate this fact, this article is hereby marked “advertisement” in accordance with 18 USC section 1734.

