Abstract
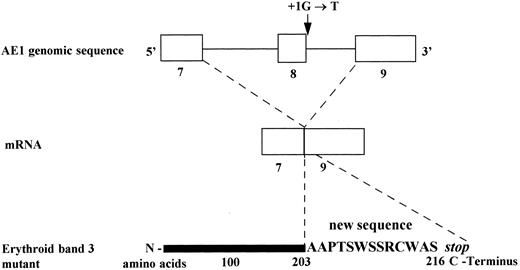
We have studied the molecular defect underlying band 3 deficiency in one family with hereditary spherocytosis using nonradioactive single strand conformation polimorphism of polymerase chain reaction (PCR) amplified genomic DNA of the AE1 gene. By direct sequencing, a single base substitution in the splicing donor site of intron 8 (position + 1G → T) was identified. The study of the cDNA showed a skipping of exon 8. This exon skipping event is responsible for a frameshift leading to a premature stop codon 13 amino acids downstream. The distal urinary acidification test by furosemide was performed to verify the consequences of the band 3 deficiency in α intercalated cortical collecting duct cells (αICCDC). We found an increased basal urinary bicarbonate excretion, associated with an increased basal urinary pH and an efficient distal urinary acidification. We also tested the consequences of band 3 deficiency on the Na+/H+ exchanger, by the measurement of Na+/Li+ countertransport activity in red blood cells. The Na+/Li+ countertransport activity was increased threefold to sixfold in the patients compared with the controls. It is possible that band 3 deficiency in the kidney leads to a decrease in the reabsorption of HCO−3 in αICCDC and anion loss, which might be associated with an increased sodium-lithium countertransport activity.
THE ANION exchanger protein, band 3, is the major integral glycoprotein of the red blood cell, comprising 25% of the total membrane protein, in about 1.2 × 10⁶ copies per cell.1-4 This protein has two structurally and functionally distinct domains and consists of 911 amino acids encoded by the anion exchanger erythroid isoform (AE1 ) gene, which extends over 18 kb and has 20 exons.5
The N-terminal cytosolic domain (residues 1-360) contains the binding sites to cytoskeleton (ankyrin, 4.1, 4.2 proteins), glycolytic enzymes (G3PDH, aldolase and phosphofructokinase), catalase, hemoglobin and hemichromes.3,4,6 This domain has the major phosphorylation site, a tyrosine residue 8,7,8 which might be involved in the activation of erythrocyte glycolysis.9 It also has three sulfhydryl groups that can participate in the formation of the disulfide bond on the band 3 dimer.10 11
The C-terminal membrane domain (residues 361-911) contains between 10 to 14 transmembrane segments that mediate Cl−/HCO−3 exchange.6,12,13 The function of the red blood cell Cl−/HCO−3 exchanger is to facilitate CO2 transport from tissues to alveoli (one third of the total CO2 transport).14 The very high rate of Cl−/HCO−3 exchange across the human red blood cell membrane, which results from the high abundance of band 3, allows anion exchange to be completed in 90% within 0.4 to 0.5 seconds under normal conditions. In addition, Cl−/HCO−3 exchange participates in the regulation of intracellular pH (pHi), cell volume, and intracellular Cl−, and it is also involved in the transcellular transport of acids, bases, and salts across epithelial cells.6
An important mechanism of pHi regulation in mammalian cells is a coupled countertransport of extracellular sodium [Na+]o for intracellular hydrogen [H+]i (Na+/H+ exchange) and a similar anion exchange of Cl− for HCO−3 .13 In addition, other systems are also involved.15
The Na+/Li+ countertransport (sodium/lithium countertransport [SLC]) shares close similarities with the physiologic Na+/H+ exchanger.16 Expression of the sodium/hydrogen exchanger NHE-1 in Xenopus laevis oocytes, enhances sodium/proton exchange activity and establishes Na+/Li+ countertransport suggesting that Na+/H+ exchange and Na+/Li+ countertransport are mediated by the same transport system.17,18 However, this finding does not prove the molecular identity of the two pathways in red blood cells and this issue is still unresolved.19
The presence of AE1 protein in the kidney is well established. The location of AE1 in the basolateral membrane of a subset of cells in the collecting duct system has been showed in the human,20 rat,21 and rabbit22,23 kidney. The human kidney AE1 gene product lacked erythroid exon 1 to 3.5,6,13 Erythroid intron 3 of human gene contains a TATA box (at position 541) downstream of a cluster of transcription factor consensus binding sequences, and it is a potential promoter, which may be consistent with data suggesting that human kidney AE1 protein is an isoform of erythroid AE1 that is truncated at the N-terminus.5
The expression of AE1 in renal α-type intercalated cells of cortical collecting duct (αICCDC) confers to these cells the capacity to reabsorb HCO−3 , participating in the fine regulation of acid/base balance.23
In the last few years, several mutations in the AE1 gene were characterized and associated with hereditary spherocytosis (HS) phenotype, and these mutations are heterogenously distributed on the gene.24-35
In this study, we describe a new splicing mutation on the AE1 gene associated with a cation transport alteration in these erythrocytes, and we suggest a mechanism relating it to the band 3 deficiency in renal cells.
MATERIALS AND METHODS
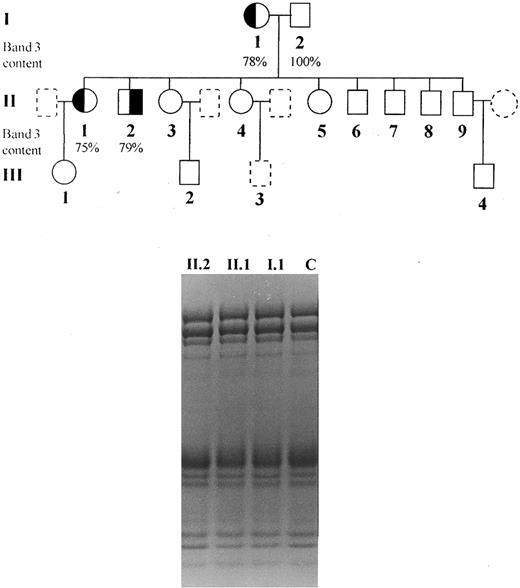
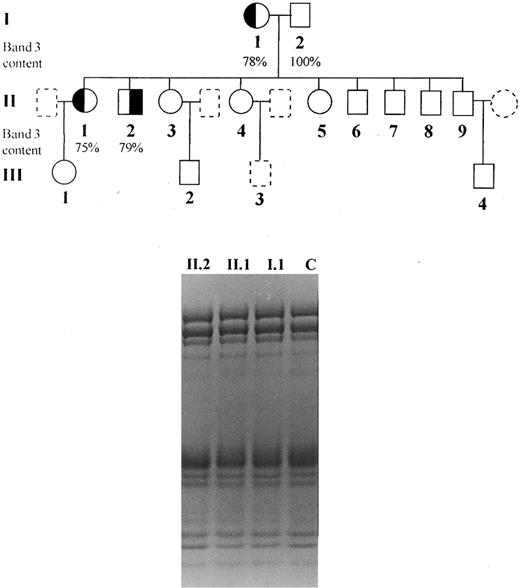
Subjects.The clinical and laboratory characterization of the patients is summarized in Table 1. Informed consent was obtained from all individuals and the study was approved by the Ethical Committee of this hospital. We studied one brother and sister (patients II.1 and II.2) presenting dominant hereditary spherocytosis, inherited from their mother (I.1), characterized by the presence of spherocytes in peripheral blood smear, increased osmotic fragility, mild anemia, splenomegaly, jaundice, and Coombs test negative (Fig 1). Neither were splenectomized. Blood counts were determined on an automated cell counter (Cell-Dyn, Model 1600; Unipath, Mountain View, CA) and arterial blood gases, pH bicarbonate, and base excess was performed using a Stat Profile 5 equipment from Nova Biomedical (Waltham, MA).
Pedigree of the studied family and SDS-PAGE (nonlinear gradient containing 3.5% to 17% of polyacrylamide) stained by Coomassie blue: (◐) (╡) members with spherocytosis; (○) (□) members with normal hemoglobin levels, reticulocyte counts and osmotic fragility; () () members not available for study.
Pedigree of the studied family and SDS-PAGE (nonlinear gradient containing 3.5% to 17% of polyacrylamide) stained by Coomassie blue: (◐) (╡) members with spherocytosis; (○) (□) members with normal hemoglobin levels, reticulocyte counts and osmotic fragility; () () members not available for study.
For the sodium/lithium countertransport, we also studied two other unrelated patients with HS and band 3 deficiency (patients 3 and 4), one patient with HS and ankyrin deficiency (patient 5) and 10 normal controls. Individuals with essential hypertension, overweight, pregnancy, thyroid disease, or using drugs which could affect SLC, were eliminated from this study. In the propositus (II.2), the SLC was determined on two different occasions.
Quantitation of erythrocyte membrane proteins.The quantitation of erythrocyte membrane proteins was described elsewhere.36 Briefly, erythrocyte ghosts were prepared by hypotonic lysis at 4°C of washed red blood cells in 3 mmol/L NaPO4 , pH 8.0, 0.1 mmol/L EDTA, and 0.1 mmol/L phenylmethylsulfonyl fluoride.37 All chemicals were obtained from Sigma Chemical Co (St Louis, MO). Duplicate membrane protein samples were subjected to sodium dodecyl sulfate-polyacrylamide gel electrophoresis (SDS-PAGE) in 3.5% to 17% exponential gradient gels according to Fairbanks et al1 and stained with Coomassie blue. Protein concentration was measured by the Bio-Rad (Richmond, CA) protein assay using bovine serum albumin as standard. The amount of spectrin, ankyrin, 4.1, and 4.2 proteins were expressed as a ratio to band 3 and were quantitated by densitometry of the stained gels at 540 nm (Transmittance/Reflectance Scanning Densitometer, Hoefer Scientific Instruments, Model GS 300, San Francisco, CA). Areas under the peaks were determined by the computer program GS365W, version 3.01 (Hoefer, San Francisco, CA). Results were based on two or more samples from the same patient collected on different occasions.
SSCP analysis of genomic DNA.Each exon was amplified using primers located on intronic boundaries.5 The polymerase chain reaction (PCR)38 conditions were: 200 μmol/L of each deoxynucleotide, 0.5 μmol/L of each primer, 1.5 mmol/L MgCl2 , 20 mmol/L Tris-HCl, pH 8.4, 50 mmol/L KCl, 0.5 to 1.0 μg DNA, Taq DNA Polymerase 2.5 U, in 100 μL final volume, according to PCR protocol guide from GIBCO-BRL (Life Technologies, Grand Island, NY). Single-strand conformation polymorphism39 screening was performed according to Phast-System protocol guide (Pharmacia, Uppsala, Sweden), using of 20% homogeneous polyacrylamide gel. The running conditions were 250 to 300 V/h at 15°C, and the bands were visualized by automated silver staining. A band shift was confirmed repeating the running with another PCR product of the patient and his sister also carrying HS.
Sequencing of genomic DNA.The segment of genomic DNA exhibiting the abnormal single strand conformation polimorphism (SSCP) pattern was PCR amplified using primers (sense 5′GTCACCACCCTCCTTCCCAC3′ and antisense 5′CCTCTCCGGCCCTTCCTTAC 3′) comprising exon 8, intron 8, and exon 9 (469 bp). To study this fragment, sequencing of the double-stranded amplified DNA was performed by the Sanger et al40 method with the Sequenase PCR product kit, version 2.0 (USB, Cleveland, OH) according to the recommendations of the manufacturer, using the primer located at 3′ boundary of intron 7.
Reverse transcriptase (RT)-PCR assay and subcloning of cDNA.The RNA extracted from reticulocytes was reverse transcribed using MMuLV (New England Biolabs, Beverly, MA), according to the manufacturer's protocol. The cDNA was amplified by PCR using a pair of primers corresponding to nucleotides 664-682 (sense), and 1290-1311 (antissense) of cDNA sequence, located on exons 7 and 11, respectively. The PCR product containing two bands was subcloned using the pMOS Blue T-vector kit (Amersham, Buckinghamshire, UK), according to the manufacturer's protocol. The subclones were PCR screened, and the subclones with shorter inserts were directly sequenced using Sequenase PCR product kit, version 2.0 (USB).
Evaluation of cation transport: SLC activity in red blood cells.The SLC was performed using the original method described by Canessa et al.41 In brief, red blood cells were washed with an isotonic solution (280 to 300 mOsm/kg), containing 149 mmol/L choline chloride, 1 mmol/L MgCl2 , 10 mmol/L TRIS-MOPS, 10 mmol/L glucose, pH 7.4 at 4°C. All chemicals used in this method were obtained from Sigma Chemical Co. The red blood cells were then loaded with Li+-load solution: 150 mmol/L lithium chloride, 10 mmol/L glucose, 10 mmol/L TRIS-MOPS, 330 mOsm/kg, pH 7.4 at 37°C for 3 hours, to obtain [Li+]i around 8 mmol/L. The lithium efflux of loaded cells to Na+-rich medium, containing 150 mmol/L sodium chloride, 1 mmol/L MgCl2 , 10 mmol/L TRIS-MOPS, 10 mmol/L glucose, 0.1 mmol/L of ouabain, pH 7.4 at 37°C, 330 mOsm/kg; consists in the sodium/lithium countertransport, which depends on [Na+]16o and passive diffusion. The last can be determinated by measuring the lithium efflux to Na+-free medium (148 mmol/L choline chloride, 1 mmol/L MgCl2 , 10 mmol/L TRIS-MOPS, 10 mmol/L glucose, and 0.1 mmol/L ouabain), pH 7.4 at 37°C, 330 mOsm/kg. The Na+/Li+ countertransport is the result of lithium efflux in sodium-rich medium subtracting the lithium efflux in sodium-free medium. Thus, the loaded cells were washed to remove the extracellular lithium and placed on two groups of tubes: Na+-rich and Na+-free. After 15 and 30 minutes of incubation at 37°C, aliquots (duplicate) were placed in eppendorfs on ice bath to stop the kinetic, and the cells were precipitated by centrifugation at 4°C. The [Li+] was measured on supernatant by inductively coupled plasma-atomic emission spectrometer (ICP 2000; BAIRD Analytical, Bedford, MA) at 670.78 nanometer (nm) wavelength. The presence of hemolysis was verified with the Biureto test, and no protein was detected on supernatant.
Capacity of distal urinary acidification.This study was conducted simultaneously in two patients from one kindred (II.1 and II.2) and in one healthy control under normal sodium diet and using no drugs that affect glomerular filtration rate, natriuresis, and water excretion. Before giving their free consent to participate, all subjects were informed about the nature and purpose of this study.
The studies were performed in the morning after 12 hours of an overnight fast during which water ingestion was allowed. At 8:00 AM, each subject was asked to empty his bladder, and water diuresis was induced by an oral loading equivalent to 10 mL of tap water/kg body weight given between 8:00 and 8:30 AM. The subjects were kept resting comfortably in the sitting position throughout the study and stood only to urinate. The urinary losses were replaced with drinking water every hour.
After 2 hours of steady urine flow, baseline blood and urine collections (under mineral oil) were performed to determine glomerular filtration rate, plasma and urine electrolytes, urine pH, and acid excretion. Then, furosemide (Lasix; Hoechst, Chemistry & Pharmacy, SP, Brazil), a loop diuretic that inhibits the luminal Na+/K+/2Cl− exchanger,42 was given orally at a dose of 40 mg. Furosemide promotes distal acidification, by blocking NaCl reabsorption in thick ascending limb of Henle's loop, increasing Na+ delivery to the collecting tubule and resulting in an enhanced distal Na+ reabsorption that increase the transtubular voltage (lumen-negative).42,43 Urine samples were obtained at hourly intervals during 4 hours, and blood samples were collected every 2 hours. The creatinine clearance was used to estimate the glomerular filtration rate and the urinary acid excretion was calculated as the sum of urinary titratable acid (AT) and ammonium subtracted of urine bicarbonate excretion. The urinary pH was measured right after collecting in a pH-meter (Micronal, SP, Brazil). Creatinine was measured by the alkaline picrate method. Urine was submitted to titrimetric analysis for acidity, and urinary ammonium was evaluated by the method of Connerty et al.44
RESULTS
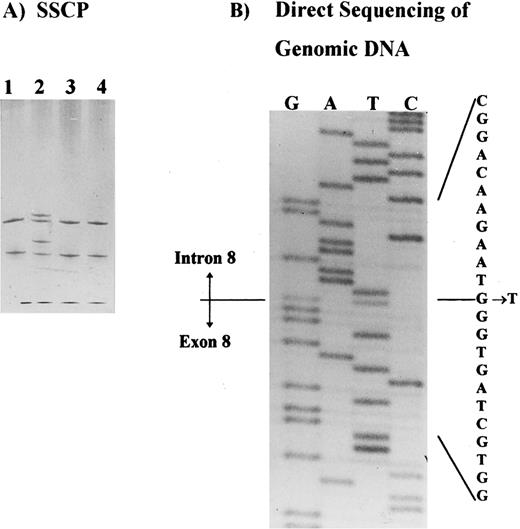
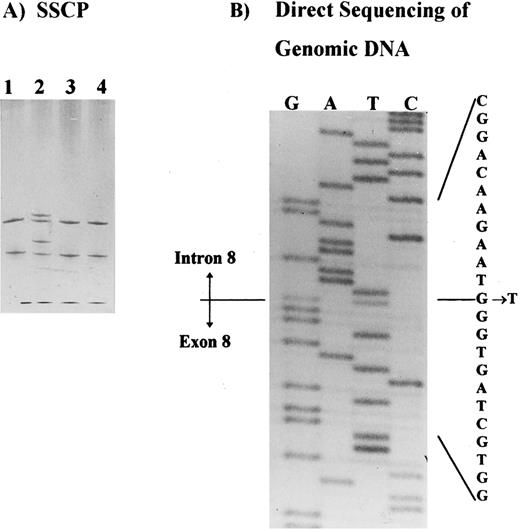
Molecular analysis.SSCP analysis was performed across the entire coding region of the AE1 gene5 and identified a shift in the PCR product containing exon 8, plus intron-exon junctions (Fig 2A). This shift was observed in patients I.1, II.1, and II.2, in at least two independent PCRs, and it was not observed in any control or in the other band 3–deficient patients studied. Direct sequencing of the PCR product identified a single base substitution in the splice donor site of intron 8 (position +1 G → T) in patient II.2. This substitution was also identified in patient II.1 and confirmed in two independent PCRs from both patients (Fig 2B). No other shifts were observed in the SSCP analysis of this family.
Detection of the band 3 gene mutation in HS patients. (A) SSCP analysis of the exon 8 and intron-exon boundaries showing a band shift in a patient with band 3 deficiency (patient II.2, lane 2). Samples applied on lanes 1, 3, and 4 belong to three unrelated patients with band 3 deficiency. (B) Direct sequencing of the PCR product showing a mutation in intron 8, position + 1G → T.
Detection of the band 3 gene mutation in HS patients. (A) SSCP analysis of the exon 8 and intron-exon boundaries showing a band shift in a patient with band 3 deficiency (patient II.2, lane 2). Samples applied on lanes 1, 3, and 4 belong to three unrelated patients with band 3 deficiency. (B) Direct sequencing of the PCR product showing a mutation in intron 8, position + 1G → T.
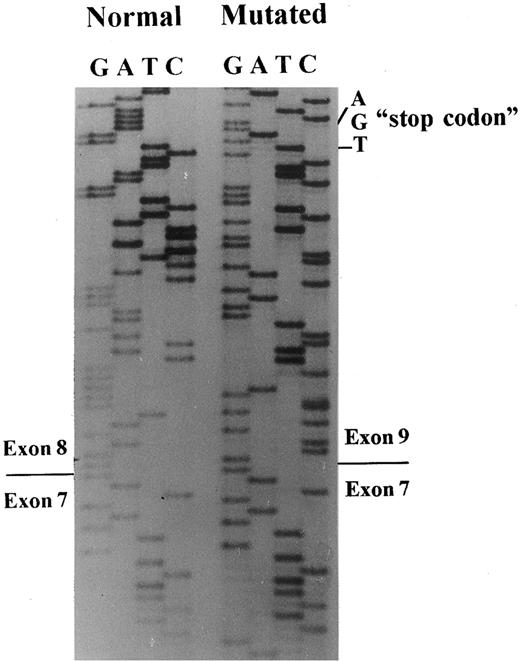
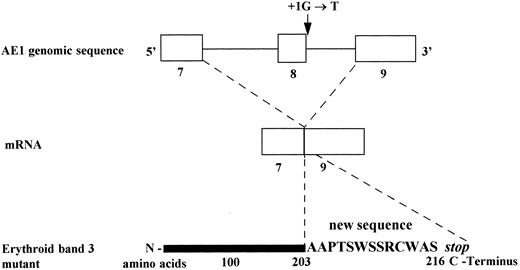
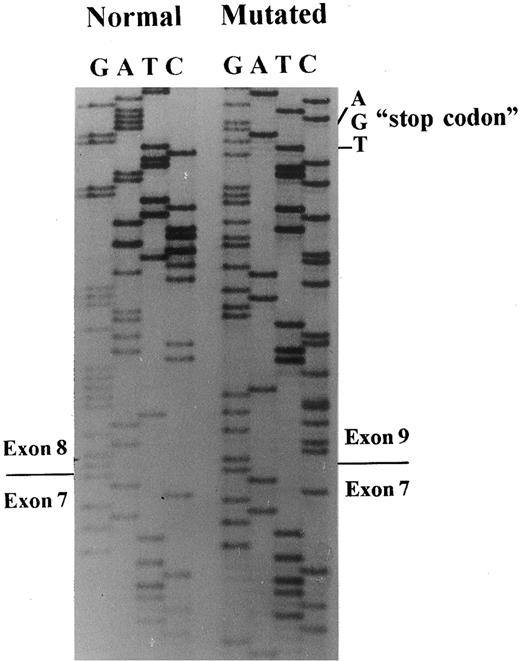
A 649-bp fragment comprising nucleotides 664 to 1311 of cDNA, according to the sequence published by Lux et al,45 was amplified by RT-PCR to examine any abnormal splice event. The PCR product showed two bands: a normal and a very faint shorter band, which were inserted in plasmids for sequencing. A total of 20 clones with the insert were screened by PCR, and five subclones had the abnormal band. The sequencing of these subclones showed the exon 8 skipping, leading to a frameshift and a premature stop codon, 13 amino acids downstream (Figs 3 and 4).
Band 3 cDNA sequencing. Sequencing of subclones containing the normal or the mutated band 3 allele showed skipping of exon 8 in the patient with the mutation in the position + 1G → T of intron 8.
Band 3 cDNA sequencing. Sequencing of subclones containing the normal or the mutated band 3 allele showed skipping of exon 8 in the patient with the mutation in the position + 1G → T of intron 8.
Consequences of the substitution G→T, at position + 1 of the splice donor site of intron 8 on mRNA and predicted erythroid band 3 protein (Band 3 Campinas).
Consequences of the substitution G→T, at position + 1 of the splice donor site of intron 8 on mRNA and predicted erythroid band 3 protein (Band 3 Campinas).
SLC.The SLC activity was increased threefold and sixfold in patients II.1 and II.2, respectively, as well as in the unrelated patient 3 (3.5×), when compared with the control group. The patient with ankyrin deficiency (patient 5) and another with band 3 deficiency (patient 4) presented a normal countertransport activity. In addition, an increased passive lithium efflux was observed in patients II.1, II.2, and 3 in basal conditions (zero-time) and, in all band 3–deficient patients, after 1 hour at 37°C incubation (Na+-free). These results are presented in Table 2.
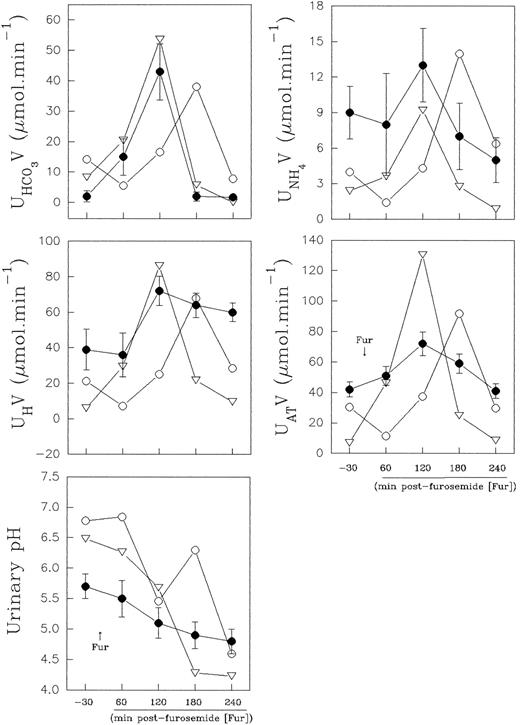
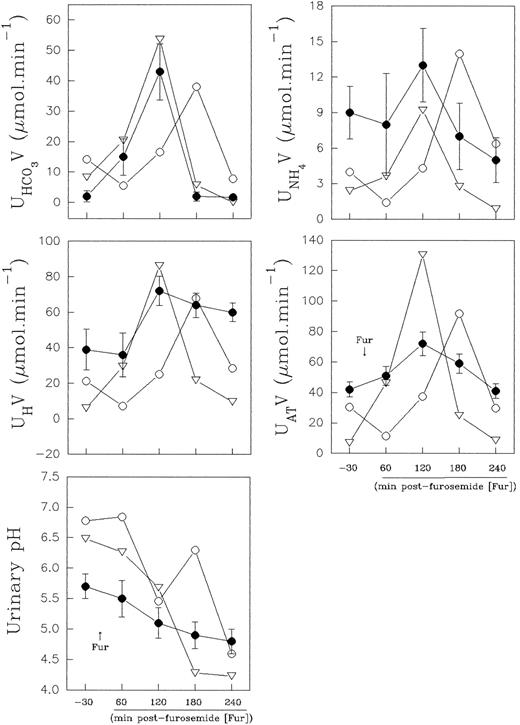
Distal urinary acidification.The urine values observed in the normal control were within the normal range values (expressed as mean ± standard deviation [SD]) obtained from eight healthy volunteers in our laboratory (Fig 5). The results obtained in the normal controls, before and at the second hour after furosemide administration, varied for urine pH, from 5.7 ± 0.2 to 4.8 ± 0.2; AT varied from 42 ± 5 to 72 ± 7.8 μmol min−1; H+ from 39 ± 11.7 to 72 ± 8.3 μmol min−1; NH+4 from 9 ± 2.2 to 13 ± 3.1 μmol min−1, and HCO−3 from 2 ± 1.8 to 42 ± 9.3 μmol min−1.
Effect of furosemide on urinary acidification in eight normal controls (•) and in band 3–deficient patients II.1 (○) and II.2 (▿). Normal control values are presented as mean ± SD.
Effect of furosemide on urinary acidification in eight normal controls (•) and in band 3–deficient patients II.1 (○) and II.2 (▿). Normal control values are presented as mean ± SD.
Nevertheless, in the patients with the band 3 defect, the distal urinary acidification study showed, during the baseline period, a higher urinary bicarbonate excretion (8.3 and 14.2 μmol min−1, respectively), concomitant to a higher urinary pH value (6.48 and 6.78, respectively). These results are presented in Fig 5. These values were out of the confidence intervals of two SD for the control urinary bicarbonate and pH values, and the normal control values did not overlap with the patient values.
Both normal control and patient II.2 presented an increased net acid excretion in the second hour, and it was widely the result of an increase in titratable acid and ammonium excretion. However, the lowest urine pH was achieved at the third hour after diuretic administration, when the urinary bicarbonate excretion was lower. Patient II.1 showed a late increase (shift to right of the time-course curve) in net acid excretion in parallel with an enhanced urinary bicarbonate excretion, and the lowest urine pH (pH 4.6) was achieved at the fourth hour postfurosemide. Thus, the patients II.1 and II.2 acidified the urine efficiently after a provocative test of distal urinary acidification (Fig 5).
Bicarbonate, base excess, pH, pCO2, and pO2 were normal in the arterial blood of patients with Band 3 Campinas.
DISCUSSION
Specific mutations in the band 3 gene (AE1) have been identified in several kindreds with hereditary spherocytosis.24-35 Some of them create a premature stop codon,28,29,34,35 in addition to deletions, insertions, one intron retention on cDNA,29and one duplication of 10 nucleotides.27 According to the results obtained in one of these reports,30 an arginine substitution in the boundaries of the putative transmembrane segments precludes the incorporation of the mutant protein into red blood cell membrane or leads to loss of the mutant protein during the erythroid differentiation. The Band 3 Chur, a recently identified mutation (Gly771 → Asp) in a highly conserved position of transmembrane segment 11, strengthens the view that some amino acids may be crucial for the insertion and/or the stabilization of band 3 within the lipid bilayer.31
In the present study, we describe a splice site mutation in intron 8 (position (1G → T) involving exon 8 skipping. This defect leads to a frameshift and a premature stop codon, 13 amino acids downstream. Thus, the predicted erythrocyte protein comprises only 216 residues. A RT-PCR assay showed a very weak band corresponding to the mutated allele, suggesting a decreased accumulation of the mutated band 3 mRNA and corroborating the results obtained in Band 3 Noirterre.46
Within the consensus splice sequence, the GT at donor site of an intron is invariable and its mutation abolishes the normal splicing.47 In mammalians, it is more common for these mutations to cause exon skipping than intron retention,48 probably because the internal exon is recognized as part of a large intron that should be entirely spliced out.49 It is interesting to note that there are very few studies showing a G → T mutation in the position +1 of an intron causing exon skipping, as reported in the glycoasparaginase,50 glycophorin A,51 C3,52 and α-keto acid decarboxylase53 genes. Regarding the band 3 gene, as far as we know, this is the first report of exon skipping. Thus, Band 3 Campinas is a novel mutation that can contribute to a better understanding of the splicing mechanism.
In addition, the truncation of the band 3 C-terminal probably leads to an absence of this anion exchanger in the membrane of erythrocytes, and in the basolateral membrane of α intercalated cortical collecting duct cell and might be a model to study phenotypic consequences on transport systems in Cl−/HCO−3 exchanger deficient cells.
Alterations on volume regulation and abnormal cation flux have been demonstrated on spherocytes, such increased Na+/K+ pump activity,54 and increased passive permeability to monovalent cations.54-56 On the other hand, band 3 deficiency might induce a defective Cl−/HCO3− exchange57 and consequently, a predisposition to acidosis, which may lead to an activation of protective mechanisms of acid secretion, as the Na+/H+ exchange and the H+/ATPase. Thus, we also tested the consequences of band 3 deficiency on the Na+/H+ exchanger by the measurement of Na+/Li+ countertransport activity.
Several different isoforms of the Na+/H+ exchangers have been identified (NHE1 to NHE4) in a number of mammalians and in different tissues.15,58,59 NHE1, the first isoform cloned,60 appears to exist essentially in the plasma membrane of most cells61 and resides in basolateral membranes of multiple nephron segments,59,61 as well as in the plasma membrane of nonpolarized cells, where it participates in pH regulation.59
Our results showed an increased passive (Na+-independent) lithium efflux in patients with band 3 deficiency. The passive efflux (Na+-free) was about threefold the control values on time “zero” (on ice), and after 1 hour at 37°C, the passive efflux was about sixfold compared with the normal efflux. The overload with lithium was more efficient in spherocytes of patients II.1, II.2, and 3 ([Li+]i ≈ 12 mmol/L), than in the normal erythrocyte ([Li+]i ≈ 8 mmol/L). Our findings confirm that the membrane proteins have an important role in the maintenance of the membrane permeability barrier.56
In our study, we also showed an increased sodium/lithium countertransport activity in the red blood cells of patients II.1, II.2, and 3. However, the increased Na+/Li+ countertransport is not a general characteristic of HS or band 3 deficiency, as it was not observed in patients 4 and 5, presenting band 3 and ankyrin deficiency, respectively.
The hypothesis that this band 3 mutation (band 3Campinas) leads to a disorder in cytoskeleton and consequently an altered cation flux or permeability is attractive, but we do not discard the possibility of the presence of young cells, which have a Na+/H+ exchanger remnant of their precursor stem cells,58 being responsible for the increased Na+/Li+ countertransport. However, in patient 3, the mild increase in reticulocytes is not sufficient to explain the elevated Na+/Li+ countertransport activity observed.
In this study, we observed a higher basal urinary pH in the patients with band 3 deficiency. However, an efficient mechanism of urinary acidification was observed after furosemide administration. According to the results obtained by the distal urinary acidification test, three findings might contribute to elucidate the consequences of band 3 deficiency in α intercalated cortical collecting duct cells.
First, in normal conditions, to maintain acid-base balance, the kidneys must reabsorb all of the filtered bicarbonate and excrete a quantity of acid equal to that produced by metabolic proton generation.62 Thus, the increased basal urinary bicarbonate excretion observed in our patients may be directly related to band 3 deficiency, supporting the function of this protein on tubular reabsorption of bicarbonate in αICCDC23 that escaped from proximal tubule reabsorption (90%) and from thick ascending limb reabsorption (5%),62 participating on the fine adjust of acid-base balance.
Second, the high baseline urine pH in band 3–deficient patients may be the result of the inability of distal nephron segments in handling the bicarbonate delivery from proximal segments. This exceeding distal alkaline urine load could blunt the basal urinary acidification capacity of the nephron.
Third, the striking renal acid excretion observed after furosemide, in band 3–deficient patients, could argue favorably to an increased Na+/H+ antiport and/or H+/ATPase activity in renal tubular cells, preventing the development of metabolic acidosis in our patients. Our results support the findings recently published by Inaba et al57 who described only mild acidosis in cattle with total deficiency of band 3.
Several regulatory mechanisms are involved in the intracellular pH homeostasis. Thus, the expression of Na+/H+ and Cl−/HCO−3 exchangers are increased in acute63 or in chronic acid loading,64,65 to promote adaptation to the increasing acid excretion and bicarbonate reabsorption. The kidneys coordinate the differential expression of specific isoforms of Na+/H+ and anion exchangers throughout distinct nephron segments, according to metabolic status.63-66
On the other hand, another anion exchanger present in many segments of the kidneys, the isoform AE2, is importantly involved in the regulation of anion exchange by pH.67 Recently, a proton-sensitive histidine cluster has been identified in this isoform68 and is highly conserved in nonerythroid anion exchangers AE2 and AE3 from all species, but absent from AE1. This cluster modulates anion exchange activity within the physiologic range of cytoplamic pH.67 68
Supporting our results, efficient urinary acidification was observed in six patients studied by Jarolim et al.69 However, two unrelated patients presented a mild increase in urine pH and two subjects, from one family presenting Band 3 Pribram, were diagnosed as having incomplete distal renal tubular acidosis.69 Thus, it is possible that in heterozygous band 3–deficient patients, a urinary acidification defect might occur only in selected cases. In these cases, both alleles of the band 3 gene could be affected or, a degraded band 3 product could be toxic for the normal metabolism of the cell. However, we cannot exclude, in these cases, a defect in another protein promoting the regulation of intracellular pH.
Finally, Band 3 Campinas is the first description of a G → T mutation in the 5′ splice site of an intron, causing exon skipping and red blood cell membrane disease.
ACKNOWLEDGMENT
We thank Marcelo A. Morgano, from Centro de Quı́mica de Alimentos e Nutrição Aplicada, Instituto de Tecnologia de Alimentos (ITAL), Campinas, SP for technical support on ICP-AES measurements and Dilmara L. Vicentim, for membrane-protein quantitation.
Supported by Conselho Nacional de Desenvolvimento Cientı́fico e Technológico (CNPQ) and Fundação de Amparo à Pesquisa do Estado de São Paulo.
Address reprint requests to Sara T.O. Saad, MD, Hemocentro- UNICAMP, CxPt. 6198; CEP. 13081-970, Campinas-São Paulo, Brazil.

