Monocytes/macrophages serve as sentinels involved in chronic inflammation and the eradication of various pathogens. To define molecularly the differentiation of blood monocytes into macrophages, we conducted serial analysis of gene expression (SAGE) in human blood monocytes/macrophages induced by granulocyte-macrophage colony-stimulating factor (GM-CSF) or M-CSF. SAGE analysis of 57,560, 57,463, and 55,856 tags from monocytes, GM-CSF–, and M-CSF–induced macrophages, respectively, allowed identification of 35,037 different transcripts. Interestingly, the genes with the highest expression during differentiation from monocytes into macrophages were genes involved in lipid metabolism. Both CSF-induced macrophages expressed similar sets of genes except for several genes such as monocyte-derived chemokine (MDC), legumain, prostaglandin D synthetase, and lysosomal sialoglycoprotein. The identification of specific gene expression in human monocytes, GM-CSF–, or M-CSF–induced macrophages provides novel methods to define macrophage subsets and the maturation and activation stage of cells of macrophage lineage and, possibly, to diagnose diseases in which macrophages play a major role. This study represents the first extensive serial analysis of gene expression for any type of human hematopoietic cells.
MONOCYTES AND macrophages originate from multipotent progenitor cells in bone marrow and play a pivotal role in host defense to pathogens, wound healing, angiogenesis, and various types of chronic inflammation, eg, granulomatous reaction, fibrosis, and atherosclerosis. Under normal steady-state conditions, monocytes migrate randomly to various organs and body cavities where they differentiate into macrophages.1-3 During inflammation or a local infection with pathogens, chemotactic cytokines (chemokines), and various peptide and nonpeptide mediators of inflammation are generated locally and stimulate monocytes to migrate into the site where they differentiate into macrophages. Macrophages in various tissues and body cavities vary in their morphology and function and have been given different names, eg, Kupffer cells in the liver, pulmonary and alveolar macrophages in the lung, and microglial cells in the central nervous system. However, the relationship between blood monocytes and various tissue macrophages remains unclear.
Monocytes and macrophages have several characteristics in common such as Fcγ receptors, β2 integrins, phagocytosis of foreign particles, and production of proinflammatory cytokines. However, these cells have never been molecularly defined, and the processes of differentiation and formation of functional subsets of macrophages are not yet understood.
Here we have applied the recently developed serial analysis of gene expression (SAGE) method to allow quantitative analysis of a large number of transcripts in human monocytes and macrophages. SAGE has been shown to provide a means for the quantitative cataloging and comparison of expressed genes in various physiological, developmental, and pathological states.4-7 The SAGE technology is based on the following principles: (1) short sequence tags (9 to 11 bp) are generated from the mRNA population of interest; (2) these tags, derived from a defined location in a transcript, contain sufficient information to positively identify a transcript; (3) many transcript tags can be linked together to form long serial molecules and the multiple tags can be sequenced simultaneously. The expression pattern of any population of transcripts can be quantitatively evaluated by determining the abundance of individual tags and identifying the gene corresponding to each tag.
SAGE libraries were generated from highly purified human blood monocytes, monocyte-derived macrophages differentiated by granulocyte-macrophage colony-stimulating factor (GM-CSF) and monocyte-derived macrophages differentiated by M-CSF. It has been well established that GM-CSF and M-CSF independently induce the proliferation and differentiation of monocytes into distinct subsets of macrophages with different morphology and function,8-11providing a model of macrophage heterogeneity in different tissue microenvironments.
MATERIALS AND METHODS
Preparation of cells.
Peripheral blood mononuclear cells (PBMC) were isolated from venous blood drawn from normal healthy volunteers in Tokyo Metropolitan Red Cross Blood Center. Briefly, PBMC were isolated by centrifugation on a Ficoll-Metrizoate density gradient (density [d] 1.077, Lymphoprep; Nycomed, Oslo, Norway) and suspended in RPMI 1640 medium containing 7.5% FCS (heat-inactivated fetal calf serum; GIBCO, Gaithersburg, MD), 100 μg/mL streptomycin, and 100 U/mL penicillin. This medium contained less than 3 pg of lipopolysaccharide (LPS) per mL as assessed by a Limulus amebocyte lysate test. PBMC were incubated with anti-CD14 monoclonal antibody (MoAb) coated with microbeads, and monocytes were isolated by passing the PBMC through a magnetic cell separation system (MACS; Miltenyi Biotec, Bergish Gladbach, Germany) with a type VR column. These cell suspensions were then aliquoted into plastic tissue culture plates and incubated for 30 minutes at 37°C, 5% CO2 to obtain the highly purified cells. More than 99% of the cells were judged to be monocytes by morphology, positive staining for CD14 (LeuM3; Becton Dickinson, San Jose, CA) in a flow cytometric analysis and nonspecific esterase staining.
SAGE protocol.
mRNAs of monocytes and macrophages were purified from a mixture of total RNA from at least six donors. Monocytes were incubated with M-CSF (100 ng/mL; Morinaga Milk Industry Co, Ltd, Tokyo, Japan) or GM-CSF (500 U/mL; Kirin Brewery Co, Ltd, Tokyo, Japan) in RPMI 1640 containing 7.5% FCS in 5% CO2 at 37°C for 7 days. Total RNA from these cells was isolated by direct lysis in RNAzol B (TEL-TEST, Inc, Friendswood, TX). Poly(A)+ RNA were isolated using the FastTrac mRNA purification kit (Invitrogen, San Diego, CA) according to the manufacturer’s instructions. A schematic diagram of the SAGE technique4-7 (by Vogelstein et al) is accessible on SAGE Home Page via the Internet (http://www.sagenet.org/). SAGE libraries were generated using 2.5 μg poly(A)+ RNA and were converted to cDNA with a BRL synthesis kit (GIBCO-BRL, Gaithersburg, MD) following the manufacturer’s protocol, with the inclusion of primer biotin-5′-T18-3′. The cDNA was cleaved with the restriction enzyme NlaIII, and the 3′-terminal cDNA fragments were bound to streptavidin-coated magnetic beads (Dynal, Oslo, Norway). After capture of 3′ cDNA fragments, the bound cDNA was divided into two pools, and one of the following linkers containing recognition sites for BsmF1 was ligated to each pool: linker 1, 5′-TTTGGATTTGCTGGTGCAGTACAACTAGGCTTAATAGGGACATG-3′, 5′-TCCCTATTAAGCCTAGTTGTACTGCACCAGCAAATCC[Amino mod. C7]-3′, linker 2, 5′-TTTCTGCTCGAATTCAAGCTTCTAACGATGTACGGGGACATG-3′, 5′-TCCCCGTACATCGTTAGAAGCTTGAATTCGAGCAG[amino mod. C7]. BecauseBsmF1 cleaves 14 bp away from its recognition site and theNlaIII site overlaps the BsmF1 site by 1 bp, a 15-bp SAGE tag was released with BsmF1. SAGE tag overhangs were filled in with Klenow, and tags from the two pools were combined and ligated to each other. The ligation product was diluted and then amplified with polymerase chain reaction (PCR) for 26 cycles with 5′-GGATTTGCTGGTGCAGTACA-3′ and 5′-CTGCTCGAATTCAAGCTTCT-3′ as primers. The PCR product was analyzed by polyacrylamide gel electrophoresis (PAGE), and the PCR product containing two tags ligated tail to tail (ditag) was excised. The PCR product was then cleaved with NlaIII, and the band containing the ditags was excised and self-ligated. After ligation, the concatenated products were separated by PAGE and products between 400 bp and 900 bp were excised. These products were cloned into theSphI site of pZero-1 (Invitrogen). Colonies were screened for inserts by PCR, with M13 forward and M13 reverse sequences located outside the cloning site as primers. PCR products containing inserts of greater than 400 bp were sequenced with the TaqFS Dyeterminater kit and analyzed using a 96 lanes-377 ABI automated sequencer (Perkin-Elmer, Branchburg, NJ).
SAGE was performed on mRNA from human monocytes, GM-CSF–, and M-CSF–induced macrophages. Sequence files were analyzed by means of the SAGE program group and DNAsis softwear (Takara, Osaka, Japan). After correcting for sequencing mistakes, a total of 170,879 tags representing 57,560, 57,463, and 55,856 from human monocytes, GM-CSF–, and M-CSF–induced macrophages, respectively, were analyzed.
Reverse transcriptase (RT)-PCR.
Total RNA (200 ng) was prepared by use of RNAzol B. The RNA was reverse-transcribed in 50 μL of 10 mmol/L Tris-HCl (pH 8.3), 6.5 mmol/L MgCl2, 50 mmol/L KCl, 10 mmol/L dithiothreitol, 1 mmol/L of each dNTP, 2 μmol/L random hexamer, and 2.4 U/μL of Moloney murine leukemia virus reverse transcriptase for 1 hour at 42°C. Complementary DNA (cDNA), corresponding to 40 ng of total RNA, was boiled for 3 minutes and quenched on ice before amplification by PCR. The conditions for PCR were as follows: in a 50-μL reaction, 15 μmol/L of each primer, 125 μmol/L each of deoxyguanosine triphosphate (dGTP), deoxyadenosine triphosphate (dATP), deoxycytidine triphosphate (dCTP), and deoxythymidine triphosphate (dTTP) (Toyobo, Osaka, Japan), 50 mmol/L KCl, 10 mmol/L Tris-HCl, pH 8.3, 1.5 mmol/L MgCl2, and AmplyTaq (Perkin-Elmer). Primers used were as follows. Legumain: sense 5′-CAGTGATCGTGGCAGGTTCA-3′, antisense 5′-TTGCCGGATCCTATACCCTTC-3′, GOS2: sense 5′-AAGATGGTGAAGCTGTACGTGC-3′, antisense 5′-TGGATGCTTGTGGTAGGTCAGT-3′, Thymosin beta 10: sense 5′-TGGCAGACAAACCAGACATGG-3′, antisense 5′-ATTTGGCAGTCCGATTGGG-3′, GA733-1: sense 5′-AACAACAGGAAACCTGACTGGG-3′, antisense 5′-CAGTAAGGGCAAGCTGAGGAAT-3′, MDC: sense 5′-ACCGGATCAGTTCAGAAACCA-3′, antisense 5′-ACTTCTTTGCCGTCCCCTTT-3′. Reaction mixtures were incubated in a Perkin-Elmer DNA Thermal cycler for 30 cycles (denaturation for 60 seconds at 94°C, annealing for 60 seconds at 58°C, extension for 120 seconds at 72°C).
Statistical analysis.
Statistical significance between samples was calculated as described previously.12
RESULTS
The morphology of freshly isolated GM-CSF– and M-CSF–induced macrophages.
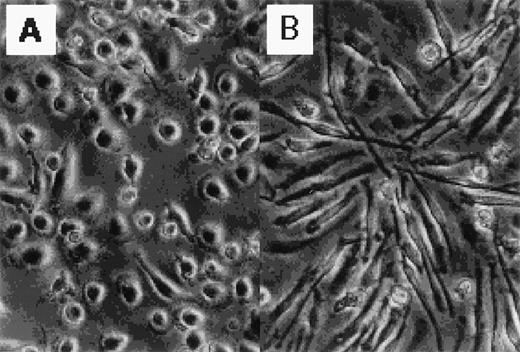
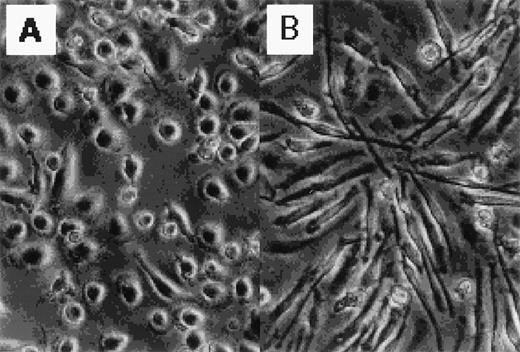
Figure 1 shows the morphology of GM-CSF– and M-CSF–induced macrophages. GM-CSF–induced macrophages were round, whereas M-CSF–induced macrophages were spindle-like. The distinct morphology of these cells has been described elsewhere.13 14
Photographs of normal human blood monocytes, GM-CSF– and M-CSF–induced macrophages. Monocytes were cultured in RPMI 1640 medium plus 7.5% FCS in the presence of (A) rhGM-CSF (500 U/mL) or (B) rhM-CSF (100 ng/mL) for 7 days.
Photographs of normal human blood monocytes, GM-CSF– and M-CSF–induced macrophages. Monocytes were cultured in RPMI 1640 medium plus 7.5% FCS in the presence of (A) rhGM-CSF (500 U/mL) or (B) rhM-CSF (100 ng/mL) for 7 days.
SAGE tag abundance expression in monocytes, GM-CSF–, and M-CSF–induced macrophages.
A total of 170,879 tags, including 57,560, 57,463, and 55,856 tags from monocytes, GM-CSF–, and M-CSF–induced macrophages, respectively, allowed identification of 35,037 different transcripts. Tables 1 and 2show the top 30 transcripts in monocytes, GM-CSF–, and M-CSF–induced macrophages. The most expressed genes in human monocytes were identified as MRP-14, with expression frequency of 1.87%, followed by ferritin H-chain and elongation factor α subunit (Table1). In contrast, the most expressed genes in GM-CSF– and M-CSF–induced macrophages were identified as ferritin L-chain (abundance, 2.69%) and apolipoprotein C-1 (2.21%), respectively. High expression of many genes encoding cytoskeleton proteins, lipid metabolism-related proteins, mitochondrial proteins, proteases, and iron regulation proteins was observed (Table 2).
Comparison of expression patterns in monocytes, GM-CSF– and M-CSF–induced macrophages.
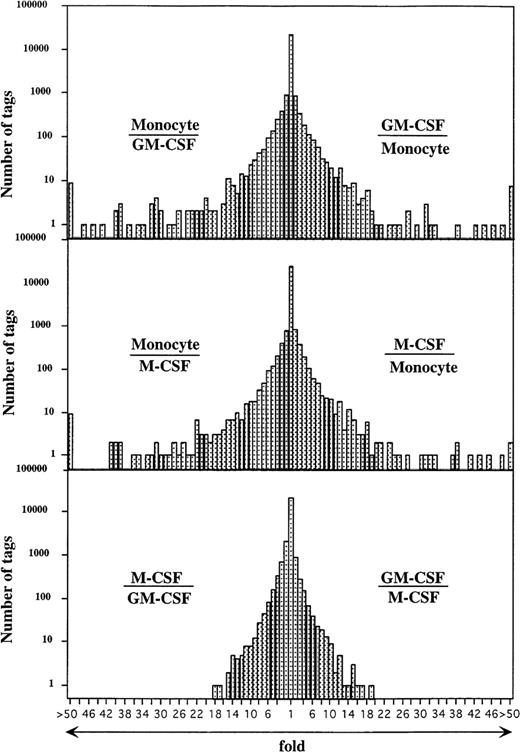
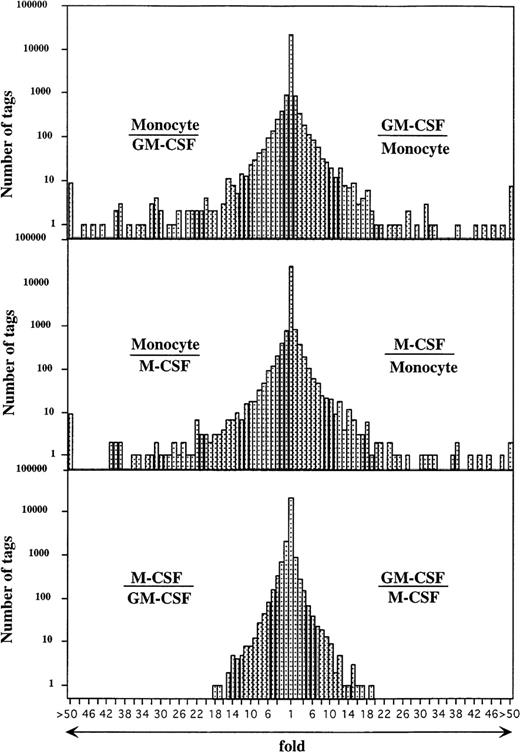
Comparison of the expressed genes among monocytes, GM-CSF–, and M-CSF–induced macrophages showed that the expression levels of most of the transcripts (more than 20,000 transcripts) in these cells were similar (Fig 2). However, the expression profiles also showed 354 and 314 transcripts of GM-CSF– and M-CSF–induced macrophages, respectively, which were different from those of monocytes (P < .01). Expression levels of 201 of 354 and 157 of 314 genes were decreased in GM-CSF– and M-CSF–induced macrophages as compared with those in monocytes. Conversely, 153 and 157 transcripts were expressed at higher levels in the GM-CSF– and M-CSF–induced macrophages, respectively, than in monocytes.
Comparison of gene expression frequency in monocytes, GM-CSF–, or M-CSF–induced macrophages. A semilogarithmic plot shows 116 and 73 tags that were decreased more than 10 times in GM-CSF– or M-CSF–induced macrophages, respectively, compared with monocytes, whereas 118 and 137 tags increased more than 10 times in GM-CSF– or M-CSF–induced macrophages, respectively, compared with monocytes. Moreover, 21 tags increased more than 10 times in GM-CSF–induced macrophages compared with M-CSF–induced macrophages; 34 tags increased more than 10 times in M-CSF–induced macrophages compared with GM-CSF–induced macrophages; 57,560, 57,463, and 55,856 tags derived from monocytes, GM-CSF–, or M-CSF–induced macrophages, respectively, were used for this analysis. The relative expression of each transcript was determined by dividing the number of tags observed in monocytes or both macrophages, as indicated. To avoid division by 0, we used a tag value of 1 for any tag that was not detectable in one sample. These ratios are plotted on the abscissa. The number of genes comprising each ratio is plotted on the ordinate.
Comparison of gene expression frequency in monocytes, GM-CSF–, or M-CSF–induced macrophages. A semilogarithmic plot shows 116 and 73 tags that were decreased more than 10 times in GM-CSF– or M-CSF–induced macrophages, respectively, compared with monocytes, whereas 118 and 137 tags increased more than 10 times in GM-CSF– or M-CSF–induced macrophages, respectively, compared with monocytes. Moreover, 21 tags increased more than 10 times in GM-CSF–induced macrophages compared with M-CSF–induced macrophages; 34 tags increased more than 10 times in M-CSF–induced macrophages compared with GM-CSF–induced macrophages; 57,560, 57,463, and 55,856 tags derived from monocytes, GM-CSF–, or M-CSF–induced macrophages, respectively, were used for this analysis. The relative expression of each transcript was determined by dividing the number of tags observed in monocytes or both macrophages, as indicated. To avoid division by 0, we used a tag value of 1 for any tag that was not detectable in one sample. These ratios are plotted on the abscissa. The number of genes comprising each ratio is plotted on the ordinate.
Genes expressed in GM-CSF– versus M-CSF–induced macrophages were more similar to each other than they were to genes expressed in monocytes. The 117 transcribed genes of GM-CSF– and M-CSF–induced macrophages were expressed at significantly different levels (P < .01). Of the 117 transcribed genes, 57 were expressed at an increased level in GM-CSF–induced macrophages compared with M-CSF–induced macrophages, and 60 of the 117 transcribed genes were expressed at a higher level in M-CSF–induced macrophages compared with GM-CSF–induced macrophages.
Next, differently expressed genes were searched through the GenBank data base to identify the individual genes. Table 3 shows the top 30 increased transcripts in GM-CSF–induced macrophages. Most of the increased transcripts in GM-CSF–induced macrophages were identical to those in M-CSF–induced macrophages. For example, tag frequency of hc-gp39 was 0 in monocytes, whereas it increased to 288 and 182 in GM-CSF–induced macrophages and M-CSF–induced macrophages, respectively. Gene expression of apolipoprotein C-1 in monocytes also increased from 6 to 1,515 and 1,261 in GM-CSF– and M-CSF–induced macrophages, respectively. Increase of the expression of several genes identified here, such as hc-gp39, osteopontin,15gelsolin,16 apolipoprotein E,17CD9,18 chitotriosidase,19 and cellular retinoic acid binding protein20 have been reported previously.
Table 4 shows the top 30 transcripts decreased in GM-CSF–induced macrophages compared with monocytes. The decreased transcripts in GM-CSF–induced macrophages also showed a similar tendency in M-CSF–induced macrophages. The decrease in expression of MRP-8, MRP-14,21 and ficolin22genes has been described. The greatest decrease in mRNAs was identified for complement proteins; ficolin and properdin, DNA-binding protein; GOS3, GOS2, tristetraprolin,23 and core promoter element binding protein (CPBP). Furthermore, we investigated the difference in gene expression between GM-CSF– and M-CSF–induced macrophages (Table 5). Highly expressed genes in GM-CSF–induced macrophages, MDC, GA733-1, and osteonectin were not expressed in M-CSF–induced macrophages. On the other hand, M-CSF–induced macrophages expressed legumain, an asparaginyl endopeptidase,24 lysosomal sialoglycoprotein at a high level compared with GM-CSF–induced macrophages.
RT-PCR of genes represented in the SAGE analysis.
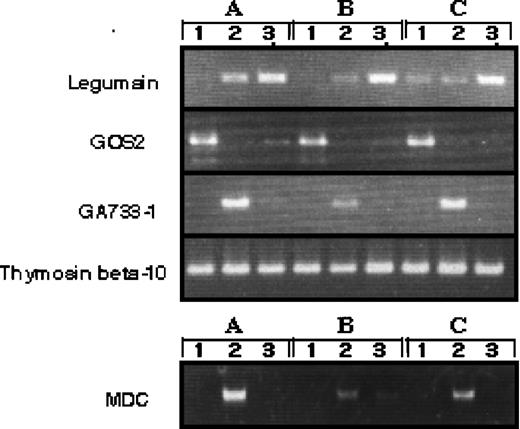
Although we obtained blood from a minimum of six healthy volunteers to find the average in gene expression, there could be differences in the gene expression between individual donor-derived cells. To address this question, we arbitrarily selected four differently expressed genes and evaluated them in three donor-derived samples by RT-PCR (Fig 3). The expression of each transcript was compared with SAGE data. GOS2 was highly expressed in monocytes; monocytes 42: GM-Mφ (GM-CSF–induced macrophages) 0: M-Mφ (M-CSF–induced macrophages) 2, MDC was highly expressed in GM-Mφ; monocytes 0: GM-Mφ 117: M-Mφ 8, GA733-1 was highly expressed in GM-Mφ; monocytes 0: GM-Mφ 15: M-Mφ 0, thymosin beta 10 was expressed in all cell types; monocytes 214: GM-Mφ 246: M-Mφ 266, legumain was highly expressed in M-Mφ; monocytes 0: GM-Mφ 2: M-Mφ 34. These results confirm our SAGE data for monocytes, GM-Mφ, and M-Mφ and establish the general expression profile of the identified genes.
RT-PCR analysis of genes expressed differently in monocytes, M-CSF–, and GM-CSF–induced macrophages. RT-PCR was performed on total RNA isolated from 1, human monocytes; 2, GM-CSF–induced macrophages; 3, M-CSF–induced macrophages. A, B, and C indicate different donors.
RT-PCR analysis of genes expressed differently in monocytes, M-CSF–, and GM-CSF–induced macrophages. RT-PCR was performed on total RNA isolated from 1, human monocytes; 2, GM-CSF–induced macrophages; 3, M-CSF–induced macrophages. A, B, and C indicate different donors.
DISCUSSION
Heterogeneity within the mononuclear phagocyte system may be due to the microenvironment and local differences in the production of growth factors, such as GM-CSF and M-CSF. It is generally accepted that alveolar macrophages are derived from peripheral blood monocytes, and GM-CSF is a pivotal factor for the development of alveolar macrophages in lung.25 On the other hand, M-CSF also is crucial for some tissue macrophages because M-CSF–deficient mice have diminished or absent tissue macrophages in kidney, spleen, liver, and bone.26 To investigate more precisely the changes in gene expression during differentiation of the monocyte/macrophage lineage, we performed a SAGE in human blood monocytes and macrophages induced by GM-CSF or M-CSF.
A technology that identifies differentially expressed genes can provide an important tool for cell biology. Several methods, such as Northern blotting, RT-PCR, differential display, and subtraction have been useful in such studies. However, these technologies can analyze only limited numbers of genes, and quantitative analysis of the transcription of individual genes is difficult. SAGE allows for both the quantitative and simultaneous analysis of large numbers of transcripts (10,000 to 50,000 expressed genes). Thus, we chose to use SAGE for this purpose. SAGE analysis of 57,560, 57,463, and 55,856 tags from monocytes, GM-CSF–, and M-CSF–induced macrophages, respectively, allowed identification of 35,037 different transcripts. Interestingly, in macrophages, high expression of the genes encoding proteins in lipid metabolism (such as apolipoprotein E, osteopontin, CD9, sterol 27-hydroxylase,27 and lisosomal acid lipase28) were observed. These results suggest that alteration of lipid metabolism system in mononuclear phagocytes is associated with their differentiation, and that these changes may contribute to atherosclerosis.
The difference in gene expression between GM-CSF– and M-CSF–induced macrophages showed that a highly expressed gene in GM-CSF–induced macrophages, MDC, was not expressed in M-CSF–induced macrophages. MDC is a novel chemokine, which selectively attracts CCR4-positive Th2-type lymphocytes.29-31 Therefore, GM-CSF–induced macrophages could have a role in Th2 dominated immune diseases. On the other hand, M-CSF–induced macrophages expressed legumain, an asparaginyl endopeptidase,24 at a high level. However, the significance of selective high expression of legumain in M-CSF–induced macrophages remains to be examined. The hydrolysis of asparaginyl bond is prominent in the processing of lysosomal hydrolases such as cathepsin B, H, and D.32 Moreover, macrophages highly express cathepsin D mRNA (Table 2). Therefore, the high expression of legumain mRNA in M-CSF–induced macrophages may have a functional role in M-CSF–induced macrophages.
In conclusion, identification of the genes selectively expressed in human blood monocytes, GM-CSF–, and M-CSF–induced macrophages should provide useful information in defining the ontogeny, development, and function of cells in the monocyte and macrophage lineage. Furthermore, many of the novel genes identified as selectively expressed in monocytes, GM-CSF–, and M-CSF–induced macrophages should provide important clues to further studies of macrophage biology and, in combination with newly developed DNA microarrayer systems, may eventually be useful for the diagnosis of human diseases or the monitoring of their treatments.
ACKNOWLEDGMENT
We are very grateful to Drs V. Velculescu, L. Zhang, W. Zhou, B. Vogelstein, and K. Kinzler for their help in SAGE analysis and also to Dr C. Vestergaard for reviewing the manuscript.
The publication costs of this article were defrayed in part by page charge payment. This article must therefore be hereby marked “advertisement” in accordance with 18 U.S.C. section 1734 solely to indicate this fact.
REFERENCES
Author notes
Address reprint requests to Kouji Matsushima, MD, PhD, Department of Molecular Preventive Medicine, School of Medicine, University of Tokyo, 7-3-1 Hongo, Bunkyo-ku, Tokyo 113-0033, Japan; e-mail:koujim@m.u-tokyo.ac.jp.

