Abstract
The Ly-6 family includes a number of highly homologous, low molecular weight glycophosphatidylinositol-linked proteins expressed on hematopoietic and lymphoid cells. The best characterized family member is Sca-1 (Ly-6A/E), an antigen commonly used for purification of murine pluripotent hematopoietic cells. We sought to characterize the genomic locus surrounding the Sca-1 gene. We identified several overlapping P1 artificial chromosomes containing theSca-1 gene and mapped one of these to mouse chromosome 15D3.1-3.3, the region previously shown to contain members of the murine Ly-6 gene family. We then mapped this clone and found that the Sca-2 gene lies 35.4 kilobase (kb) downstream ofSca-1 in the opposite transcriptional orientation. This is the first direct demonstration of physical linkage of Ly-6 genes. A novel gene, highly homologous to Sca-1 was identified and localized 13.4 kb downstream of Sca-1. This gene, which we designated Ly-6M, shares several structural features conserved among members of the Ly-6 family. Ly-6M messenger RNA (mRNA) is easily detectable in hematopoietic tissue (bone marrow, spleen, thymus, peritoneal macrophages) as well as kidney and lung. No mRNA expression was detected in heart, stomach, liver, small intestine, brain, or skin. Ly-6M protein is detectable on 10% to 15% of peripheral blood leukocytes, including monocytes and a subpopulation of B220+ cells. Ly-6M is broadly distributed in the bone marrow, with prominent expression on monocytes and myeloid precursors. The identification and characterization of Ly-6M adds a new member to a complex family of homologous, tightly linked genes that have proven extremely useful reagents for defining populations within the hematopoietic system.
The Ly-6 proteins are a group of highly homologous molecules linked to the outer leaflet of cell membranes via a glycophosphatidylinositol (GPI) anchor. The murine Ly-6 family includes several proteins expressed during relatively discrete stages of hematopoietic development, including Ly-6A/E (Sca-1), Sca-2, ThB, Ly-6C, and Ly-6G (Gr-1). Sca-1 has proven to be an especially useful cell surface marker, as essentially all hematopoietic stem cell activity in commonly used mouse strains resides in the Sca-1+ compartment.1 Consequently, selection for Sca-1 expression is a well-established strategy for murine hematopoietic stem cell enrichment.2 3
A variety of potential biologic functions have been proposed for Ly-6 proteins, ranging from signal transduction to intercellular adhesion. In vitro antisense and antibody cross-linking experiments have suggested that Sca-1 is important for T-cell activation.4-6Sca-2 has also been implicated in T-cell costimulation on the basis of in vitro findings.7 These results appear to conflict with the observation that Sca-1 deficient T cells have a modest hyperproliferative response to some mitogenic stimuli,8rather than the predicted hypoproliferative response. Taken together, these data do not support the hypothesis that Sca-1 is a critical participant in T-cell activation. Furthermore, the T-cell costimulation model does not address the role of Ly-6 proteins in non–T-cell compartments. The possibility that these proteins may function as adhesion molecules was suggested by the observation that an anti–Ly-6C antibody induces aggregation of purified CD8+ T cells in vitro and impairs homing of lymphocytes in vivo.9Similarly, transgenic overexpression of Sca-1 induces homotypic aggregation of thymocytes.10 Finally, Sca-1 has been implicated in the regulation of T-cell development, based on the observation that thymocyte maturation is arrested at the double negative (CD4−CD8−) stage in transgenic mice overexpressing Sca-1 under the control of the human CD2 enhancer.11
Ly-6 homologs have been identified in other rodents, as well as diverse species from squid to primates (reviewed in Palfree12). This reinforces the notion that these proteins have important biologic functions. Human Ly-6 homologs have only recently been identified. A human homolog of mThB was identified in a squamous cell carcinoma line by expression cloning.13 Despite high-sequence homology between mThB and its human homolog (E48), it is not clear that they are true orthologs because the human gene is apparently not expressed in lymphocytes.13 The human Sca-2 gene was cloned by several groups recently.14-17 Human Sca-2 is widely expressed and is inducible in NB4 or HL60 cells on exposure to retinoic acid.15 Several other potential human Ly-6 family members have been characterized to a limited extent (eg, GML, Ly-6H),18,19 or exist only in the Genbank EST database. A human Sca-1 ortholog has not yet been identified. The larger Ly-6 superfamily includes proteins such as CD59 and urokinase-type plasminogen activator receptor (uPAR), as well as snake venom α-neurotoxins that contain Ly-6–like domains, but map to nonsyntenic chromosomal locations and diverge structurally from the core Ly-6 family (reviewed in Gumley et al20 and Ploug and Ellis21).
After the initial serologic characterization of several murine Ly-6 proteins, the genes encoding 6 of them were cloned.22-26Chromosomal localization in all cases has mapped the genes to chromosome 15.22,25,26 Southern blot analysis of overlapping cosmids with cross-reactive Ly-6 probes has suggested that a large number of highly homologous genes (or pseudogenes) may be clustered within a 630-kilobase (kb) region.27 We sought to characterize this genomic region in greater detail. We found that within a 40-kb region on chromosome 15D3.1-3.3, the Sca-1 and Sca-2 genes lie in opposite transcriptional orientations and flank a novel Ly-6 family member. This new gene, Ly-6M, is highly homologous toSca-1 and is expressed abundantly in hematopoietic cells.
Materials and methods
P1 artificial chromosome library screening
A murine P1 library (Genome Systems Inc, St Louis, MO) prepared from normal 129/Ola splenocytes was screened by polymerase chain reaction (PCR) using a primer pair that specifically amplifies a 544-base pair (bp) amplicon from intron III of the Sca-1 gene. The primers 5′-CAGATATACAAGGCAGGAGC-3′ (forward) and 5′-GAATCTGCAAGAAATCAGGG-3′ (reverse) were used in a standard PCR for the screen.
Fluorescence in situ hybridization
Full-length P1 clones were biotinylated and hybridized to normal mouse chromosomes derived from spleen cultures.28Conditions for fluorescence in situ hybridization (FISH), digital image acquisition, processing, and analysis were previously described.28 To confirm the identity of chromosomes exhibiting a specific signal, preparations were rehybridized with a mouse chromosome 15-specific digoxigenin-labeled probe (Oncor, Gaithersburg, MD).
P1 mapping
Ten micrograms of P1 DNA was digested with rare cutting restriction endonucleases and the resulting fragments were separated by pulsed field gel electrophoresis. Southern blot analysis was performed under standard conditions using Sca-1, Sca-2, or ThB probes. The Sca-1 probe was generated by PCR amplification of 129/SvJ genomic DNA using the primers 5′-ATCTTTGCTTACCCATCTGC-3′ (forward) and 5′-CCTCTTCACTGTGCTGGCTG-3′ (reverse) spanning exon IV. The Sca-2 probe was generated using the primers 5′-TCTTCCTGCCTGTGCTGTTG-3′ (forward) and 5′-CTGATCGGTACATGAGAAGC-3′ (reverse) flanking intron II. The ThB probe was generated using the primers 5′-TGCTCGTCCTCCTTGTCTTG-3′ (forward) and 5′-CACACGTGACATCGAAGTGC-3′ (reverse) flanking intron II. The identity of all probes was confirmed by subcloning and automated sequencing. Subsequently, all BamHI and EcoRI fragments contained within the P1 clone were subcloned into a plasmid vector and used to create a high-resolution restriction map by sequential Southern blot hybridizations. The map assignments for Sca-1,Sca-2, and a novel Ly-6 gene were confirmed by multiple PCRs using “long and accurate” conditions.29 The primers used were specific for the P1 vector (pAd10SacBII)30 arms (5′-GGCCGCTAATACGACTCACTATAGGGAGAGGATC-3′ and 5′-GATCCTTCTATAGTGTCACCTAAATGTCGA-3′) or for sites within the 3 genes.
Ly-6M cloning
An 11.8-kb EcoRI fragment cross-reactive with a Sca-1 exon IV probe was subcloned from P1 clone 13561. From this plasmid, a 2.3-kbPstI fragment also cross-reactive with the Sca-1 probe was subcloned and sequenced. An additional 2.5 kb of sequence flanking thePstI fragment were determined using the 11.8 EcoRI plasmid as a template. After alignment of this sequence with previously characterized Ly-6 genes, nested primers predicted to lie in the 5′ and 3′ untranslated region of a novel Ly-6gene were designed. The first set is 5′-CTGCAGCCAGGTCTGAGAGG-3′ (forward) and 5′-ACAAGGGTGGGGACCATCAC-3′ (reverse). The nested set is 5′-CAAGGATGGACACTTCTCACGCG-3′ (forward) and 5′-GGTGGGGACCATCACATCAG-3′ (reverse). These primers were used to amplify a full-length complementary DNA (cDNA) clone from a P388D1 (macrophage-like) cDNA library (Clontech, Palo Alto, CA). The sequence of this cDNA clone was used to interrogate the GenBank/EMBL/DDBJ nucleotide database using the NIH BLAST server. Potential regulatory elements in the 5′ flanking sequences of the novel Ly-6 gene were identified using the algorithms athttp://biomas.dcrt.nih.gov.
Accession number
The Ly-6M genomic sequence has been deposited in the GenBank/EMBL/DDBJ nucleotide database under the accession numberAF118557.
Reverse transcriptase-polymerase chain reaction
The organs of healthy, young adult (age 6-10 weeks) wild-type C57BL/6 or 129/SvJ mice were harvested aseptically. Total cellular RNA was prepared, as previously described.31 RNA was also prepared from macrophages harvested from the peritoneal cavities of healthy, young mice 72 hours after instillation of thioglycollate (macrophage RNA kindly provided by Dr Steven Shapiro, Washington University, St Louis, MO). These macrophage preparations are routinely more than 99% pure, as assessed by flow cytometry. Contaminating genomic DNA was removed from 1-μg aliquots of the RNA samples by treatment with 1 unit DNAse (Gibco BRL, Gaithersburg, MD) at 23°C for 15 minutes, followed by inactivation with ethylenediamine tetraacetic acid (EDTA) (2.5 mmol/L Fc) at 65°C for 15 minutes. Half of each sample was used as a template in a random hexamer-primed reverse transcription reaction using 5 units of AMV RT (Promega, Madison, WI) and 20 units RNAsin (Promega) according to the manufacturer's instructions. The resulting cDNA pools were normalized for β-actin content in a control PCR using the primers 5′-GCTGTATTCCCCTCCATCGTG-3′ (forward) and 5′-CACGGTTGGCCTTAGGGTTCAG-3′ (reverse). The cycling conditions for β-actin amplification were initial denaturation at 94°C for 1 minute, then 24 cycles of denaturation at 94° for 30 seconds, annealing at 58° for 30 seconds, extension at 70° for 30 seconds. Aliquots were removed at 5 cycle intervals to ensure that amplification remained in the linear range. Amplification of Ly-6M was performed using nested primers in 2 rounds of PCR using the same conditions described for β-actin. The template was diluted 50-fold between rounds. The primers for the first round of amplification are 5′-CAAGGATGGACACTTCTCACGCG-3′ (forward) and 5′-CAAAGGTAAAAAAGGGTGTTC-3′ (reverse). The nested primers are: 5′-TTGCCCATCAATTACCTGCC-3′ (forward) and 5′-TCATCTTGGTGTT- AGGATCC-3′ (reverse).32P-dATP was included in the PCR cocktail at a final concentration of 10 nCi per sample. The products were resolved on 8% polyacrylamide gels and visualized by autoradiography for 4 hours or quantified by phosphorimaging (Molecular Dynamics, Sunnyvale, CA).
Ly-6M antisera production
The cDNA encoding the predicted mature Ly-6M polypeptide (Leu27 to Asn105) was subcloned into the pTrcHis prokaryotic expression vector (Invitrogen, Carlsbad, CA). Recombinant protein expressed in Escherichia coli was purified on Ni-NTA Agarose (Qiagen, Valencia, CA) and used to immunize rabbits. After 3 boost injections, sera were collected and affinity purified using an immobilized synthetic Ly-6M oligopeptide (CDEIEKKFAADPNTKM) (Sulfolink, Pierce Chemical Co, Rockford, IL).
Ly-6M overexpression
The full-length Ly-6M cDNA was subcloned into the pcDNA3.1+ mammalian expression vector (Invitrogen, Carlsbad, CA) and transfected by electroporation into K562 cells. Stable G418R clones were isolated by limiting dilution. The cDNAs encoding full-length Ly-6A and Ly-6G were obtained by reverse transcriptase-polymerase chain reaction (RT-PCR) amplification from wild-type C57BL/6 bone marrow cells and used to generate stable K562 clones as controls for these experiments. The Ly-6C.2 cDNA (kindly provided by Dr Roger Palfree, McGill University, Montreal, Canada) was also used to generate stable K562 cell lines.
Flow cytometry
K562 cells were stained with affinity-purified anti–Ly-6M antisera or control polyclonal rabbit IgG (Sigma, St Louis, MO) at a concentration of 1.0 μg protein per 5 × 10⁵ cells in FACS buffer (0.2% bovine serum albumin [BSA], 0.01% NaN3 in phosphate-buffered saline [PBS]) with 5% goat serum and 5% horse serum. Ly-6M expression was detected using a fluorescein isothiocyanate (FITC)-conjugated goat antirabbit secondary antibody (Vector Laboratories, Burlingame, CA). For blocking experiments, 5 × 10⁵ cells were incubated on ice for 15 minutes with 1 μg of purified recombinant Ly-6M protein before staining with the primary antibody. GPI anchor analysis was performed by incubating 5 × 10⁵ cells with 1.0 unit recombinant phosphatidyl-specific phospholipase C (PI-PLC) (Oxford GlycoSciences, Wakefield, MA) in serum-free media at 37°C for 30 minutes before staining with the primary antibody. K562 clones were also analyzed using an antibody against mLy-6B (clone SK 38-86 kindly provided by Dr Ulrich Hammerling, Memorial Sloan Kettering Cancer Center, New York, NY), as well as antisera that detect hCD55 and hCD59 (kindly provided by Dr Douglas Lublin, Washington University, St Louis, MO). Bone marrow cells were obtained by flushing the femurs of young (8-10 weeks of age) 129/SvJ or C57BL/6 mice with 1× Hebs buffer. After washing and counting, the unlysed samples were preincubated in FACS buffer with 10% goat serum and 1.0 μg/106 cells Fc block (Pharmingen, San Diego, CA), followed by staining as above with anti–Ly-6M antisera or control IgG and the following directly conjugated lineage markers: B220, Gr-1, CD11b, NK1.1, CD3, CD34, CD44, Ter119 (Pharmingen), or F4/80 (Serotec). In other experiments, bone marrow cells were stained with an FITC-conjugated lineage cocktail (CD3, B220, Gr-1, CD11b), phycoerythrin-conjugated anti–Sca-1 (Pharmingen), and anti–Ly-6M antisera (or control IgG) detected by a biotinylated goat antirabbit antibody (Vector), followed by streptavidin-Cy5 (Dako Corp, Carapinteria, CA). Peripheral blood was harvested by cardiac puncture. Leukocytes were recovered after 1 round of red cell lysis and then stained, as above. Analytical flow cytometry was performed on a FACScan (Becton Dickinson, San Jose, CA). Sterile sorting was performed with an Epics Elite cytometer (Coulter Corp, Miami, FL). Sorted samples were cytospun and examined after May-Grunwald/ Giemsa staining.
Results
Sca-1 and Sca-2 are closely linked on chromosome 15
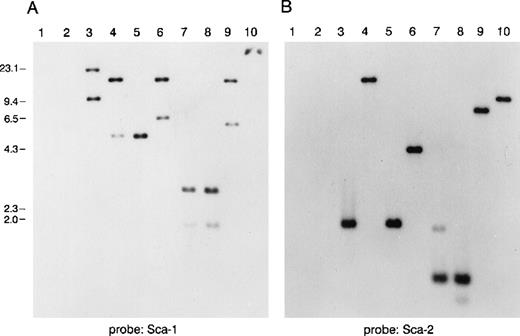
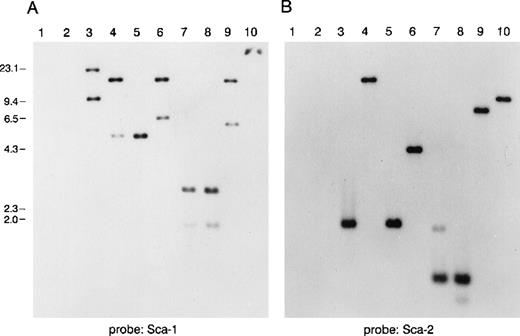
To study the genomic region surrounding the Sca-1 gene, a 129/Ola (H-2b) P1 library was screened using PCR primers specific for the Sca-1 gene. Three P1 clones, averaging 90 kb in size, were obtained. All 3 clones contain the Sca-1 gene, as determined by Southern blot analysis (data not shown). Clone 13561 contains both the Sca-1 and Sca-2 genes, as well as 1 additional band that cross-hybridizes with a Sca-1 cDNA probe (Figure1). This clone was chosen for further analysis. Southern blot analysis with a ThB probe was negative, suggesting that the ThB gene lies outside of the region studied. Probes for Ly-6C, Ly-6F, and Ly-6G were not informative because of numerous cross-hybridizing bands. FISH analysis revealed that clone 13561 localizes to murine chromosome 15D3.1-3.3 (Figure2), the region previously reported to contain several Ly-6 family members. By long-range mapping using pulsed field gel electrophoresis, the distance from the Sca-1 gene to the Sca-2 gene appeared to be 35 to 40 kb (data not shown). Restriction mapping of the entire clone placed the Sca-2 gene just 35.4-kb downstream of the Sca-1 gene (Figure3). Long-range PCR was used to confirm these map assignments and revealed that the Sca-1 andSca-2 genes are in opposite transcriptional orientations.
Southern blot analysis of a murine P1 clone containing several Ly-6 family members.
Lanes 1 and 2 are empty P1 vector DNA digested with BamHI orEcoRI. Lanes 3-10 are P1 clone 13561 DNA digested withBamHI, EcoRI, BamHI, and EcoRI,BglII, PstI, PstI, and EcoRI,HindIII, or XbaI. Fragments were separated on 1% agarose and transferred to nitrocellulose. The blot was hybridized with a probe for (A) mSca-1, then was stripped and rehybridized with a probe for (B) mSca-2. The mSca-1 probe detects 2 homologous DNA sequences, whereas the mSca-2 probe detects a single DNA sequence.
FISH localization of P1 clone 13561.
Mouse chromosome spreads are shown after hybridization with a full-length FITC-detected P1 probe (yellow) and rehybridized with a mouse chromosome 15-specific TRITC-detected painting probe (red). Symmetrical fluorescent signals are located at region 15D3.1-3.3. The majority of 50 metaphases yielded similar results.
Physical map of P1 clone 13561.
The positions of the Sca-1, Sca-2, and Ly-6Mgenes are shown with exons depicted by filled rectangles. The arrows indicate the transcriptional orientation of each gene. BamHI and EcoRI restriction sites are shown below the genes. TheNotI site is present in the P1 polylinker, not in the genomic sequence.
Ly-6M, a novel member of the Ly-6 family, lies between Sca-1 and Sca-2
We reasoned that the 11.8 kb EcoRI P1 fragment noted to cross-react with a Sca-1 exon IV probe (Figure 1) might contain a novelLy-6 gene or pseudogene. We therefore subcloned and partially sequenced this fragment. Sequence alignment revealed that the 11.8-kb genomic fragment contains an open reading frame highly homologous to, but distinct from the Sca-1 gene. Primers predicted to lie in the 5′ and 3′ untranslated region of this candidateLy-6 gene were used to amplify a 550-bp cDNA clone from a P388D1 (murine macrophage-like) cDNA library. There were no discrepancies between the sequence of this cDNA clone and the corresponding genomic sequence obtained from the subcloned P1 fragment, suggesting that the 11.8-kb EcoRI fragment contains a novel, expressed Ly-6 gene. The cDNA sequence was used to define the intron/exon borders of the genomic clone. We designated this new geneLy-6M because we isolated its cDNA from a macrophage library.Ly-6M is located 13.4 kb downstream of Sca-1 (Figure3), roughly equidistant between Sca-1 and Sca-2 in the same transcriptional orientation as Sca-1. The genomic structure of Ly-6M (Figure 4) shows typical Ly-6 features (the first one and a half of 4 exons noncoding, subsequent introns and exons of progressively larger size).
Organization of the Ly-6M gene.
The 4 exons of the Ly-6M gene are shown (untranslated regions are open boxes, translated regions are filled boxes). B = BamHI, Bg = BglII, Ev = EcoRV, H = HindIII.
Organization of the Ly-6M gene.
The 4 exons of the Ly-6M gene are shown (untranslated regions are open boxes, translated regions are filled boxes). B = BamHI, Bg = BglII, Ev = EcoRV, H = HindIII.
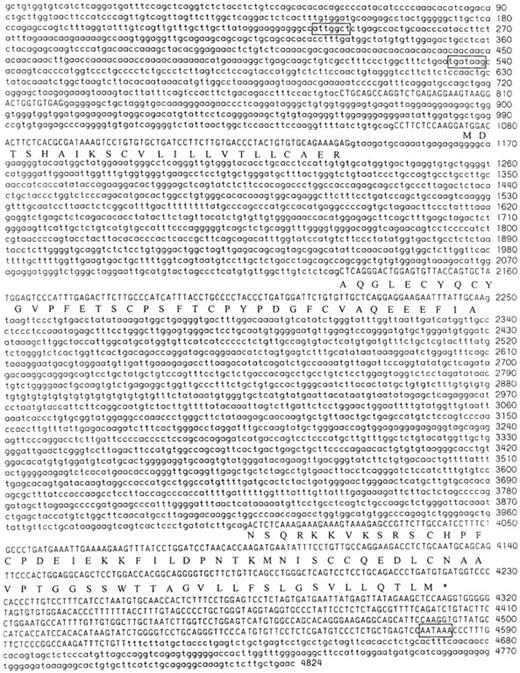
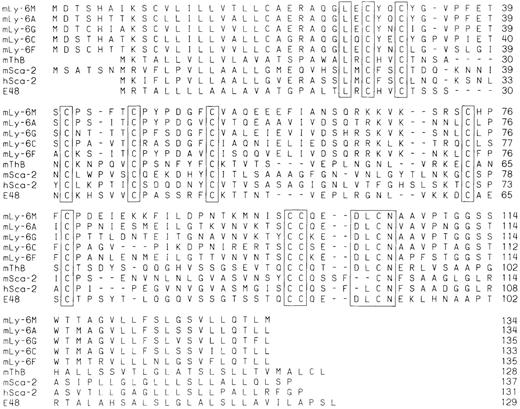
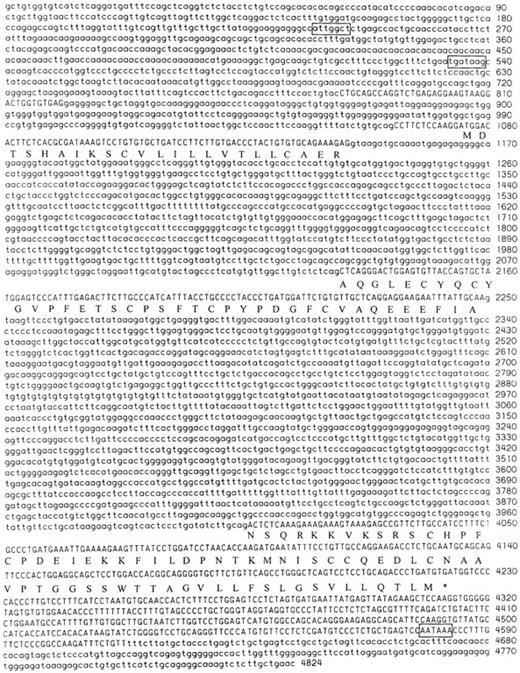
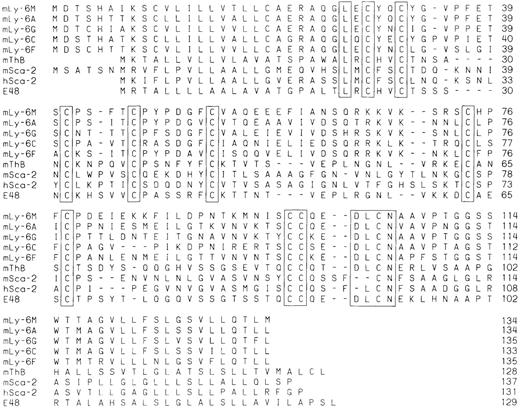
Examination of 782 bp of 5′ flanking sequence of theLy-6M gene revealed 1 potential GATA-1 recognition site and a single CCAAT box (in reverse orientation) (Figure5). We could not identify sequences corresponding to the consensus interferon-stimulated response element found in the promoters of several other Ly-6genes,23,32 although interferon-responsive elements forLy-6 genes have been mapped at distances considerably further than those examined here.32 33 We arbitrarily ended the 3′ untranslated region of Ly-6M at 30 bp beyond the polyadenylation signal. Database inquiries revealed that Ly-6Mshares the highest degree of homology with Sca-1. The exons ofLy-6M and Sca-1 are 87% identical, whereas introns 1 to 3 are 91%, 80%, and 59% identical, respectively. The predicted peptide sequence of Ly-6M is also highly homologous to other Ly-6 proteins and demonstrates structural features conserved among all Ly-6 family members (Figure 6). These features include a short signal peptide, 10 cysteine residues in conserved positions, and a consensus signal for cleavage of a hydrophobic C-terminal tail, followed by addition of a GPI anchor. We confirmed that the signal peptide is functional, because the mature protein was detected in the culture supernatant after transient transfection of COS cells with a mammalian expression vector containing the full-length Ly-6M cDNA (data not shown). We were also able to directly demonstrate that the Ly-6M cDNA encodes a GPI-anchored protein (see below). The amino acid homology of Ly-6M is highest to Sca-1 (72%), followed Ly-6G (65%), Ly-6C (62%), Ly-6F (60%), Sca-2 (21%), and ThB (20%). The homology to human Ly-6 proteins is lower (26% for hSca-2, 21% for E48).
Nucleotide sequence of the Ly-6M gene.
The entire Ly-6 gene is shown with 5′ and 3′ flanking DNA sequences. The exons are in uppercase letters. The amino acid translation is provided in single-letter code under the second nucleotide of each codon. A potential CCAAT box (in reverse orientation), GATA-1 binding site, and polyadenylation signal are boxed.
Peptide alignment of Ly-6 sequences.
The amino acid sequence of Ly-6M is shown aligned with the other known murine and human Ly-6 sequences. Alignment was performed by the Clustal method.41 The boxes enclose conserved cysteine residues as well as the putative amino terminal (L-X-C) and carboxy terminal (D-L-C-N) motifs of the mature peptides.
Ly-6M is expressed in hematopoietic organs
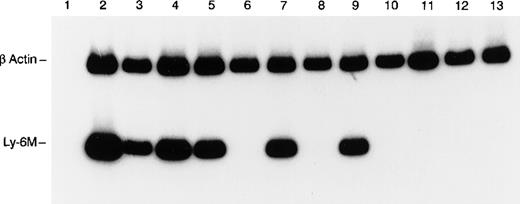
Because of the conserved nucleotide sequences of Ly-6 genes, Northern blot analysis was deemed not sufficiently specific to detect expression of individual Ly-6 family members in a tissue survey. Therefore, a nested RT-PCR strategy was used to detect Ly-6M mRNA expression in the tissues of healthy, young adult mice. To ensure that the PCR signal was absolutely specific for Ly-6M, the amplified products from spleen and thymus were subcloned and sequenced in 3 independent experiments. Only Ly-6M cDNA sequences were detected on these occasions. Ly-6M expression is readily detectable in thioglycollate-elicited peritoneal macrophages, resting spleen, thymus, bone marrow, lung, and kidney, but not in liver, heart, stomach, small intestine, skin, or brain (Figure 7). After 10 additional cycles of PCR, there was still no detectable signal in these latter 6 organs (data not shown). Analysis of these data using phosphorimaging yielded the following semiquantitative estimates of the relative abundance of Ly-6M RNA in the tissues surveyed (normalized for β-actin content and then reported relative to the amount in spleen): peritoneal macrophages (4.0), resting spleen (1.0), thymus (1.8), bone marrow (1.3), kidney (1.5), lung (1.9), liver (0), heart (0), stomach (0), small intestine (0), brain (0), skin (0). Similar results were obtained from 3 experiments using independent RNA sources. Of note, the Ly-6M cDNA sequence is not yet represented in the Genbank EST database.
RT-PCR analysis of Ly-6M expression.
The control β-actin signal (270 bp) is the upper band and the Ly-6M signal (149 bp) is the lower band. The templates are as follows: lane 1 (spleen, no RT), lane 2 (peritoneal macrophages), lane 3 (spleen), lane 4 (thymus), lane 5 (bone marrow), lane 6 (liver), lane 7 (lung), lane 8 (heart), lane 9 (kidney), lane 10 (stomach), lane 11 (small intestine), lane 12 (skin), and lane 13 (brain). PCR products were resolved on 8% polyacrylamide and visualized by autoradiography after a 4-hour exposure.
Ly-6M is a GPI-anchored protein on myelomonocytic cells
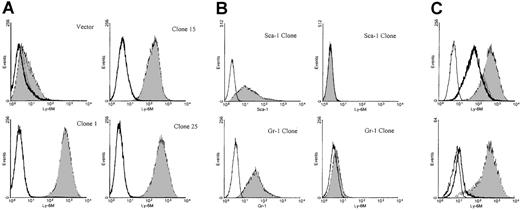
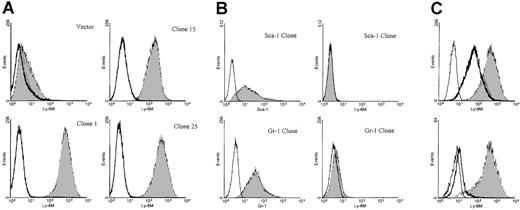
To analyze the pattern of Ly-6M protein expression, rabbit polyclonal antisera were raised against recombinant Ly-6M protein produced in bacteria. To reduce the likelihood of cross-reactivity with other Ly-6 family members, the antisera were affinity purified using a synthetic oligopeptide from a region of the Ly-6M protein with maximal sequence divergence from other known family members. Stable K562 clones expressing the Ly-6M protein were engineered as positive controls for flow cytometry assays. K562 cells are competent to process GPI-anchored proteins, as demonstrated by their abundant expression of hCD55 and hCD59 (data not shown). S1 nuclease protection analysis was used to identify 9 high-expressing clones (data not shown). The affinity-purified anti–Ly-6M antisera was able to detect a range of surface Ly-6M protein expression on these cells by flow cytometric analysis (Figure 8A). This reagent does not cross-react with Ly-6C (data not shown), Ly-6A or Ly-6G (Figure 8B), the 3 Ly-6 proteins with highest homology to Ly-6M. The specificity of the antisera was also demonstrated by the marked reduction in signal noted when the clones were stained after preincubation with saturating amounts of recombinant Ly-6M protein (Figure 8C). Collectively, these data show that the purified anti–Ly-6M antisera are a sensitive and specific reagent for the analysis of Ly-6M expression. As expected, the full-length Ly-6M cDNA encodes a GPI-anchored protein, because incubation of the K562 clones with PI-PLC before staining resulted in a significant shift of mean fluorescence intensity toward the control value (Figure 8C).
Characterization of anti–Ly-6M antisera.
(A) Stable K562 clones expressing either empty vector or the full-length Ly-6M cDNA (clones 1, 15, 25) were stained with control IgG (empty histograms) or anti–Ly-6M antisera (filled histograms). The antisera recognize a range of surface Ly-6M protein expression. (B) Stable K562 clones transfected with either the Ly-6A (upper plots) or Ly-6G (lower plots) cDNAs were obtained. On the left, transgene expression is demonstrated by staining with the indicated monoclonal antibodies (filled histograms) compared with isotype controls (empty histograms). On the right, no cross-reactive staining is noted when these same clones were analyzed using anti–Ly-6M antisera (filled histograms). (C, upper plot) A stable Ly-6M K562 clone was stained with control IgG (solid line) or anti–Ly-6M antisera (filled histogram). The GPI linkage of Ly-6M is demonstrated by a shift in fluorescence to the left when anti–Ly-6M staining was preceded by PI-PLC treatment (heavy line). (Lower plot) A stable Ly-6M K562 clone was stained with control IgG (solid line) or anti–Ly-6M antisera (filled histogram). The specificity of the antisera is demonstrated by a reduction in signal when anti–Ly-6M staining was preceded by preincubation with recombinant Ly-6M protein (heavy line).
We wished to exclude the possibility that the Ly-6M gene encodes the Ly-6B antigen because the Ly-6B gene has not yet been cloned. Of note, because the Ly-6B locus is allelic, the reagents we have developed for the Ly-6M gene are from the same haplotype of mice used to generate the Ly-6B antisera (ie, Ly-6b). Although Ly-6B antisera stained 40% of 129/SvJ bone marrow cells, as previously described,34 the Ly-6M–expressing K562 clones were negative (data not shown). Therefore, the Ly-6B antigen is not the gene product of theLy-6M locus.
We next used 2-color flow cytometric analysis to define the hematopoietic lineages that express Ly-6M. Ly-6M is expressed on 10% to 15% of peripheral blood leukocytes. Most of these cells appear to be CD11b+ (Figure 9A), although a small subpopulation is B220+. The CD3 and NK1.1 compartments are negative for Ly-6M. In the bone marrow, Ly-6M stains 35% to 50% of cells (Figure 9B). All of these cells express moderate to high levels of CD44, but are negative for the erythroid marker Ter119. The F4/80 and CD34 compartments are both uniformly positive for Ly-6M. A plot of Gr-1 versus Ly-6M identified several distinct populations of cells in bone marrow (Figure 9C). Flow sorting, followed by cytospin preparation and May-Grunwald/Giemsa staining, was used to further characterize these populations. The majority of Gr-1bright cells (R1) were mature neutrophils (80% neutrophils, 15% late myeloid precursors, 5% monocytes). These cells appear to be negative for Ly-6M, because cells sorted from the top 1% (which fall to the right of the R1 gate) recapitulated the entire R1 population on reanalysis. The Gr-1dimLy-6M+cells (R2) include more immature neutrophils and monocytes (50% neutrophils, 35% mid-late myeloid precursors, 15% monocytes). The Gr-1negLy-6M+ cells (R3) are more heterogenous (75% early-mid myeloid precursors, 5% monocytes, 10% eosinophils, 10% lymphocytes). Analysis of peripheral blood and bone marrow was performed on 10 mice in 5 independent experiments. The sorting experiment was performed twice. In sum, Ly-6M marks a large number of bone marrow cells, including myeloid precursors, monocytes, and some lymphocytes and eosinophils. In peripheral blood, Ly-6M is present on monocytes and a subpopulation of B220+ cells.
Hematopoietic expression of Ly-6M.
(A) Density plots of peripheral blood leukocytes from wild-type C57BL/6 mice stained with anti–Ly-6M antisera and the indicated lineage markers. The frequency of cells in each quadrant is indicated on the plot. (B) Density plots of bone marrow cells stained with anti–Ly-6M antisera and the indicated markers. (C) Density plot of bone marrow cells stained with Gr-1 versus control IgG (left panel) or Gr-1 versus anti–Ly-6M antisera (right panel). The rectangles define 3 regions used for flow cytometric sorting.
Because Sca-1 and Ly-6M are related antigens, we wished to examine the expression of Ly-6M on hematopoietic stem cells using the well-characterized Sca-1+Lin−immunophenotype.3 In 3 independent experiments, the frequency of Sca-1+Lin− bone marrow cells was 0.32% ± 0.07% (mean ± SD). Fewer than 5% of Ly-6M+ cells are Sca-1+. Within the Sca-1+Ly-6M+ compartment, 99% of cells are Lin+. Therefore, the Ly-6M+ compartment does not overlap significantly with the Sca-1+Lin− population. Further studies will be required to assess the hematopoietic capacity of Sca-1+Ly-6M+Lin− cells.
Discussion
Characterization of the pattern of cell surface protein expression has been a fundamental goal in the study of hematopoietic and lymphoid cell biology. Antibodies specific for the Ly-6 family of GPI-linked proteins have been particularly useful in these studies. The Ly-6 antigen Sca-1 (Ly-6A/E) is commonly used to identify pluripotent hematopoietic stem cells in mice.2,3 Similarly, Sca-2 and Gr-1 (Ly-6G) are well-established markers of immature thymocytes and mature myeloid cells, respectively.35,36 The knownLy-6 genes, as well as perhaps a dozen uncharacterized genes or pseudogenes, appear to be clustered on mouse chromosome 15.27 In this study, we have provided the first direct demonstration of physical linkage of 2 family members (Sca-1and Sca-2) on chromosome 15, band D3.1-3.3. In addition, we have identified a novel family member that maps between theSca-1 and Sca-2 genes. This novel gene, which we designate Ly-6M, is a prototypical family member with conservedLy-6 structural features and a pattern of expression relatively restricted to hematopoietic tissue.
Several lines of evidence have suggested that the Ly-6 genes exist as a tight cluster. First, as individual genes have been cloned, FISH and backcross analyses have uniformly placed them in the same region on chromosome 15.22,25,26 Second, one previous mapping study of this gene family determined that Sca-1 andLy-6C are contained within 2 nonoverlapping cosmid clusters that localize to adjacent regions within a 630-kb span of the mouse genome.27 These authors estimated that there may be 16 other related genes in the vicinity. Finally, the high degree of homology between Ly-6 family members suggests that they may have evolved as a result of gene duplication. Highly homologous genes derived from duplication events are often tightly linked in the genome, as exemplified by the β globin locus.37,38 In this study, we were able to map 3 Ly-6 family members (Sca-1,Ly-6M, and Sca-2) to a 40-kb region on chromosome 15. Preliminary analysis of additional overlapping P1 clones suggests that several other homologous genes (or pseudogenes) lie immediately upstream of Sca-1. These findings are consistent with the previous genomic analysis of the Ly-6 locus.27 The 50-kb region we have characterized partially overlaps cosmid cluster A from the previous report.27 The positions we have defined for the Sca-1 and Ly-6M genes appear to map to the same locations as the Ly-6 homologous HindIII fragments designated by those investigators H6 and H16, respectively.27 The Sca-2 gene lies outside of the region included in the previous study. A detailed analysis of the entire cluster is an important prerequisite for the interpretation of mice with targeted mutations of a specific family member, because these mutations can have unanticipated effects on the expression of closely neighboring genes.39 In this case, it is possible that altered expression of Ly-6M may have contributed to the phenotype observed in Sca-1–deficient mice.8
Previous studies noted that an Ly-6 homologous sequence is located approximately 10 kb downstream of Ly-6E (the Sca-1 allele in Ly-6.1 strains).27,33 These authors could not determine whether this region contains a transcriptionally active gene or a pseudogene. We have determined that the Ly-6M gene accounts for this cross-hybridizing signal. Ly-6M has typical Ly-6gene structure (4 small exons, with the coding sequence beginning in the middle of exon II) and its cDNA is highly homologous to other family members. Like other Ly-6 proteins, Ly-6M is GPI-linked and has 10 cysteine residues in conserved positions. Our RNA analysis suggests that it is a hematopoietic gene, because it is expressed abundantly in bone marrow, spleen, and thymus. The presence of the transcript in the macrophage library, as well as primary peritoneal macrophages, suggests that the monocytic lineage is among the hematopoietic compartments expressing Ly-6M. The signal we detected in the lung is also consistent with the tissue distribution of macrophages. This cannot account for the apparent expression in kidney, although several other Ly-6genes expressed primarily on hematopoietic cells are also expressed in kidney.40 Immunohistochemical analysis will help define the cellular localization of Ly-6M expression within these organs. Flow cytometric analysis of bone marrow and peripheral blood cells confirmed expression of Ly-6M in the monocytic and myeloid lineages in addition to a subpopulation of B220+ cells. Despite the close homology of Ly-6M and Sca-1, only a minority of Sca-1+Lin− cells express Ly-6M. Additional experiments will be required to determine whether this population has unique developmental characteristics. In sum, although most Ly-6 proteins have rather lineage-restricted patterns of expression (eg, Sca-1, Gr-1, ThB, Sca-2), Ly-6M and Ly-6C appear to be in a subfamily with a broad distribution of hematopoietic expression.
The function of Ly-6 proteins remains to be established. The pleiotropic effects that have been ascribed to Ly-6 proteins in various experimental models reflects an underlying uncertainty about the biologic processes they mediate. The tight clustering of these genes and their overlapping cellular distributions predict that they might have at least partially overlapping biologic roles. This also leads to the prediction that single gene deletion studies may not be informative because of the possible redundancy among family members. This may account for the subtle phenotype noted in Sca-1–deficient mice.8 Nevertheless, a loss of function model should provide some insight into the role of the Ly-6M protein. The Ly-6 proteins have proven to be extremely useful tools for the identification of hematopoietic cell populations. Hopefully, functional studies of the Ly-6 proteins will teach us more about the biology of hematopoietic and lymphoid cells.
Acknowledgments
We thank Ms Sally Meek for expert technical assistance and Jeff Haug for performing flow cytometric sorting. We also acknowledge helpful discussions with Dr Roger Palfree, Dr Dan Link, and Dr Timothy Ley.
Supported in part by National Heart, Lung, and Blood Institute grant K08 HL03872-01 (T.A.G.).
Reprints:Timothy Graubert, Washington University School of Medicine, Division of Bone Marrow Transplantation and Stem Cell Biology, Campus Box 8007, 660 S Euclid Ave, St Louis, MO 63110; e-mail: graubert@medicine.wustl.edu.
The publication costs of this article were defrayed in part by page charge payment. Therefore, and solely to indicate this fact, this article is hereby marked “advertisement” in accordance with 18 U.S.C. section 1734.

