Abstract
Tumor necrosis factor–related apoptosis-inducing ligand (TRAIL), a member of the tumor necrosis factor (TNF) family, binds to several cell-surface receptors with distinct functions (agonistic receptors 1 and 2 [TRAIL-R1, TRAIL-R2]; decoy receptors 3 and 4 [TRAIL-R3, TRAIL-R4]). Expression and function was characterized in patients with myelodysplastic syndromes (MDSs). While normal marrow showed negligible expression of TRAIL and receptors (except TRAIL-R3), TRAIL and all receptors were constitutively expressed in MDS marrow. Following TRAIL exposure, MDS marrow showed significant increases in apoptosis, whereas normal marrow, except for a subset of CD34+ precursors, did not (P = .012). Marrow from 21 patients with MDS was then propagated in long-term cultures in the presence or absence of TRAIL. While in advanced MDS (refractory anemia with excess blasts in transformation [RAEB-T] and tAML [MDS transformed into AML]), colony numbers decreased in the presence of TRAIL (63.0% ± 10.4% of untreated group [100%]), numbers increased in patients with RA or RAEB (160.2% ± 90.5% of untreated group). TRAIL eliminated preferentially clonally abnormal cells as identified by chromosomal markers. Thus, TRAIL and receptor expression differed significantly between normal and MDS marrow, and TRAIL modulated in vitro hemopoiesis in MDS dependent upon disease stage but not, to a detectable extent, in normal marrow.
Introduction
The myelodysplastic syndromes (MDSs) comprise a heterogeneous group of hemopoietic stem cell disorders usually characterized by a cellular marrow with dysplastic features, peripheral blood cytopenias, and a variable incidence of transformation into acute myeloid leukemia (AML).1 MDS generally occurs in elderly patients, the median age at diagnosis being 65 to 70 years.2 Allogeneic hemopoietic stem cell transplantation is currently considered the only curative treatment modality for MDS; however, age and performance status of patients and lack of histocompatible donors limit the applicability of this treatment. Also, regimen-related toxicity is a major problem in patients with MDS undergoing transplantation.3 4 It would be desirable, therefore, to develop new therapeutic strategies to improve or restore normal hemopoietic function.
One mechanism invoked to explain the apparent discrepancy between cellular marrow and peripheral blood cytopenias in patients with MDS is programmed cell death (apoptosis), which occurs with increased frequency in MDS marrow.5,6 Several cytokines or ligands known to have proapoptotic properties, such as interleukin-1β (IL-1β), tumor necrosis factor α (TNFα), and Fas-ligand are up-regulated in many patients with MDS.5,7-9 We and others have shown that blockade of TNFα or Fas-ligand enhances hemopoietic colony transformation from MDS marrow in vitro and improves blood cell counts in vivo.5,7,10 However, it is clear from those studies that the regulation of hemopoiesis in MDS is complex and multiple factors are involved. The TNF-related apoptosis-inducing ligand (TRAIL), also known as Apo2 ligand (Apo2L), is a member of the TNF family and induces apoptosis preferentially in transformed and tumor cells but generally not in normal cells.11-13However, these observations must be extrapolated with caution because TRAIL effects on normal cells, for example, in the brain, have been documented.14 In MDS marrow, normal precursors and clonally abnormal cells typically coexist. If exposure to TRAIL resulted in selective elimination of the abnormal clone, TRAIL might be a useful therapeutic agent for MDS, certainly for marrow purging (and autologous stem cell transplantation) if not for in vivo treatment. The exact mechanism by which TRAIL eliminates tumor cells preferentially or selectively is not known. One possibility is differential expression of agonistic receptors 1 and 2 (TRAIL-R1 and -R2, also known as death receptors 4 [DR4] and DR5) and antagonistic or modulatory receptors, TRAIL-R3 and -R4, also known as decoy receptors 1 (DcR1) and DcR2.15,16 An alternative mechanism would be differential expression of, or functional defects in, cytoplasmatic inhibitors of apoptosis such as the Fas-associated death domain protein (FADD)17 or FADD-likeIL-1β–converting enzyme (ICE)–inhibitoryprotein (FLIP).18
The objective was to exploit the potential selective killing of clonal and, presumably, malignant cells by human TRAIL. Thus, we determined the effect of TRAIL on apoptosis and hemopoiesis in long-term marrow cultures (LTMC) of normal and MDS marrow, and characterized the expression of TRAIL and its receptors. We also characterized the expression of FLIP in marrow cells from patients with MDS and healthy donors.
Materials and methods
Marrow cells
Bone marrow (BM) samples were obtained from 44 patients with MDS (refractory anemia [RA], n = 20; RA with ring sideroblasts [RARS], n = 4; RA with excess blasts [RAEB], n = 9; RAEB in transformation [RAEB-T], n = 9; chronic myelomonocytic leukemia [CMML], n = 2), 6 patients whose disease had transformed to AML, and 20 healthy volunteer donors. Patients and healthy donors had given informed consent according to the procedures approved by the Institutional Review Board of the Fred Hutchinson Cancer Research Center (FHCRC). Samples were processed as described19 20 for in vitro hemopoiesis, phenotyping, characterization of apoptosis, RNA extraction, and cytogenetic analysis with fluorescence in situ hybridization (FISH).
Cell lines
Human acute myelogenous leukemia cell line KG1, acute T-cell leukemia cell line Jurkat, and human colon cancer cell line Colo 205 were obtained from American Type Culture Collection (Rockville, MD).
Antibodies and reagents
The following monoclonal antibodies (mAbs) were obtained from commercial sources: fluorescein isothiocyanate (FITC) or phycoerythrin (PE)-conjugated mouse anti–human CD3 (IgG2a), CD13 (IgG1), CD14 (IgG2a), CD34 (HPLC-2, IgG1), and CD45 (IgG1) (Becton Dickinson, San Jose, CA, or Caltag, San Francisco, CA); FITC or PE-conjugated mouse F(ab′)2 IgG1 or IgG2a or IgG2b (Becton Dickinson) or mouse IgM (Catalag) as isotype controls; FITC or PE-conjugated goat F(ab′)2 anti–mouse IgG (H+L) or IgM (Caltag) as secondary antibodies; rabbit anti–mouse IgG to carboxy terminus human FLIP long form for Western blot (Calbiochem, La Jolla, CA). The mouse anti–human IgM STRO-1 mAb, which recognizes a stromal cell surface antigen,21 was obtained from Developmental Studies Hybridoma Bank (Iowa City, IA). The monoclonal mouse anti–human TRAIL (IgG1, M180, blocking; M184, nonblocking), TRAIL-R1 (IgG2a, M271), TRAIL-R2 (IgG1, M413), TRAIL-R3 (IgG1, M430), TRAIL-R4 (IgG1, M444), as well as stem cell factor (SCF), and leucine zipper (LZ)–tagged soluble trimeric human TRAIL were supplied by Immunex (Seattle, WA). IL-1, IL-3, IL-6, granulocyte colony-stimulating factor (G-CSF), and granulocyte-macrophage colony-stimulating factor (GM-CSF) were purchased from R & D Systems (Minneapolis, MN).
Phenotyping of marrow cells
Phenotypic analysis of marrow cells was carried out by flow cytometry as described.5 For determination of the expression of TRAIL and its receptors, 105 cells were incubated with 10 μg/mL mAb against human TRAIL or TRAIL-R1 to -R4 for 30 minutes on ice. After washes in phosphate buffered saline (PBS), cells were incubated for 30 minutes on ice with PE-conjugated (secondary) goat F(ab′)2 anti–mouse IgG. For 2-color immunofluorescence, FITC-conjugated mAbs for CD3, CD19 (for the lymphocyte gate), CD13 (for the granulocyte gate), CD14 (for the monocyte gate), and CD34 (for the hemopoietic progenitor cell gate) were incubated after staining with mAbs to human TRAIL and TRAIL-R1 to -R4, PE-conjugated (secondary) goat F(ab′)2 anti–mouse IgG. Blast cells were isolated on the basis of orthogonal light scatter and CD45 labeling as described.22 23 Cells labeled with irrelevant isotype-matched mAb and incubated with the secondary detection antibody served as negative controls. Data on at least 10 000 events were collected using a FACScan (Becton Dickinson) and analyzed using CellQuest software (Becton Dickinson).
Reverse transcription–polymerase chain reaction amplification
RNA preparation and reverse transcription (RT) were carried out as described.5 18 Total RNA was prepared from cell pellets using the RNeasy Total RNA kit (Qiagen, Chatsworth, CA). Cells were lysed in buffer RLT (4 M guanidinium isothiocyanate, 0.5% sarcosyl, and 0.1 M 2β-mercaptoethanol) and homogenized using a QIAshredder spin column. After centrifugation, an equal volume of 70% ethanol was added to the lysate, and the mixture was applied onto RNeasy spin columns. Total RNA, which binds to the silica gel membrane under high salt-buffer conditions, was washed with buffers RW1 and RPE (supplied with the kit), and then eluted in DEPC-treated water. Finally, any remaining DNA was removed by digestion with RNase-free DNase. The concentration and purity of the RNA was determined by measuring the absorbance at A260/A280 and by gel electropheresis.
To synthesize cDNA, 1 μg the total RNA (generally corresponding to ≈ 0.5 × 10⁶ cells) was combined with 1 μL Oligo (dT)12-18 (500 μg/mL; Gibco/BRL, Gaithersburg, MD) and heated for 5 minutes to 70°C; the resulting heteroduplex was resuspended to 20 μL in RT buffer and incubated for 30 minutes at 37°C with 200 U Moloney murine leukemia virus (M-MLV) reverse transcriptase (Gibco/BRL). After adding a second 100 U aliquot M-MLV, the reaction was continued for an additional 15 minutes prior to heat-inactivating the enzyme for 2 minutes at 80°C. cDNA was stored at −70°C. Samples were then thawed in batches for polymerase chain reaction (PCR) amplification.
The cDNA was amplified by PCR in a reaction mixture consisting of 50 mM KCl, 20 mM Tris-HCl (pH 8.4), 0.1% Triton X-100, 1 mM DTT, 2.0 mM MgCl2, all 4 dNTPs (each at 0.2 mM), 10 pmol of each oligonucleotide primer (see below), and 2.5 unitsTaq DNA Polymerase (Boehringer Mannheim). Amplification was performed in 0.5-mL Gene Amp tubes in a final volume of 50 μL. The PCR mixes were overlaid with mineral oil and amplified for 30 to 40 cycles (see below) denaturation (at 94°C for 1 minute), annealing (at 55°C to 65°C [see below] for 1 minute, and extension at 72°C for 1 minute). PCR products were size-fractionated and analyzed by 1.5% agarose gel electropheresis and normalized according to the amount of β-actin in the same cDNA sample. PCR product sizes were determined from comparison to the Ready-Load 100 base pair (bp) DNA standard ladder (Gibco/BRL).
PCR reactions were performed using the following primers: β-actin (forward: 5′-TCCTGTGGCATCCACGAAACT-3′, reverse: 5′-ATCGTCCACCGCAAATGCTTC-3′); TRAIL (forward: 5′-GGAACCCAAGGTGGGTAGAT-3′, reverse: 5′-TCTCACCACACTGCAACCTC-3′); TRAIL-R1 (forward: 5′-CTGAGCAACGCAGACTCGCTGTCCAC-3′, reverse: 5′-TCCAAGGACACGGCAGAGCCTGTGCCAT-3′); TRAIL-R2 (forward: 5′-GCCTCATGGACAATGAGATAAAGGTGGCT-3′, reverse: CCAAATCTCAAAGTACGCACAAACGG-3′); TRAIL-R3 (forward: 5′-GAAGAATTTGGTGCCAATGCCACTG-3′, reverse: 5′-CTCTTGGACTTGGCTGGGAGATGTG-3′); TRAIL-R4 (forward: 5′-CTTTTCCGGCGGCGTTCATGTCCTTC-3′, reverse: 5′-GTTTCTTCCAGGCTGCTTCCCTTTGTAG-3′); and long form of FLIP (forward: 5′-AATTCAAGGCTCAGAAGCGA-3′, reverse: 5′-GGCAGAAACTCTGCTGTTCC-3′). The sizes of the expected products were 304, 192, 506, 502, 612, 453, and 226 bp, respectively. Human β-actin PCR-cycle conditions were 95°C for 45 seconds, 55°C for 1 minute, and 72°C for 45 seconds for 30 cycles. Human TRAIL-R1, -R2, -R3, and FLIPLconditions were 94°C for 1 minute, 55°C for 1 minute, 72°C for 1 minute for 30 cycles. Human TRAIL-R4 conditions were 95°C for 4 minutes 15 seconds, followed by 30 cycles of 95°C for 45 seconds, 60°C for 45 seconds, and 72°C for 45 seconds for 30 cycles.18 Samples were resolved on 2% agarose gels and visualized with ethidium bromide.
Western blot analysis
Western blots were performed as previously described.18 Briefly, marrow mononuclear cells (MMNCs) from patients with MDS or from healthy donors were lysed in PBS containing 1% Nonidet P-40, 0.35 mg/mL PMSF, 9.5 μg/mL leupeptin, and 13.7 μg/mL pepstatin A. The lysed cells were washed, and protein concentrations of the extracts were determined by colorimetric assay (Bio-Rad, Richmond, CA). Equal amounts of protein were separated by sodium dodecyl sulfate–polyacrylamide gel electrophoresis (SDS-PAGE), transferred to polyvinylidine difluoride (PVDF; Bio-Rad), and blocked with 5% nonfat dry milk in 1 × Tris buffered saline for 1 hour. The membranes were then incubated with the FLIP antiserum (diluted 1:1000) overnight, washed and incubated with an anti–rabbit horseradish peroxidase antibody (diluted 1:10 000; Amersham, Arlington Heights, IL) for 1 hour. Following several washes, the blots were developed by chemiluminescence reagent (Pierce, Rockford, IL).
Apoptosis assay
Marrow cells from healthy donors and from patients with MDS were incubated in 48-well plates (5 × 10⁵ cells/well) with progressively increasing concentrations of purified LZ–human TRAIL (0, 10, 30, 100, 300, 1000, and 3000 ng/mL) for 3, 6, 12, and 24 hours.12,13,18 Apoptotic changes were identified by staining with FITC-conjugated Annexin V (Immunotech, Westbrook, ME)24,25 and by means of DNA histograms to identify hypodiploid nuclei (sub–G1 peak) using flow cytometric analysis as described.26 To determine a possible effect of LZ-TRAIL on the marrow “microenvironment” and on stroma cells, adherent cell cultures were established.27 Adherent cell layers from marrow cells and STRO-1–positive/glycophorin-negative sorted cells were established in T25 tissue culture flasks (Corning, NY) using Iscoves modified Dulbecco medium (Gibco, Grand Island, NY) supplemented with 12.5% each of heat-inactivated horse and fetal calf serum (FCS), 0.4 mg/mL l-glutamine, 1 mM sodium pyruvate, 10-6 M hydrocortisone, 10-4 M 2-mercaptoethanol, 100 U/mL penicillin, and 100 μg/mL streptomycin.28 Flasks were demidepleted of cells at weekly intervals. After 4 weeks, nonadherent cells and monocytes were removed by 3 trypsinization passes, and negative selection by PE-conjugated anti-CD14 mAb. Apoptosis was determined as described.
Cytogenetic and fluorescence in situ hybridization analysis
To determine whether TRAIL-mediated apoptosis occurred preferentially in clonal cells (identifiable by a chromosomal marker), we performed cytogenetic and fluorescence in situ hybridization (FISH) analysis on marrow cells from 9 patients with MDS before and after exposure to LZ-TRAIL (300 ng/mL).29 We also determined the proportion of cytogenetically abnormal cells among apoptotic (Annexin V–stained) and nonapoptotic (Annexin V–negative) marrow cells from 3 patients with MDS following sorting by flow cytometry after exposure to LZ-TRAIL (300 ng/mL).
In vitro hemopoiesis
Marrow cultures were carried out using the Dexter method.30,31 Stromal layers were established in T25 tissue culture flasks (Corning) using Iscoves modified Dulbecco medium. Flasks were demidepleted of cells at weekly intervals. At 2 to 3 weeks, the stromal cells were irradiated with 1800 cGy, removed from the flask by a brief exposure to 0.05% trypsin, and 1.25 × 10⁵viable cells/mL were plated as a supportive layer in flat-bottomed 48-well plates (Costar, Cambridge, MA). After 1 to 5 days, MMNCs (0.5 × 10⁶ cells/well) were layered onto the stromal layers in replicates of 3. LZ-TRAIL (300 ng/mL) and M180 as a blocking Ab to TRAIL (300 ng/mL) were added to culture wells as indicated. Cultures were maintained at 33°C in a humidified air of 5% CO2 atmosphere. After 1 week, nonadherent cells were collected, plates were washed twice with Ca++- and Mg2+-free Hanks balanced salt solution, and 100 μL 0.05% trypsin was added to each well. Adherent cells were removed and combined with nonadherent cells and washed once. The cell mixture was then resuspended in 3.5 mL 2 × Dulbecco medium containing 40% fetal calf serum, mixed with an equal volume of 0.06% agar (Difco, Detroit, MI) and aliquoted into 35 × 10 mm culture dishes (2 mL/dish). Ten μL of a cytokine mixture (including IL-1, IL-3, IL-6, G-CSF, GM-CSF, and SCF at concentrations of 10 μg/mL each) was added to each dish.27 Untreated cells served as controls. After 2 weeks, the plates were scored for colony numbers. Groups of at least 40 cells were counted as colonies.
Statistical analysis
The Mann-Whitney U test was used to compare the levels of expression of TRAIL and TRAIL receptors between normal and MDS marrow. A Wilcoxon signed-rank test was used to compare apoptosis percentages and colony numbers between untreated and LZ-TRAIL–treated normal and MDS marrow. Significant differences between data from specific groups were defined as those with P ≤ .05.
Results
TRAIL-induced apoptosis in normal and MDS marrow
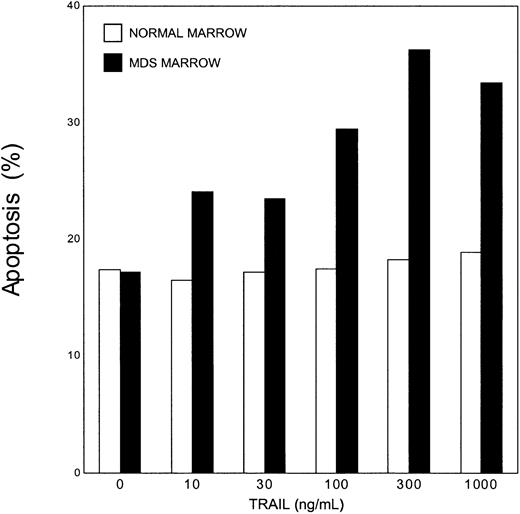
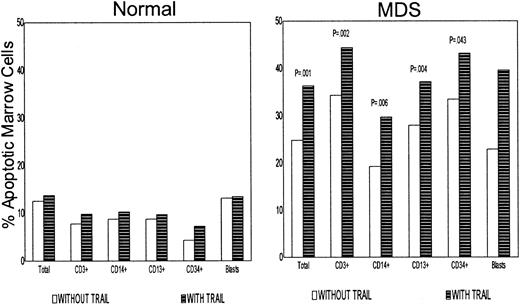
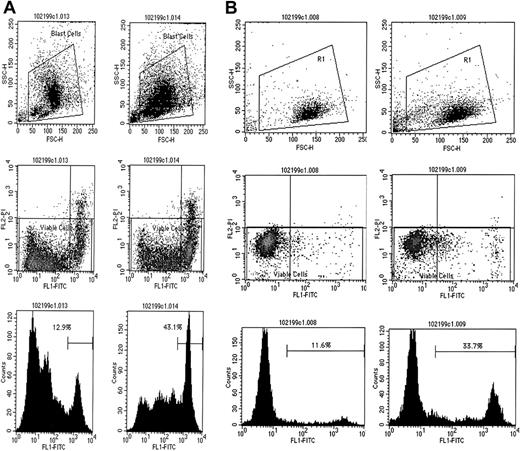
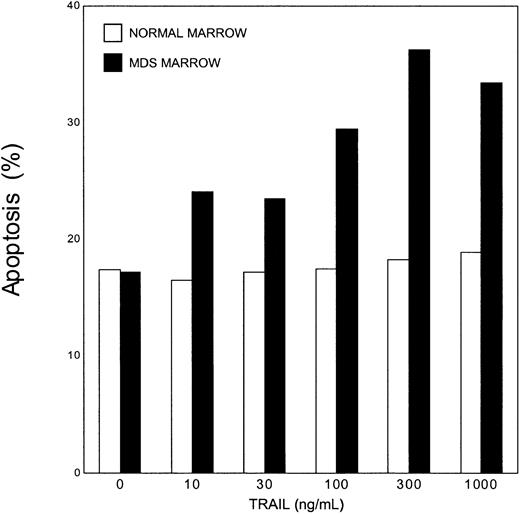
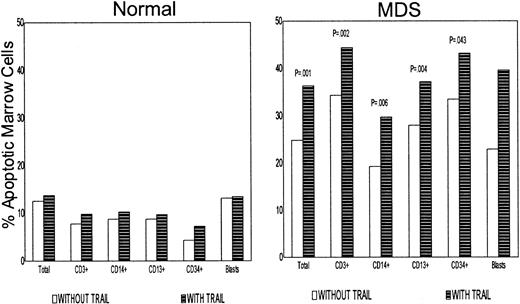
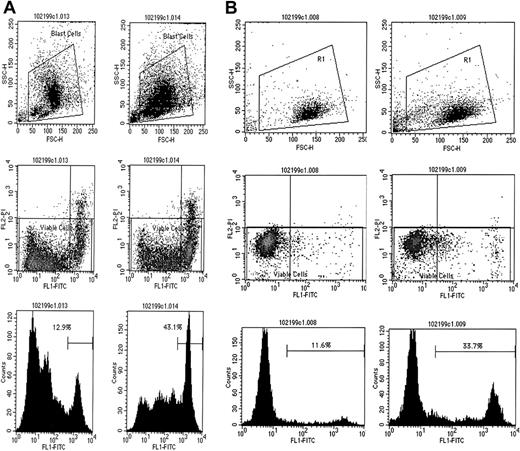
In ancillary dose/response experiments, apoptosis was determined in the TRAIL-sensitive cell lines Colo 205, Jurkat, and KG1. The extent of apoptosis was assessed by Annexin V–staining and DNA histograms (data not shown). Based on those results, marrow from healthy donors and patients with MDS was exposed to TRAIL at concentrations as high as 1000 ng/mL for up to 24 hours. Results are summarized in Figures 1 and 2. In unfractionated mononuclear cells from normal marrow, even at the highest TRAIL concentrations and exposure for 24 hours, no increase in the proportion of apoptotic cells was detectable. In MDS marrow, in contrast, apoptosis increased above baseline already at TRAIL concentrations of 10 ng/mL and reached a maximum/plateau with a 100% increase at TRAIL concentrations of 300 ng/mL and exposure durations of 6 to 12 hours. An increase in apoptosis was observed in all subpopulations of cells studied (Figure2): total marrow, 24.8% ± 14.0% increased to 36.3% ± 18.0%, P = .011; CD3+, 34.3% ± 20.0% to 44.4% ± 24.9%,P = .002; CD14+, 19.2% ± 17.2% to 29.7% ± 24.2%, P = .006; CD13+, 27.9% ± 24.5% to 37.1% ± 27.1%, P = .004; CD34+, 33.3% ± 35.1% to 43.2% ± 30.7%,P = .043). There was no difference between CD34+ /CD33+ and CD34+/CD33− precursors. Two examples, MDS blasts and CD34+ precursors, are shown in Figure 3. The most prominent increase in apoptosis was seen in MDS blasts (22.9% ± 12.4% to 39.6% ± 16.1%). The increase in TRAIL-mediated apoptosis was prevented in the presence of the blocking anti-TRAIL mAb, M180 (data not shown). In normal marrow, no change in the proportion of apoptotic cells following LZ-TRAIL exposure was detected in the CD3+, CD14+, or CD13+ gates. However, in the gate of CD34+ precursors, the proportion of apoptotic cells was 4.3% ± 2.8% before and 7.3% ± 4.3% after LZ-TRAIL exposure (n = 7; P = .06). This finding suggests a physiologic role for TRAIL and its receptors in the regulation of normal hemopoiesis at a CD34+ precursor stage as recently suggested by others.32
TRAIL-induced apoptosis in normal and MDS marrow cells.
The extent of apoptosis in normal and MDS marrow cells exposed to TRAIL at 0 to 1000 ng/mL for 12 hours was assessed by Annexin V staining and by way of DNA histograms (see “Materials and methods”). Shown are the mean values for normal marrow (n = 10) and for MDS marrow (n = 22); standard deviations ranged from ± 6% to ± 8% for normal, and ± 8% to ± 14% for MDS marrow.
Apoptosis in subpopulations of normal and MDS marrow cells.
Shown is the extent of apoptosis before (left column) and after TRAIL exposure (right column) obtained with 10 normal and 14 MDS marrow and exposure for 6-12 hours at 300 ng TRAIL/mL. Shown are mean values; standard deviations ranged from ± 4% to ± 7% in normal, and ± 6% to ± 15% for MDS marrow.
TRAIL-induced apoptosis in MDS marrow.
TRAIL-induced apoptosis in aberrant MDS blasts (A) and in CD34+ precursors from MDS marrow (B). Panels in the left columns represent data before, and in the right columns, after TRAIL exposure. Shown are the gates used (top), scattergrams (middle), and DNA histograms (bottom) of gated cells. FSC indicates forward scatter; SSC, orthogonal scatter; FLI-FITC, fluorescence intensity after labeling with FITC-conjugated Annexin V; FL2-PI, fluorescence intensity after staining with propidium iodine; counts, relative number of cells. Percentage figures in the bottom panels indicate proportions of apoptotic cells.
Differences in regard to susceptibility to apoptosis were also observed among adherent cell layers, whereas TRAIL exposure failed to have a significant effect on adherent layers derived from normal marrow (10.2% apoptosis before TRAIL exposure, 14.4% after TRAIL exposure), the proportion of apoptotic cells in adherent layers derived from MDS marrow increased significantly after TRAIL exposure from 23.6% ± 7.1% to 47.4% ± 9.4% (P = .04). Apoptosis was limited to CD14+ and other mononuclear cells; no apoptosis was observed in STRO−/+glycophorin−/CD14− stromal cells.
Surface expression of TRAIL and its receptors on normal and MDS marrow cells
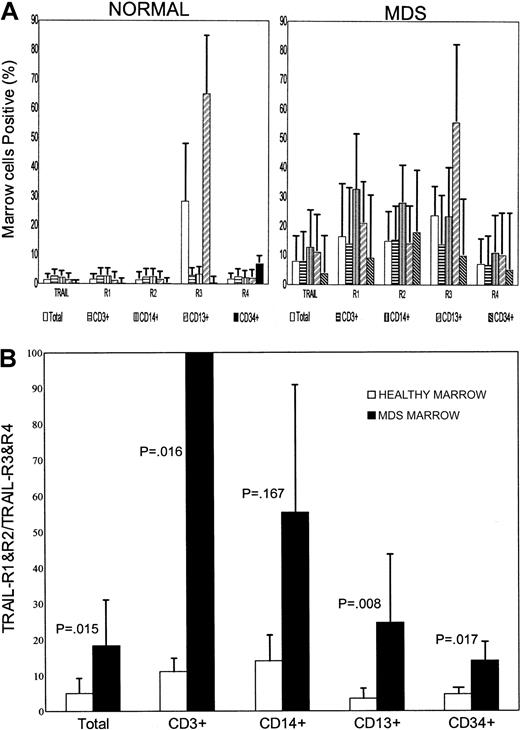
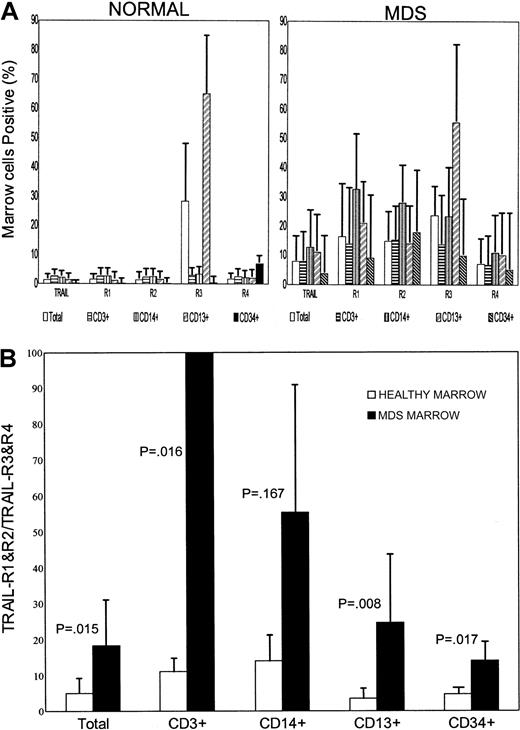
The higher TRAIL susceptibility of malignant cells may be due to differential expression of the agonistic (TRAIL-R1 and -R2) and decoy (TRAIL-R3 and -R4) receptors.15 16 We determined surface expression of TRAIL and its receptors on marrow cells from 21 patients with MDS and from 10 healthy donors. Results are summarized in Figure4A. In normal marrow, the expression of TRAIL and its receptors was negligible except for TRAIL-R3. On MDS marrow cells, in contrast, TRAIL and receptors R1, R2, R3, and R4 were constitutively expressed: TRAIL, 1.4% ± 0.6% (mean ± SD) of cells in normal vs 7.9% ± 10.0% in MDS marrow (P = .011); TRAIL-R1, 1.4% ± 0.4% vs 16.3% ± 23.1% (P = .017); TRAIL-R2, 1.4% ± 0.6% vs 14.9% ± 21.2% (P = .001); TRAIL-R3, 28.3% ± 20.7% vs 23.6% ± 17.2% (P = .495); TRAIL-R4, 1.6% ± 0.6% vs 7.0% ± 11.3% (P = .043). TRAIL-R3 expression on normal cells was restricted to the granulocyte gate (CD13+) (65.0% ± 25.8%). TRAIL-R2 expression in MDS marrow was significantly higher than in normal marrow in the lymphocyte gates (CD3+ or CD19+), in the monocyte gate (CD14+), and in the granulocyte gate. In purified CD34+ cells or blasts, a distinct pattern of expression was noted especially for TRAIL-R2. Among CD34+ cells from MDS marrow, 17.9% ± 34.3% expressed TRAIL-R2 vs 0.2% ± 0.1% in normal marrow. Among MDS blasts, 50.5% ± 48.1% were TRAIL-R2–positive vs 1.4% ± 1.2% in normal marrow.
Surface expression of TRAIL and TRAIL receptors on marrow cells and ratio of surface expression of TRAIL-R1 and R2 to TRAIL-R3 and R4.
(A) Surface expression of TRAIL and receptors R1 to R4 on marrow cells from 10 healthy donors (Healthy) and 20 patients with MDS (MDS). Shown are results for total marrow, CD3+, CD14+, CD13+, and CD34+ cells (mean ± 1 SD); β-actin served as internal standard. (B) Ratio of surface expression (as shown in part A) of TRAIL receptors R1 and R2 (agonistic) over R3 and R4 (decoy) in marrow from 10 healthy donors and from 20 patients with MDS. Shown are the results (mean ± 1 SD) for total marrow and for CD3+, CD14+, CD13+, and CD34+ cells, respectively.
To estimate TRAIL sensitivity on the basis of expression of TRAIL receptors, we calculated the ratio of agonistic (TRAIL-R1 and -R2) to antagonistic (TRAIL-R3 and -R4) receptors. As shown in Figure 4B, in MDS marrow this ratio was significantly higher than in normal marrow (18.4% ± 20.3 vs 5.1% ± 6.3, P = .015). These data are compatible with the higher susceptibility to TRAIL-induced death observed in MDS marrow.
Expression of mRNA for TRAIL and its receptors in marrow cells
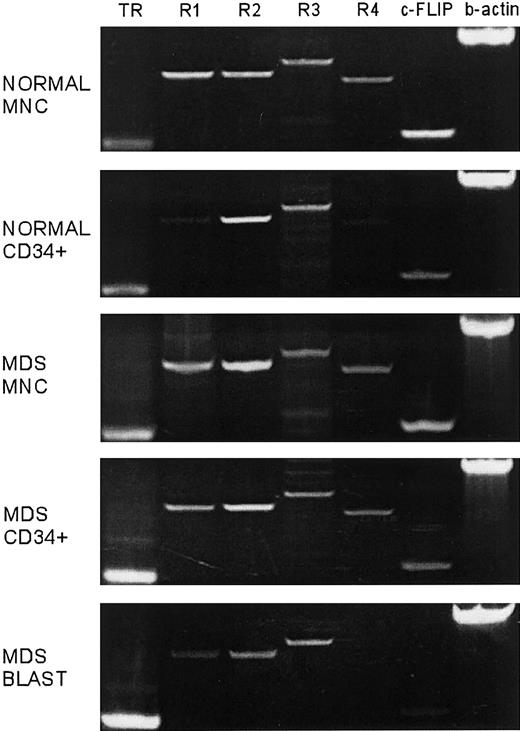
Estimation of mRNA expression was based on band intensities of electropheresed RT-PCR products. Although mRNA for TRAIL and all TRAIL receptors was detected in cells from both normal and MDS marrow, in agreement with the data on cell surface expression, the ratio of agonistic TRAIL-R1 and -R2 to decoy TRAIL-R3 and -R4 receptors was higher in MDS than in normal marrow (Figure5). When only CD34+ cells were considered, the ratio was again higher in CD34+ cells from MDS marrow. Further, within MDS marrow, there was a higher ratio in blast cells than in the non–blast cell population. This suggests that blast cells might be particularly vulnerable to TRAIL-induced apoptosis, a fact that might explain the phenomenon that a clonal (blast) population can exist in MDS marrow for extended periods of time without expanding and developing into frank leukemia.
Expression of TRAIL and TRAIL receptors R1-R4 mRNA in normal and in MDS marrow.
Shown are examples for total mononuclear cells (MNC) and CD34+ precursors, and separately, MDS blasts sorted on the basis of CD45 expression and orthogonal light scatter as described previously; β-actin served as internal standard.5 22
Expression of apoptosis inhibitory protein FLIP
In addition to the expression of agonistic and decoy receptors, differences in intracellular modification of TRAIL signals could explain differential effects in normal and malignant cells. FLIP, a cytoplasmatic inhibitor of apoptosis, can interfere with TRAIL-induced cell death.33 Griffith et al described a correlation between the level of expression of FLIP and sensitivity to TRAIL in a melanoma cell line.18 Thus, we compared the level of FLIP expression in normal and MDS marrow at the mRNA and protein levels. FLIP mRNA was present in both normal and MDS marrow, though quantitative differences were observed in MDS marrow. Differences in RNA levels for FLIP were reflected in differences in the protein levels as determined by Western blots (Figure6). The ratio of mRNA expression of agonistic (R1 and R2) receptors to the cytoplasmatic inhibitor FLIP was higher in MDS marrow than in normal marrow, and within MDS marrow this ratio was higher in blasts than in the remainder of cells. This observation was consistent with the notion that apoptosis is facilitated in blasts, thereby controlling the size of the clonal (blast) pool.
Expression of FLIP protein in normal (n = 3) and in MDS marrow (n = 5).
Shown is an original gel (top) and a Western blot for FLIP using marrow cells from 3 healthy donors (1,2,3), 4 marrow (JLP [RA], JAC [RA], GRD [tAML], and FWH [RA]), and one example of peripheral blood cells (PJC [RAEB]) from patients with MDS. MW indicates molecular weight.
Cytogenetics and FISH analysis
To determine whether TRAIL-mediated apoptosis eliminated selectively or preferentially clonal (malignant) cells, we performed FISH analysis on the marrow from patients with MDS with a cytogenetic marker before and after TRAIL exposure. Based on results of ancillary time course studies, cells were exposed to TRAIL for 6 hours. Results in 8 individuals are summarized in Table1. After TRAIL exposure, the proportion of cytogenetically abnormal cells decreased in 6 of 9 MDS marrows studied, especially in marrow from patients with RA. While the results suggest that LZ-TRAIL eliminated predominantly abnormal cells in certain MDS marrows, results indicate considerable heterogeneity.
In vitro hemopoiesis
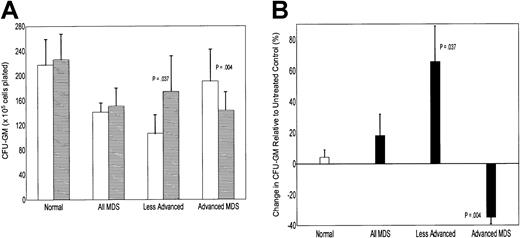
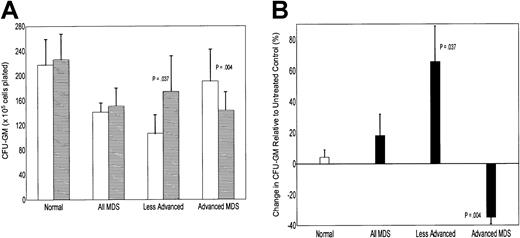
To determine whether the effects of human LZ-TRAIL on marrow cells were of functional relevance, we characterized in vitro hemopoiesis of marrow mononuclear cells from 21 patients with MDS (RA n = 8, RARS n = 3, RAEB n = 3, CMML n = 1, RAEBtn = 4, and tAML from MDS n = 2) and 6 healthy donors were propagated in LTMC in the presence or absence of human TRAIL (Figure7). As postulated, numbers of colonies from normal marrow did not change in the presence of LZ-TRAIL (104% ± 5% of untreated group [100%]). In MDS marrow, colony numbers were slightly increased in the presence of LZ-TRAIL when results of all MDS marrows were combined (114% ± 14% of untreated group). However, results were strikingly dependent upon disease stage. In advanced MDS (RAEB-T and tAML) colony and cluster numbers decreased significantly in the presence of TRAIL (65% ± 7% of untreated marrow; P = .004 compared to normal marrow), whereas in patients with less advanced MDS (RA, RARS, and RAEB), colony numbers increased in the presence of TRAIL (157% ± 21% of untreated marrow, P = .037 compared to normal). These results suggest complex regulatory mechanisms and reflect the great heterogeneity of MDS. Nevertheless, the data are consistent with a model that proposes that hemopoiesis in less advanced MDS is suppressed by negative signals, presumably generated by clonal precursors,5 and elimination of those cells should result in improved hemopoiesis. Conversely, in advanced MDS, the abnormal precursor pool has expanded and is a major contributor to overall hemopoiesis.34 As a consequence, elimination of those cells should result in a decline in colony formation. An alternative consideration might be that cellular responses to TRAIL signaling differed for different disease stages.
Effect of TRAIL on in vitro hemopoiesis.
(A) In vitro colony formation (CFU-GM) from normal (Normal) and MDS marrow, with all cases combined (All MDS), and less advanced and advanced MDS shown separately. For each group, the left column indicates results without TRAIL exposure, and the right column with TRAIL exposure (mean ± SE). Marrow from 6 healthy donors and 21 patients with MDS, 11 less advanced (RA; RARS, RAEB), and 10 advanced (RAEB-T/tAML; CMML) were studied. (B) Changes in colony formation for each group shown in part A, expressed relative to the respective control (marrow cells not exposed to TRAIL).
Discussion
Increased cellular proliferation, along with exaggerated programmed cell death (apoptosis), is one paradigm that has been used to explain the presence of a cellular or even hypercellular marrow concurrently with peripheral blood cytopenias in patients with MDS.35 Proliferation is likely to be due to dysregulated cytokine expression, while apoptosis could be mediated by either a lack of positive (survival) signals or an overproduction of negative (death) signals.5,8,27,36 Such a pattern could arise with an excess of bifunctional cytokines showing a positive impact on early precursors and mediating negative signals for cells at later stages of differentiation.27 What is striking, however, in patients with MDS is the fact that even though clonally abnormal precursors (with malignant potential) are detectable early in the disease course, they often expand only slowly, and patients may have life expectancies of years without requiring cytotoxic therapy.1 Such a course may be related to slow proliferation or to continuous elimination of clonal precursors that would keep the proportion of clonal cells at low levels.
We have previously shown that one cytokine, TNFα, provides positive signals for early precursors but triggers apoptosis in more differentiated cells.5,27 Here we tested whether the TNF-related molecule, TRAIL, might also be involved in the control of hemopoiesis in MDS. TRAIL exposure resulted in extensive apoptosis in MDS marrow, including the blast cell population. In normal marrow, no increase in apoptosis was observed following TRAIL exposure except for a small subpopulation of CD34+ precursors. These results reflected the distribution of agonistic and decoy receptors in MDS and normal marrow. Differential expression of decoy receptors (TRAIL-R3 and R4) is considered one of the mechanisms that determine sensitivity to TRAIL-induced cell death,15,16 though some reports fail to show a correlation between TRAIL resistance and expression of TRAIL-R3 and -R4 mRNA.11 The current study showed high levels of surface expression of agonistic receptors TRAIL-R1 and -R2 in MDS marrow, and the ratio of surface expression of agonistic receptors to decoy receptors was significantly higher in MDS than in normal marrow. These results were consistent with findings in the established cell lines Jurkat, HL 60, KG-1, and Colo 205 which showed correlations between TRAIL sensitivity and surface expression of agonistic receptors (D. Y. Zang, unpublished observations). Conceivably, the relative ratio of surface expression of agonistic to decoy receptors could serve as an indicator to predict the sensitivity to TRAIL-induced death.
Another mechanism to explain selective killing of tumor cells by TRAIL is the differential expression (or function) of intracellular inhibitors of apoptosis such as FLIP.18 33 Our results show that FLIP mRNA was consistently expressed in marrow from healthy donors. FLIP was also detected in marrow cells from MDS patients but protein levels varied considerably. Although the coexistence of normal and clonal cells in MDS marrow rendered the interpretation difficult, these results suggest the possibility that variations in FLIP expression modify apoptotic responses in addition to the effects related to cell-surface–receptor expression.
Apoptosis in MDS marrow was most prominent in the blast cell population, and a preferential effect on clonal cells was, in principle, supported by the results of cytogenetic and FISH analysis. TRAIL-exposed cells from MDS marrow showed decreased proportions of clonal cells (identified by FISH) in 7 of 9 marrows tested. Such a pattern is also consistent with other reports that describe a selective killing effect of TRAIL on transformed cells.11-13 The fact that a small population of CD34+ precursors from normal marrow was also sensitive to TRAIL-mediated apoptosis does not invalidate such a concept. In fact, those findings are in good agreement with a recent study by Zamai et al who showed TRAIL sensitivity in a population of glycophorin Adim precursors in normal marrow.32 Taken together, the available data suggest a physiologic role for TRAIL at a certain stage of hemopoietic cell differentiation. Furthermore, they may suggest that one factor in MDS marrow leading to increased apoptosis in normal cells is the up-regulation of TRAIL and the increase in apoptotic signals for these susceptible precursors. Further studies are needed.
In agreement with other reports, we also showed an increase in apoptotic cells in the microenvironment of MDS marrow.6,37To define the effect of TRAIL on stroma proper in MDS marrow, we examined cells sorted by STRO-1 expression (STRO+glycophorin−) and, separately, in CD14+ adherent cells before and after culture. Consistent with the pattern of expression of agonistic TRAIL receptors, there was apoptosis in CD14+monocytes in the adherent layer, but not in stromal cells. Such a pattern is in agreement with the notion that stromal elements in MDS marrow are not part of the MDS clone.27
Of note was the observation that following TRAIL exposure, hemopoietic colony formation increased in cases of less advanced MDS, most likely due to the elimination of clonal cells (as shown above) that provide inhibitory signals for normal hemopoiesis.5 27Conversely, in patients with advanced MDS, which is associated with an expansion of CD34+ precursors, exposure to TRAIL reduced colony numbers, presumably because TRAIL sensitive clonal precursors accounted for a progressively increasing proportion of marrow cells.
In summary, there were distinct differences in TRAIL and TRAIL receptor expression between normal and MDS marrow. TRAIL induced significant apoptosis only in MDS, but not in normal marrow, and tended to eliminate cytogenetically indentifiable clonal cells from MDS marrow. These data suggest that TRAIL might play a role in the regulation of hemopoiesis in MDS marrow.
We thank Cassandra Beckham for technical support; Andrew Berger, Michele Black, and Cherie Green for their help with flow cytometric and Kate Rupert for cytogenetic analysis; Beverly Torok-Storb, Shelly Heimfeld, Deborah Banker, Vladimir Lesnikov, and Marina Lesnikova for helpful discussions; Bruce Clurman, Matthew Smitherman, and Jherek Swanger for their help with Western blots; and Bonnie Larson and Helen Crawford for typing the manuscript.
Supported by PHS grants HL36444, CA18029 and CA87948. H.J.D. is also supported by a grant from the Gabrielle Rich Leukemia Fund.
Submitted March 14, 2001; accepted July 6, 2001.
Ray G. Goodwin owns stock in Immunex, which is codeveloping TRAIL/Apo2 ligand with Genentech.
The publication costs of this article were defrayed in part by page charge payment. Therefore, and solely to indicate this fact, this article is hereby marked “advertisement” in accordance with 18 U.S.C. section 1734.
References
Author notes
H. Joachim Deeg, Fred Hutchinson Cancer Research Center, 1100 Fairview Ave N, D1-100, PO Box 19024, Seattle, WA 98109-1024; e-mail: jdeeg@fhcrc.org.


![Fig. 6. Expression of FLIP protein in normal (n = 3) and in MDS marrow (n = 5). / Shown is an original gel (top) and a Western blot for FLIP using marrow cells from 3 healthy donors (1,2,3), 4 marrow (JLP [RA], JAC [RA], GRD [tAML], and FWH [RA]), and one example of peripheral blood cells (PJC [RAEB]) from patients with MDS. MW indicates molecular weight.](https://ash.silverchair-cdn.com/ash/content_public/journal/blood/98/10/10.1182_blood.v98.10.3058/5/m_h82211759006.jpeg?Expires=1764000831&Signature=vhDqjDElJ2-dMDfnYz7Mo8sq-R~qnLPRZUB-3o3gd-NgN0iPn8tWRXkvqvPGQ13rRbmLY1c4FVAUgp2AAsRAmU8Nv3SObKSawJ15BL~uDhDGJ16CNHOhNyKdBAffr4hr-BEi6IGWu8jpTBaBwPF-nhqHYP8H9ZhBP7hfu-rlwMzdKYEjYYYNUwIi6MXmxOkfZi3TRf4gOCjav3715llDfqgVGTuC3MbwU273MsznW3-O~yJDaImFyDAFFR9xV4t~vKkrZYI5NDt~T7NuzoXOtFHDfmA5w~StNIfqybAsGUwLlOqsXZBV6DYKj1BmJeNS6z2jdQghTvR~Uyym6lxY1Q__&Key-Pair-Id=APKAIE5G5CRDK6RD3PGA)

![Fig. 6. Expression of FLIP protein in normal (n = 3) and in MDS marrow (n = 5). / Shown is an original gel (top) and a Western blot for FLIP using marrow cells from 3 healthy donors (1,2,3), 4 marrow (JLP [RA], JAC [RA], GRD [tAML], and FWH [RA]), and one example of peripheral blood cells (PJC [RAEB]) from patients with MDS. MW indicates molecular weight.](https://ash.silverchair-cdn.com/ash/content_public/journal/blood/98/10/10.1182_blood.v98.10.3058/5/m_h82211759006.jpeg?Expires=1764000832&Signature=etlznx-j2jduooIrwyDrQ1w7GoGo-m0pp5x~NvSr9J3Sz64fmhq0FnLOt~kZpUFtDsv6LfmFSxvmiv5Q~dUVKGaQJiwaEJaqkKwB3G7V9ydri6Omf8vNv1OESGFcaPyv1g9x5o3uvIG0cGZnRlqHGeqpPAYWULIq5MVH6MZkyQGRVQD3PWSiAZemXMIERij9TNYAjYYSfjGOayHUL2VblqBN0R2syC2nXEyyfhDRxsvkl2dn9xqgaYtQjX0InrXQsL5DkLWF5S~TUo8thob-gVPuxg6hodb55JILIvjI4WTb6NnoVjh5eKCXUAPII-Z7TT43JmjtBEo5z-7ybio88Q__&Key-Pair-Id=APKAIE5G5CRDK6RD3PGA)
