Hematopoietic stem cells sequentially pass through a series of decision points affecting self-renewal or lineage-specific differentiation. Notch1 receptor is a known modulator of lineage-specific events in hematopoiesis that we assessed in the context of in vivo stem cell kinetics. Using RAG-1−/−mouse stems cells, we documented increased stem cell numbers due to decreased differentiation and enhanced stem cell self-renewal induced by Notch1. Unexpectedly, preferential lymphoid over myeloid lineage commitment was noted when differentiation occurred. Therefore, Notch1 affects 2 decision points in stem cell regulation, favoring self-renewal over differentiation and lymphoid over myeloid lineage outcome. Notch1 offers an attractive target for stem cell manipulation strategies, particularly in the context of immunodeficiency and acquired immunodeficiency syndrome.
Introduction
Hematopoiesis involves highly regulated proliferation and differentiation during which a small number of multipotent stem cells give rise to a large number of more differentiated progeny. The stem cell pool is relatively quiescent and cytokine resistant, whereas the cytokine-responsive progenitor pool is highly proliferative. To prevent the exhaustion of the stem cell compartment, the proliferative activity of hematopoietic stem cells is tightly restricted. The molecular mechanisms, however, regulating the self-renewal and differentiation of hematopoietic stem cells are not well defined.
Members of the Notch family play critical roles in the determination of cell fates and maintenance of differentiation status of cells in many developmental systems (for reviews, see Artavanis-Tsakonas et al,1 Artavanis-Tsakonas et al,2 and Milner and Bigas3). Four mammalian Notch homologs (Notch1-4) have been defined.4-8 The Notch genes encode large, highly conserved type 1 transmembrane glycoprotein receptors composed of a series of iterated structural motifs, including epidermal growth factor (EGF)-like repeats and an intracellular ankyrinlike repeat region that is critical for downstream signaling events.1 Physiologic activation of Notch signaling is initiated by binding of Notch ligands, such as Jagged1, Jagged2 and Delta, that are also transmembrane proteins.9-13 Ligand binding leads to proteolytic cleavage that results in the transport of the intracellular domain of Notch to the nucleus, where Notch behaves as a transcriptional activator.14-16
The Notch human homologue (translocation-associated Notch1) was discovered as the t(7;9) reciprocal translocation associated with T-cell lymphoblastic leukemia.17 This constituted the first evidence of Notch involvement in the hematopoietic compartment and also the first indication of its oncogenic potential. The rearrangement joins portions of Notch1 and T-cell receptor-β (TCR-β), leading to overexpression of truncated polypeptides containing most of the intracellular domain of Notch1. These forms of Notch1, lacking the extracellular domain, also referred to as “activated forms,” have been shown to bind transcription factors and to promote gene expression.18
A number of studies support a broad physiologic role of Notch in the regulation of hematopoiesis. Notch1 is expressed in bone marrow precursor cells19 as well as in peripheral blood T and B lymphocytes, monocytes, and neutrophils,3 whereas Notch ligands are expressed in bone marrow stromal cells, fetal liver, and thymus.20-23 As in other tissues, Notch seems to play 2 distinct roles in the hematopoietic system. Notch participates in cell fate decisions within progenitor populations,24-27 and Notch inhibits the differentiation of hematopoietic progenitors. Transduction by a retrovirus encoding a constitutively activated Notch1 or activation of Notch1 with specific ligands resulted in the inhibition of granulocytic differentiation and preservation of a more immature phenotype in the murine cell line 32D, the human cell line HL-60, and in primary murine and human myeloid progenitor cells.20-22,28-32 Further, Varnum-Finney and colleagues demonstrated that activated Notch1 can result in the in vitro outgrowth of cell lines with multipotential, consistent with an ability to immortalize stem cells.33
To determine whether activation of Notch influences stem cell function, we transduced murine Sca1+lin− bone marrow cells with retroviral vectors expressing constitutively activated Notch1. In vivo experiments using this approach are limited because of the exclusive and rapid development of T-cell leukemias following transplantation of transduced bone marrow cells34 (and S.S., unpublished data, 2000). Therefore, we examined the influence of activated Notch in V(D)J recombination activation gene-1 (RAG1)–deficient bone marrow stem cells. RAG-1–deficient mice have no mature B and T lymphocytes because RAG-1 is essential for V(D)J recombination and lymphocyte development.35 In this study, we demonstrate that Notch1 activation inhibits differentiation of hematopoietic stem cells both in vitro and in vivo, impeding exit from the stem cell and into the progenitor cell pool. The resulting increase in stem cell numbers is further enhanced by increased stem cell self-renewal evident in secondary transplantation studies. Furthermore, activated Notch1 promotes the differentiation of common lymphoid progenitors and early natural killer (NK) and T-progenitor cells in RAG-1−/− hematopoietic stem cells at the expense of myeloid offspring. Therefore, Notch1 activation governs 2 key decision points in stem cell regulation, namely, self-renewal and lineage outcome.
Materials and methods
Cells and cell culture
Mouse bone marrow was obtained from 8- to 12-week old C57BL/6- and C57BL/6 RAG-1−/− mice (Jackson Laboratories, Bar Harbor, ME), euthanized with CO2. Experiments were performed with the permission of the subcommittee on Research Animal Care of the Massachusetts General Hospital. The marrow cell suspensions were flushed from femurs and tibias, filtered through 100-μm mesh nylon cloth (Sefar America, Kansas City, MO), and stored on ice until use. The cells were washed in phosphate-buffered saline (PBS) and stained with Sca1+ microbeads (Miltenyi Biotec, Bergisch-Gladbach, Gemany) and biotinylated lineage antibodies (CD3, CD4, CD8, Gr-1, Mac1, B220 [Caltag, Burlingame, CA] and Ter119 [Pharmingen, San Diego, CA]). A positive selection for Sca1+ cells followed by a negative selection for Sca1+lin− cells using streptavidin microbeads was performed according to the manufacturer's instructions (Miltenyi Biotec).
Human embryonic kidney-derived 293T cells were grown in Dulbecco modified Eagle medium (DMEM) supplemented with 10% fetal calf serum (FCS), 100 U/mL penicillin, 100 U/mL streptomycin, and 2 mMl-glutamine (Gibco, BRL, Rockville, MD).
Retroviral vectors and constructs
Complementary DNAs (cDNAs) encoding a constitutively active form of Notch1 consisting of the intracellular domain (ICN; base pairs 5308-7665) or the intracellular domain with the transmembrane domain (ΔE; base pairs 1-66 fused to 5017-7665) were subcloned into the multicloning site of the retroviral vector MSCV-GFP.36 An internal ribosomal entry site (IRES) between the Notch1 construct and the cDNA encoding enhanced green fluorescent protein (GFP) allows expression by the 5′ long terminal repeat promoter of a single bicistronic messenger RNA (mRNA) encoding both Notch1 and GFP.18,30 34 The control vector contains the IRES and the cDNA encoding the GFP.
Retroviral production and transduction
The MSCV-GFP vectors were cotransfected into 293T cells using a calcium phosphate precipitation method34,37 with pKat, encoding the gag and pol proteins, and pCMV-VSV-G, a plasmid encoding the vesicular stomatitis virus G-glycoprotein (VSV-G).30 Supernatant containing VSV-G pseudotyped retroviruses was collected at 24 and 48 hours after the beginning of transfection and was used for the transduction of murine Sca1+lin− bone marrow cells.
Murine Sca1+lin− cells were cultured in Iscoves modified Dulbecco medium (IMDM) containing 10% FCS (IMDM 10; Sigma, St Louis, MO), penicillin (100 U/mL), streptomycin (100 U/mL), and l-glutamine (2 mM; Gibco, BRL) supplemented with stem cell factor (SCF; 50 ng/mL), Flt-3-ligand (Flt-3-L 50 ng/mL), thrombopoietin (TPO; 25 ng/mL), and interleukin-3 (IL-3; 10 ng/mL) (R & D Systems, Minneapolis, MN) for 36 hours on wells coated with Retronectin (Takara Shuzo, Otsu, Japan). After prestimulation, two thirds of the culture medium was discarded and replaced with the virus-containing supernatant plus Polybrene (final concentration 4 μg/mL; Sigma). A multiplicity of infection (MOI) of about 10 was used. The cells with the viral supernatant were spinoculated at 1700 rpm for 30 minutes, incubated at 37°C and 5% CO2 for an additional 8 hours, then washed and plated on fresh Retronectin-coated wells in IMDM 10 plus cytokines overnight. A second transduction was performed on the following day using the same procedure. Four days after beginning the transduction, GFP+ cells were enriched by fluorescence-activated cell sorting (FACS Vantage, Becton Dickinson, San Jose, CA) and used for in vitro and in vivo experiments.
Colony-forming assay
This assay was used to measure the progenitor cell frequency (colony-forming cell [CFC]) as previously described.38 Murine SCF was used in this study instead of human SCF and cells were plated at only 500 cells/mL.
Long-term culture with limiting dilutions
To quantify the stem cells in the transduced Sca1+lin− population, we adapted the cobblestone area forming cell (CAFC assay)39 with minor modifications as described previously.38 To measure long-term culture (LTC)-initiating cells (LTC-IC) the semisolid, cytokine-containing methylcellulose medium for CFC was overlaid into the wells at week 5 and the colonies were counted at day 10. A limiting dilution analysis software program (Maxrob, kindly provided by Dr Julian Down, Biotransplant, Charlestown, MA) was used to calculate the frequency of LTC-ICs in the cell population.
Competitive repopulation assay
The competitive repopulation assay (CRA) was used to evaluate the repopulation ability of the transduced Sca1+lin− cell population in irradiated recipient mice.40 41 Recipient animals (C57BL/6-Ly5.1, female; Jackson Laboratories) were irradiated with a single dose of 10 Gy 12 to 16 hours before transplantation. The transduced Sca1+lin− donor cells were obtained from 8- to 10-week-old male C57BL/6 RAG-1−/− mice (Jackson Laboratories) and prepared as above. All leukocytes of these mice are Ly5.2+. Congenic competitive bone marrow cells (Ly5.1) were prepared as single-cell suspension from male mice. A mixture of the transduced Sca1+lin− RAG-1−/−cells (2000 or 3400) along with a radioprotective dose of congenic Ly5.1 bone marrow cells (1.5 × 10⁵) were resuspended in Medium 199 and intravenously injected into the lateral tail vein of lethally irradiated Ly5.1 female recipients (n = 5 for each group). The mice were killed at 1.5 (second experiment) and 5 months (first experiment) and bone marrow cells were prepared from those mice and analyzed by flow cytometry.
Serial bone marrow transplantation
Serial bone marrow transplantation was used to evaluate the ability of stem cells to self-renew. The transplanted mice of the CRA were killed at 1.5 (second experiment) and 5 (first experiment) months and the bone marrow was prepared from those mice. New female recipient mice (n = 5/group) were lethally irradiated and transplanted with 4 × 10⁶ mononuclear bone marrow cells of the killed animals by injection in lateral tail veins. Blood from second recipients was analyzed by flow cytometry every 2 weeks.
Flow cytometric analysis
Flow cytometry was used to quantify the hematopoietic cells at different stages in the peripheral blood and the bone marrow of the transplanted animals (CRA). Bone marrow nucleated cells were labeled with the leukocyte antibodies Ly5.1-phycoerythrin (PE) and Ly5.2-biotin (Pharmingen), lineage antibodies (CD3-peridinin chlorophyll protein [PerCP], CD4-PE, B220-PE, Ter119-PE, [Pharmingen]), CD8-Tri, Gr-1-Tri, Mac1-PE (Caltag), stem cell markers (Sca1-Tri and PE, c-kit-Tri [Caltag]), and lymphoid markers (CD19-PE, CD2430F1-biotin, CD25-PE, CD43-PE, BP-1-PE, NK1.1[PK136]-PE, IL-7-R-PE [Pharmingen]). To quantify the enriched stem cell phenotype (Sca1+lin−) in the animals receiving transplants, bone marrow cells were stained with biotinylated lineage antibodies (CD3, Ter119 [Pharmingen], CD4, CD8, B220, Gr-1, and Mac1 [Caltag]) and Sca1-Tri (Caltag). The cells were analyzed after labeling with the secondary antibody streptavidin-allophycocyanin (APC; Becton Dickinson). Intracellular staining of Notch1 was performed by using a saponin permeabilization of the cells after fixing in 1% paraformaldehyde-PBS. The cells were incubated with polyclonal rabbit antibodies against a portion of the intracellular domain of Notch1 (amino acids 1763-1877)23 for 30 minutes at room temperature. Cells were then washed twice and incubated with the monoclonal PE-conjugated goat antirabbit antibody (Sigma; 1 μg/mL).
For the measurement of bromodeoxyuridine (BrdU) incorporation in vivo, mice were injected intraperitoneally with 50 mg/kg BrdU 20 hours prior to bone marrow harvest. The cells were fixed and permeabilized in 2% paraformaldehyde/0.25% saponin PBS and stained with anti-BrdU (Becton Dickinson). The stained cell samples were analyzed on a FACScalibur cytometer (Becton Dickinson).
Statistical analysis
The significance of the difference between groups in the in vitro and in vivo experiments were evaluated by analysis of variance followed by a one-tailed Student t test.
Results
Retroviral expression of activated Notch1 in murine Sca1+lin− bone marrow cells
The cDNAs encoding either the active, intracellular domain of human Notch1 (ICN),30,34 or a form of ICN plus the transmembrane domain (ΔE) with potent transactivating ability,18,34 were cloned into MSCV-GFP, a vector that allows coexpression of subcloned cDNAs and GFP from a single bicistronic mRNA transcript.30
To investigate the effects of Notch1 activation on the differentiation of primitive hematopoietic cells, we used primary Sca1+lin− cells isolated from murine bone marrow. Murine hematopoietic stem cells have been shown to be positive for Sca1 and negative for lineage markers.42
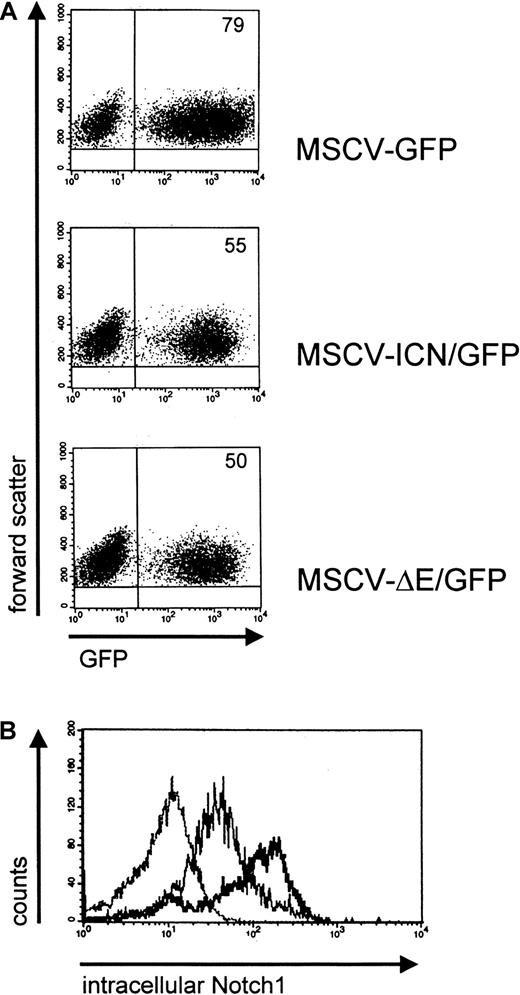
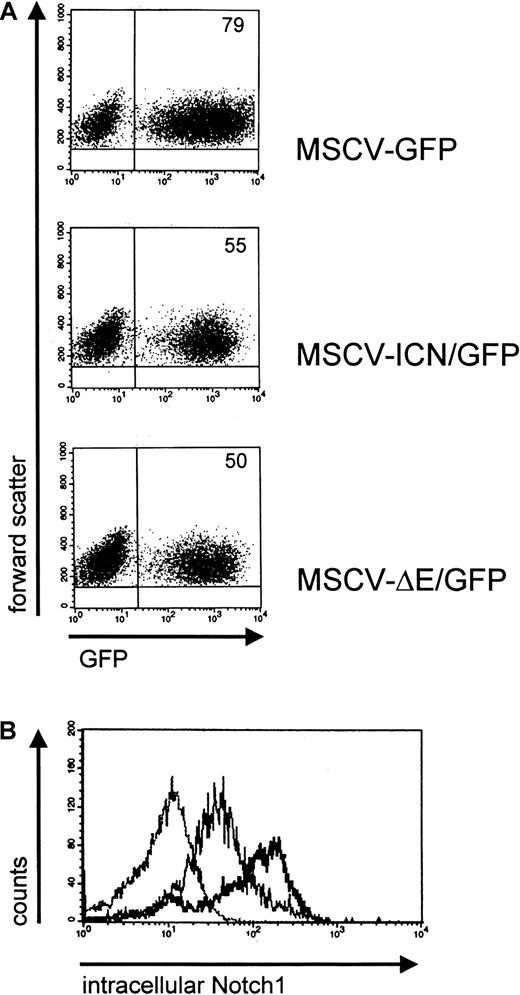
The transduction efficiency of murine bone marrow Sca1+lin− cells by MSCV-ICN/GFP, MSCV-ΔE/GFP, or MSCV-GFP retroviruses was assessed by flow cytometric analysis. Independent experiments showed a transduction efficiency of 50% to 79% for the control vector MSCV-GFP and 35% to 55% for the MSCV-ICN/GFP or MSCV-ΔE/GFP retroviruses 4 days after the beginning of transduction (Figure 1A). At this time, GFP+ cells were enriched by FACS and used for in vitro and in vivo experiments. Intracellular staining of MSCV-ICN/GFP- or MSCV-ΔE/GFP-transduced Sca1+lin− cells with an affinity purified anti-Notch1 antibody confirmed that GFP expression correlated with Notch1 expression (Figure 1B), validating the use of GFP as a surrogate marker for Notch1 expression. Sustained expression of Notch was confirmed by staining with anti-Notch1 antibody at 22 weeks after transplantation.
Transduction of Sca1+lin− bone marrow cells and intracellular Notch1 expression in GFP+Sca1+lin− bone marrow cells.
(A) Flow cytometric analysis for GFP in transduced Sca1+lin− bone marrow cells 4 days after transduction. Plots represent fluorescence intensity for GFP on the x-axis and cell forward scatter on the y-axis. Numbers in corners indicate percent of events in that quadrant. (B) Flow cytometric analysis for intracellular Notch1 protein in GFP+Sca1+lin− bone marrow cells. The polyclonal antibody directed against the intracytoplasmic region of Notch1 was used as described. Histograms are expressed as fluorescence intensity for Notch1 on the x-axis and cell count on the y-axis. Overlaid are fluorograms with anti-Notch1 antibody on MSCV-GFP cells (dotted line), anti-Notch1 on MSCV-ICN/GFP cells (thick solid line), and anti-Notch1 on MSCV-ΔE/GFP cells (thin solid line).
Activated Notch1 in murine RAG-1−/− bone marrow stem cells does not induce T-cell neoplasms
The transplantation of murine bone marrow cells expressing activated Notch1 into lethally irradiated recipients induces exclusively T-cell neoplasms.24,34 We noted that within 3 to 8 weeks all animals (n = 12) receiving transplants with wild-type Sca1+lin− cells (500-3500 cells/animal) expressing activated Notch1 (ICN or ΔE) along with competitive bone marrow cells developed a CD4+CD8+ T-cell leukemia (data not shown). To better evaluate the impact of Notch1 expression in hematopoietic development, we studied the effect of activated Notch1 in RAG-1−/− bone marrow stem cells. In the absence of RAG-1, maturation of T or B cells beyond early antigen receptor rearrangement is prohibited.35 We transplanted RAG-1−/− Sca1+lin− cells expressing activated Notch1 into lethally irradiated C57BL/6 recipients (n = 5) along with competitive bone marrow cells. None of the animals receiving a transplant developed a T-cell leukemia up to 8 months after transplantation. Neither CD3+ nor CD4+ or CD8+ bone marrow cells could be detected in the Ly5.2+ cell population by flow cytometry. The block in the lymphocyte development in Notch1 overexpressing RAG-1−/−stem cells appears to be sufficient to prevent the induction of T-cell leukemias in animals receiving transplants and is consistent with a specific differentiation stage required for Notch1-associated leukemias. These data permitted us to use the RAG-1−/−background to assess the impact of Notch1 activation in the stem cell compartment in vitro and in vivo.
Activated Notch1 inhibits the differentiation of murine RAG-1−/− bone marrow stem cells in vitro
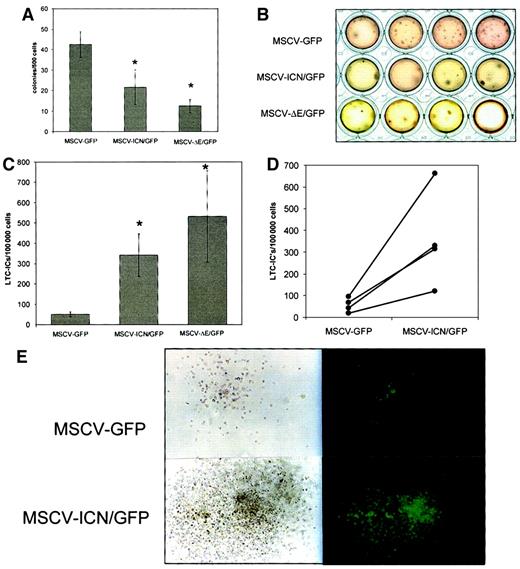
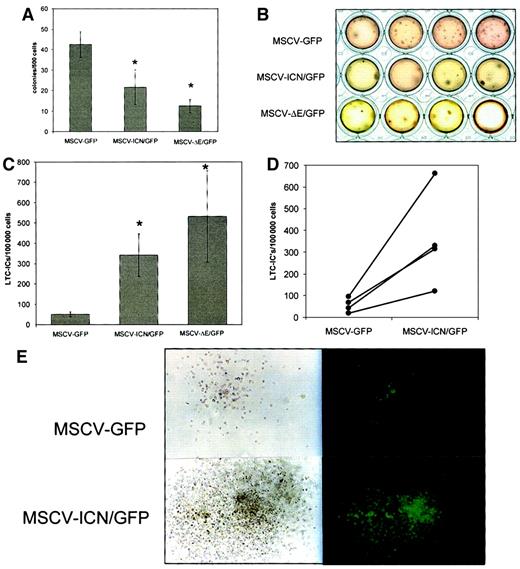
First, we sought to define the impact of Notch1 activation on hematopoietic precursors in an in vitro system. Transduced cells were analyzed for their ability to generate colonies using methylcellulose CFC assays for progenitor function. In 4 independent experiments, Sca1+lin− bone marrow cells from C57BL/6 RAG-1−/− mice transduced with MSCV-ICN/GFP or MSCV-ΔE/GFP showed a significantly lower number of CFCs compared with Sca1+lin− cells transduced with the control vector (Figure 2A). Although the CFCs were reduced in number by cells expressing activated Notch1, the colonies generated had a larger and more homogeneous phenotype resembling high proliferative potential cells (Figure 2B). The lower number of CFCs and the colony morphology suggest, but do not definitely prove, a more primitive cell type consistent with an inhibition of differentiation. The reduction in colony number was more distinct in MSCV-ΔE/GFP–transduced cells than in MSCV-ICN/GFP–transduced cells in comparison to the control vector-transduced cells. The relative potency of ΔE compared with ICN suggests that the degree of effect corresponds to the degree of transactivating ability of the Notch1 construct.
Colony-forming assays and limit dilution LTCs demonstrate an inhibition of differentiation of murine RAG-1−/− and wild-type Sca1+lin− cells by activated Notch1.
(A) Activated Notch1 leads to a significant decrease of total colonies in Notch1 transduced (MSCV-ICN/GFP and MSCV-Δ E/GFP) RAG-1−/− Sca1+lin− bone marrow cells in comparison to control vector (MSCV-GFP) transduced cells in colony-forming assays. Chart shows average of colonies per 500 cells ± SEM of 4 independent experiments. Data were analyzed using the Student t test (n = 4;P = .048 MSCV-ICN/GFP versus control;P = .003 MSCV-ΔE/GFP versus control). (B) Morphology of colonies of transduced RAG-1−/−Sca1+lin− cells in a colony-forming assay. RAG-1−/−Sca1+lin− bone marrow cells expressing activated Notch1 form fewer and bigger colonies (MSCV-ICN/GFP and MSCV-ΔE/GFP) than control vector-transduced cells (MSCV-GFP). (C) RAG-1−/−Sca1+lin− cells transduced with activated Notch1 show a higher LTC-IC frequency in LTCs with limiting dilutions than control vector-transduced cells. Chart shows average of LTC-ICs per 100 000 cells ± SEM generated from 4 to 5 limiting dilutions (n = 3). Data were analyzed using the Student t test (P = .025 MSCV-ICN/GFP versus control;P = .05 MSCV-ΔE/GFP versus control). (D) LTC-IC frequency per 100 000 cells in wild-type Sca1+lin− bone marrow cells expressing activated, Notch1 (MSCV-ICN/GFP) in comparison to control vector-transduced cells (MSCV-GFP; 4 independent experiments, paired t test, P = .03). (E) Single cells picked from LTC-IC colonies were transferred into fresh semisolid medium. In this secondary colony-forming assay, Notch1-transduced cells (MSCV-ICN/GFP) form bigger colonies than control vector-transduced cells (MSCV-GFP). Photos show 2 representative colonies and their fluorescence under UV light.
To more accurately quantify the stem cell frequency in the transduced Sca1+lin− RAG-1−/− cell populations, we performed long-term cultures on primary murine bone marrow stroma using a limiting dilution LTC-IC assay. Sca1+lin− RAG-1−/− cells transduced with MSCV-ICN/GFP or MSCV-ΔE/GFP gave rise to a significantly higher number of LTC-ICs compared with Sca1+lin− RAG-1−/− cells transduced with MSCV-GFP, indicating a higher proportion of stem cells in the Notch1-transduced cell population, which were still able to form colonies after 5 weeks of culture (Figure 2C; P = .025 for MSCV-ICN/GFP versus control and P = .05 for MSCV-ΔE/GFP versus control; n = 3). Like the CFC assay, overexpression of ΔE in Sca1+lin− cells showed a more distinct effect on the stem cell frequency than overexpression of the ICN construct. Thus, Notch1 activation inhibits the differentiation of RAG-1−/− precursor cells as measured by functional assays, preserving hematopoietic cells in a functional stem cell pool.
We next validated that the effect of activated Notch1 on the differentiation of hematopoietic stem cells was not unique to the RAG-1−/− genotype. Notch1-transduced bone marrow Sca1+lin− cells from wild-type C57BL/6 mice were also cultured on murine stroma in long-term cultures with limiting dilutions. Sca1+lin− cells transduced by MSCV-ICN/GFP gave a significantly higher number of LTC-ICs compared with cells transduced with the control vector MSCV-GFP (P = .03, n = 4) (Figure 2D). In 3 independent experiments, single cells from the LTC-IC colonies (n = 5-10) were then isolated by micropipette and cultured in freshly prepared semisolid CFC medium. In this secondary CFC-LTC-IC assay, Notch1-transduced LTC-ICs generated larger colonies than the control vector-transduced LTC-ICs (Figure 2E). Together, these data suggest that stem cell proliferative potential was better preserved by Notch1 activation after long-term culture.
Activated Notch1 increases the stem cell pool in vivo
To assess the correlation of the in vitro phenomena with in vivo stem cell function, we evaluated activated Notch1-expressing cells in repopulation and long-term engraftment experiments. We performed a CRA in which 2000 Notch1-transduced Sca1+lin− bone marrow cells from Ly5.2+ RAG-1−/− mice were transplanted along with a competitive population of 1.5 × 10⁵ mononuclear Ly5.1+ bone marrow cells into lethally irradiated female Ly5.1+ recipients. Monoclonal antibodies recognizing Ly5.2 permit clear distinction among congenic strains of C57BL/6 mice.
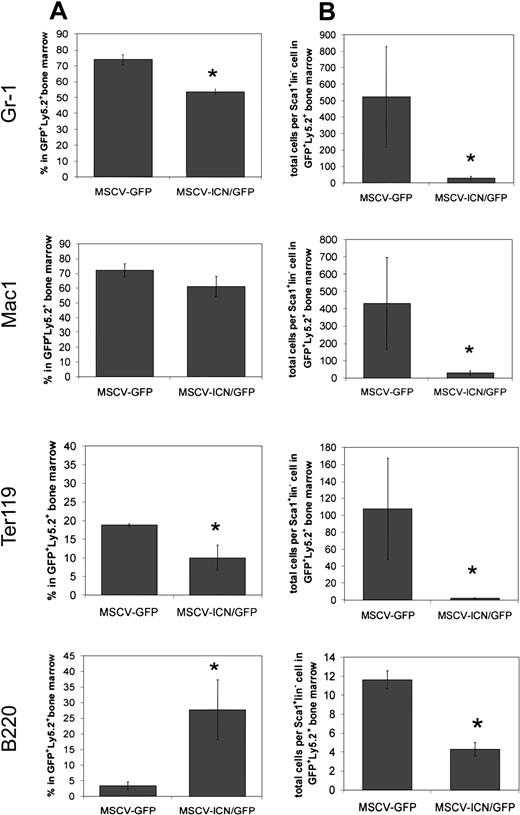
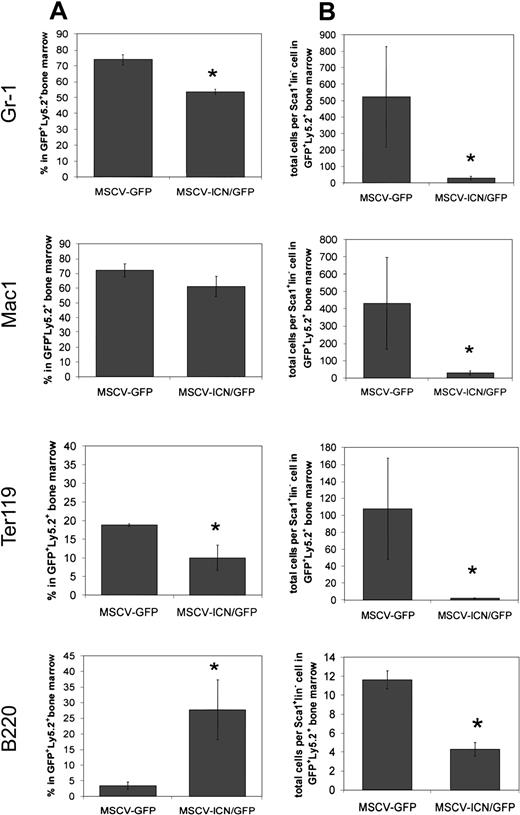
The animals were killed 5 months after transplantation to evaluate the differentiation status of the transplanted cells in the bone marrow. The Ly5.2+ Sca1+lin−cells expressing Notch1 or the control vector differentiated into the myeloid, erythroid, and lymphoid lineage (represented by Gr-1+, Mac1+, Ter119+, and B220+ cells) in the GFP+Ly5.2+ cell population (Figure 3A), indicating the preserved capacity of the transduced cells to produce multiple lineages in vivo. Differentiated granulocytic and erythroid cells were reduced in the animals transplanted with Notch1-transduced Sca1+lin− cells represented by a significantly lower fraction of Gr-1+ and Ter119+ cells in the GFP+Ly5.2+ bone marrow cell population (Gr-1, P = .023; Ter119, P = .03), whereas another myeloid lineage marker (Mac1) appeared less affected.
Altered bone marrow reconstitution by RAG-1−/−Sca1+lin− cells expressing activated Notch1.
Competitive repopulation of lethally irradiated C57BL/6 Ly5.1 mice (n = 5 for each group) transplanted with 2000 RAG-1−/−Sca1+lin−Ly5.2+ bone marrow cells expressing control vector (MSCV-GFP) or activated Notch1 (MSCV-ICN/GFP) along with 1.5 × 10⁵ Ly5.1+ competing bone marrow cells. Bone marrow cells from the animals receiving transplants were harvested 5 months after transplantation and assessed by flow cytometry using antibodies against the indicated antigens. (A) Charts show average ± SEM of the percentage of cells in the GFP+Ly5.2+ subpopulation staining with the indicated antibodies. Data were analyzed using Student ttest (Gr-1, P = .04; Mac1, P = .13; Ter119,P = .03; B220, P = .01). (B) Charts show absolute numbers ± SEM of cells staining with antibodies to the indicated antigens and normalized to the absolute number of GFP+Ly5.2+Sca1+lin−cells. Data are from the same animals shown in panel A. Data were analyzed using the Student t test (Gr-1,P = .02; Mac1, P = .01; Ter119,P = .01; B220, P = .001).
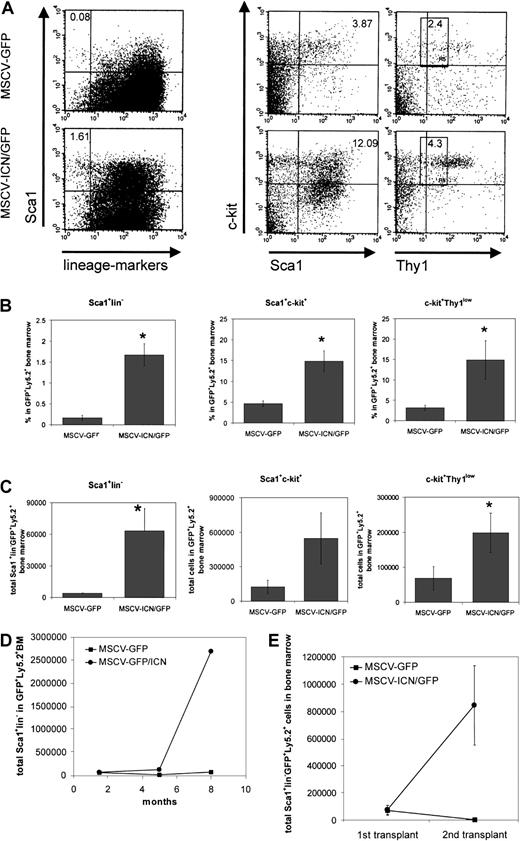
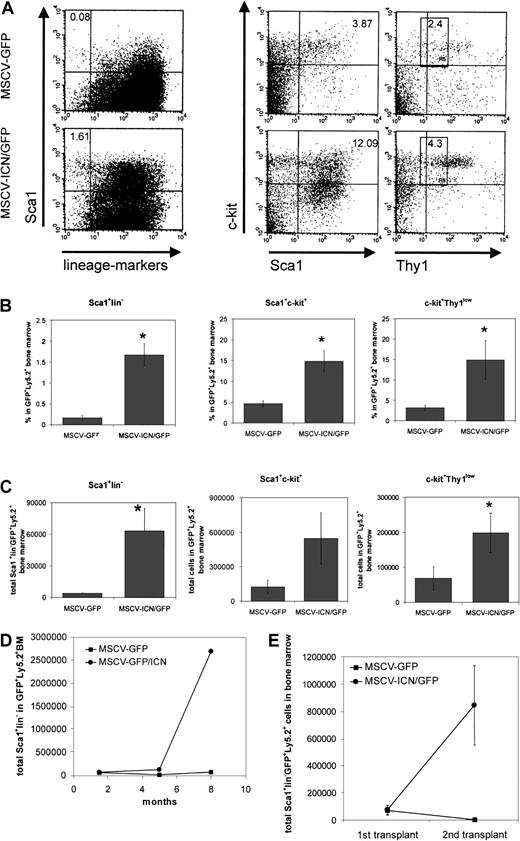
Notably, a significantly higher fraction of Sca1+lin− cells, representing primitive hematopoietic cells, in GFP+Ly5.2+ cells could be detected at 5 months after transplantation in the animals given MSCV-ICN/GFP-expressing cells compared with animals given control vector-expressing cells (Figure 4A,B);P = .002 for MSCV-ICN/GFP versus control). Total Sca1+lin− GFP+Ly5.2+cells in the bone marrow of the transplanted animals were also increased demonstrating a 15-fold increase in Notch1-transduced Sca1+lin− cells compared with controls (P = .03; Figure 4C) and a 30-fold (MSCV-ICN/GFP) versus 2-fold (MSCV-GFP) increase of total Sca1+lin−cells in comparison to the initially transplanted cell number (2000 cells/animal). If animals were permitted to engraft for 8 months, the absolute number of Sca1+lin− cells expressing activated Notch1 increased 30-fold in comparison to controls and 793-fold (MSCV-ICN/GFP) versus 23-fold (MSCV-GFP) in comparison to the initially transplanted cell number (3400 cells/animal; Figure 4D). These data support expansion over preservation of stem cells by activated Notch1. Analysis of the bone marrow cells of competitively repopulated animals for GFP and Ly5.2 in addition to Sca1, c-kit, Thy1, and lin precluded our ability to measure the long-term repopulating cell compartment using concurrent Sca1, c-kit, Thy1, and lineage marker antibodies.43 44 However, the increases in the proportion and absolute numbers of immunophenotypically primitive Sca1+c-kit+ and c-kit+Thy1low cells in the Notch1-transduced bone marrow population provide supportive evidence that the long-term repopulating stem cells were expanded by Notch1 activation (Figure 4A-C).
Activated Notch1 expands primitive RAG-1−/−hematopoietic cells in vivo and enhances the self-renewal of RAG-1−/− hematopoietic stem cells in serial bone marrow transplantation.
Competitive repopulation of C57BL/6 Ly5.1 mice (n = 5 for each group), lethally irradiated and transplanted with 2000 RAG-1−/−Sca1+lin−Ly5.2+bone marrow cells expressing control vector (MSCV-GFP) or activated Notch1 (MSCV-ICN/GFP) along with 1.5 × 10⁵Ly5.1+ competing bone marrow cells. Bone marrow cells were stained 5 months after transplantation. (A) Bone marrow cells were stained for Sca1 and lineage markers (CD3, CD4, CD8, B220, Mac1, Gr-1, and Ter119) or Sca1 and c-kit or c-kit and Thy1. Plots represent fluorescence intensity for the indicated markers on the x-axis and Sca1 or c-kit on the y-axis in the GFP+Ly5.2+ cell population of the bone marrow of 3 representative animals. Numbers in corners represent percent of events within that quadrant or gate. (B) Charts show the average percentage ± SEM of Sca1+lin−, Sca1+c-kit+, or c-kit+Thy1low cells in the GFP+Ly5.2+ bone marrow population. The Student t test was used to analyze the data (Sca1+lin−, P = .002; Sca1+c-kit+, P = .01; c-kit+Thy1low, P = .03). (C) Charts show the average of total Sca1+lin− or Sca1+c-kit+ or c-kit+Thy1low cells ± SEM in the GFP+Ly5.2+ bone marrow of animals receiving transplants. The Student t test was used to analyze the data. (Sca1+lin−, P = .03; Sca1+c-kit+, P = .06; c-kit+Thy1low, P = .05). (D) After 1.5, 5, and 8 months the bone marrow of competitive repopulated animals was analyzed by flow cytometry for Sca1+lin−cells in GFP+Ly5.2+ bone marrow. Chart represents total number of Sca1+lin− cells at different time points. (E) Bone marrow cells of competitive repopulated animals were pooled for each group 6 weeks after transplantation (first transplant; n = 5) containing equal numbers of Sca1+lin−GFP+Ly5.2+cells and again transplanted into lethally irradiated C57BL/6 Ly5.1 mice. The bone marrow was analyzed after a further 5 months by flow cytometry (second transplant; n = 4). Bone marrow cells were stained for Ly5.2, Sca1, and lineage markers (CD3, CD4, CD8, B220, Mac1, Gr-1, and Ter119). Total Sca1+lin− cells, which were also GFP+Ly5.2+, were measured by flow cytometric analysis and total cell count of the bone marrow of competitive repopulated animals of the first and second transplant. Chart shows the average ± SEM of total Sca1+lin−GFP+Ly5.2+cells in the bone marrow.
To evaluate if the stem cell expansion is caused by altered cell cycle kinetics, we measured the BrdU incorporation into Sca1+lin−GFP+ cells in mice transplanted with Notch1-overexpressing or control cells. Twenty hours before, the bone marrow harvest mice were primed with 50 mg/kg BrdU by intraperitoneal injection. Flow cytometric analysis showed no significant differences in the BrdU incorporation into GFP+Sca1+lin− cells expressing activated Notch1 compared with controls (8.01 ± 2.53 MSCV-ICN/GFP versus 3.4 ± 2.2 MSCV-GFP, P = .12). These data suggest an antidifferentiative rather than a proliferative role of activated Notch1 in the expansion of hematopoietic stem cells. This hypothesis is supported by the observation that the expanded stem cell pool does not lead to an expansion of more differentiated descendants as indicated by the reduced proportion and dramatically reduced total number of differentiated myeloid cells per Sca1+lin− stem cell in the bone marrow expressing activated Notch1 (Figure 3B).
Activated Notch1 enhances stem cell self-renewal in vivo
To further define the impact of Notch1 activation on stem cells, we sought to determine if stem cell self-renewal was affected in vivo using sequential bone marrow transplantation. Bone marrow from 5 animals per group transplanted with Notch1-activated Sca1+lin− cells or control cells from RAG-1−/− mice were retransplanted into lethally irradiated recipients 6 weeks after the first transplantation. To measure the self-renewal capacity of the transduced stem cells, we transplanted bone marrow cells containing equal numbers of total Sca1+lin−GFP+Ly5.2+cells. The secondarily transplanted animals were permitted to engraft for 5 months prior to analysis by flow cytometry of the bone marrow. Decrease of Ly5.2+ and Ly5.2+GFP+Sca1+lin−cells in the bone marrow in animals transplanted with control vector-transduced bone marrow cells was consistent with hematopoietic exhaustion. Ly5.2+ cells dropped from 11.04% ± 5.4% in the first transplant to 0.06% ± 0.017% in the second transplant; similarly, Sca1+lin− in the Ly5.2+GFP+ cell population dropped from 2.51% ± 1.23% (total 69 392 ± 36 247 cells) in the first transplant to undetectable in the second transplant. In marked contrast, Ly5.2+ cells and Sca+lin− stem cells expressing activated Notch1 increased dramatically in the bone marrow of the secondary recipients. The Ly5.2+ cells were raised from 3.16% ± 0.96% in the first transplant to 34.5% ± 8.5% in the second transplant. Sca1+lin− cells in the Ly5.2+GFP+ cell population increased from 10.9% ± 6.34% in the first transplant to 24.7% ± 12.5% in the second transplant. Of particular note, the total number of Sca1+lin− cells expressing activated Notch1 increased 11-fold in the secondary recipients in the presence of activated Notch1 in comparison to the first transplant (from 73 402 ± 35 007 to 839 159 ± 292 539; P = .01; Figure 4E). A second experiment transplanting bone marrow into secondary recipients 5 months after the first transplantation confirmed these results as measured by flow cytometric analysis of the peripheral blood 10 weeks after the second transplantation. These data indicate that activated Notch1 is capable of enlarging the stem cell pool in vivo by enhanced self-renewal in serially transplanted animals.
Activated Notch1 enhances early lymphoid lineage differentiation in vivo
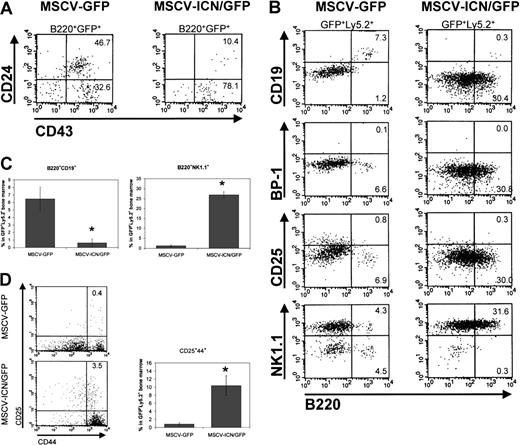
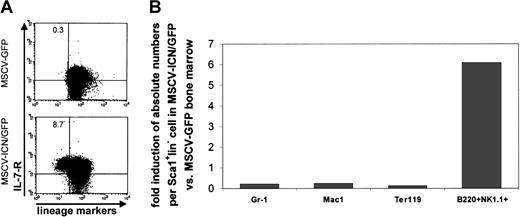
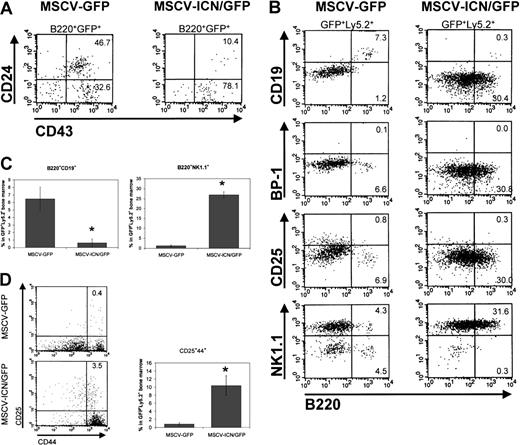
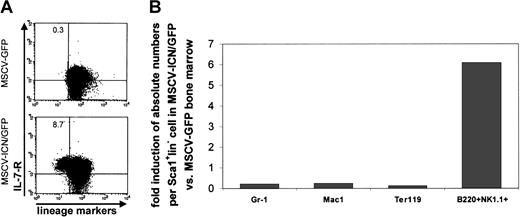
Five months after transplantation, the bone marrow of animals transplanted with Notch1 overexpressing Sca1+lin− RAG-1−/− cells demonstrated a 7-fold higher fraction of B220+ cells in the GFP+Ly5.2+ population (Figure 3A;P = .03 MSCV-ICN/GFP versus control). These cells were CD43+, CD24−, BP-1−, and CD19−, suggesting an early B-cell population as defined by Hardy et al45 as fraction A in their scheme of B-cell development. However, all these B220+CD19−cells expressed NK1.1 but not CD25 defining them as NK progenitor cells as described by Rolink et al46 (Figure5A,B). In contrast, B220+cells in the GFP+Ly5.2+ bone marrow of animals transplanted with control vector-transduced cells were mainly CD19+, defining them as B cells (Figure 5B). These data demonstrate an expansion of an early NK progenitor population (P = .002) and a block in B-cell differentiation (P = .01) by activated Notch1 (Figure 5C). The measurement of in vivo BrdU incorporation into B220+NK1.1+cells expressing activated Notch1 revealed no significant difference compared with controls indicating that the increase in NK progenitors was not due to excess proliferation of that population (4.7% ± 1.2% MSCV-ICN/GFP verus 6.2% MSCV-GFP). In addition, CD25+CD44+ cells representing an immature T-cell population (reviewed in Godfrey and Zlotnik47) were increased 8-fold in the GFP+Ly5.2+ cell population compared with the bone marrow of animals transplanted with control vector overexpressing stem cells (Figure 5D;P = .01 MSCV-ICN/GFP versus control). Further, analysis for an IL-7−R+lin− population in GFP+ cells demonstrated a marked increase in the context of activated Notch1 expression (MSCV-ICN/GFP 8.7% versus MSCV-GFP 0.3%). These cells were mainly c-kit+Sca1+ (MSCV-GFP 64%, MSCV-ICN/GFP 85%) characterizing this population as common lymphoid progenitors as defined by Kondo et al48 (Figure6A).
Activated Notch1 promotes differentiation of early lymphoid precursor cells and blocks B-cell differentiation.
Flow cytometric analysis of the bone marrow of competitive repopulated mice 2 months after transplantation of Sca1+lin− RAG-1−/− cells expressing activated Notch1 (MSCV-ICN/GFP) or control vector (MSCV-GFP). (A) Plots represent fluorescence intensity for CD43 on the x-axis and CD24 on the y-axis in the B220+GFP+cell population of the bone marrow of 2 representative animals. Numbers in corners represent percent of events within that quadrant, gated on GFP+B220+ lymphoid cells. (B) Plots represent fluorescence intensity for B220 on the x-axis and CD19, BP-1, CD25, or NK1.1 on the y-axis in GFP+Ly5.2+ bone marrow cells. Numbers in corners represent percent of events within that quadrant, gated on GFP+Ly5.2+ lymphoid cells. (C) Flow cytometric analysis of the bone marrow of competitive transplanted animals 2 months after transplantation of Sca1+lin− RAG-1−/− cells expressing activated Notch1 or control vector. Chart represents the average percentage ± SEM of B220+CD19+and B220+NK1.1+ bone marrow cells in the GFP+Ly5.2+ population. The Student ttest was used to analyze the data. (B220+CD19+,P = .01; B220+NK1.1+,P = .002). (D) Plots represent fluorescence intensity for CD44 on the x-axis and CD25 on the y-axis in the GFP+Ly5.2+ cell population of the bone marrow of 2 representative competitive repopulated animals 5 months after transplantation. Numbers in corners represent percent of events within that quadrant. Chart shows the average percentage ± SEM of CD25+CD44+ cells in the GFP+Ly5.2+ bone marrow population in primary recipients. The Student t test was used to analyze the data (P = .01).
Activated Notch1 promotes differentiation of the common lymphoid progenitor and favors lymphoid over myeloid lineage in vivo.
(A) Bone marrows of competitively repopulated animals were stained for IL-7R, lineage markers, c-kit, and Sca1, 8 months after transplantation. Plots represent fluorescence intensity for lineage markers on the x-axis and IL-7−R on the y-axis in the GFP+ cell population of the bone marrow of 2 representative animals transplanted with control vector-transduced cells (MSCV-GFP) or cells expressing activated Notch1 (MSCV-ICN/GFP). Numbers in corners represent percent of events within that quadrant. (B) Bone marrow of competitive repopulated animals were stained for differentiation markers (Gr-1, Mac-1, Ter119, and B220) and separately for Sca1 and lineage markers and analyzed by flow cytometry 5 months after transplantation. The absolute number of differentiated cells was then equalized to the absolute number of Sca1+lin− cell in the same animal. Chart shows the fold increase of absolute number of differentiated cells per Sca1+lin− stem cell in the bone marrow of animals transplanted with Notch1 overexpressing cells (MSCV-ICN/GFP) in comparison to controls (MSCV-GFP).
Although the absolute numbers of differentiated cells was diminished in the context of Notch activation, there was a disproportionate decrease in myeloid versus lymphoid cells. The proportion and total number of cells expressing myeloid differentiation markers (Gr-1, Ter119, and Mac-1) were reduced (Figure 3B). The relative decrease was substantially greater for myeloid than lymphoid cells (Figure 6B). These data, coupled with the BrdU data indicating that lymphoid cell numbers are not increased due to excessive proliferation, strongly support preferential lymphoid lineage choice. However, preferential increase in survival time of lymphoid cells cannot be excluded as a potential mechanism to account for the results.
Discussion
Members of the Notch family have been shown to maintain an immature precursor phenotype and affect lineage outcome in a number of developmental and differentiation systems.10,11,49,50 A role for the Notch1 pathway in the regulation of hematopoiesis has been shown by several in vitro studies demonstrating the inhibitory effects of Notch1 on the differentiation of hematopoietic progenitors.20-22 28-32 The data presented here indicate that, like its effect in other developmental systems, Notch1 affects primitive hematopoiesis in 2 ways: increasing stem cell self-renewal and affecting lineage outcome.
The RAG-1−/ − cells expressing activated Notch1 demonstrated enhanced primitive, stem cell numbers as evidenced by increased LTC-IC production and an increased Sca1+lin− cell population in the bone marrow up to 8 months after transplantation. This increase in relative and absolute stem cell number was functionally confirmed in secondary transplants, indicating that the expanded stem cell number in vivo is associated with increased self-renewal. However, increased stem cells also appeared to be at the expense of more mature descendent cells in vivo. Several possible physiologic effects of Notch1 may account for these findings.
The entry of stem cells into the cell cycle is generally thought to result in either self-renewal, apoptosis, or progression down a line of differentiation, entering the progenitor cell pool. The relative balance between these asymmetric events is likely to shift under varying circumstances, for example, during ontogeny as an organism moves from early development, when expansion of the stem cell pool is necessary, to maturation when large numbers of differentiated cells are required. In adulthood, it is less clear, but bone marrow transplantation suggests that self-renewal may be enhanced under specific conditions. Mechanisms modulating the balance between self-renewal versus entrance into a differentiation program are poorly understood and our data raise the possibility that Notch1 may provide one such mechanism. Notch1 activation enhanced self-renewal, increased the stem cell pool, and diminished more mature elements.
These results complement those reported by Varnum-Finney et al33 in which in vitro immortalized clones of multipotent cells were generated by activating Notch1. Differences between these studies include our data demonstrating a population effect, whereas the Varnum-Finney results report clones emerging from a population. Our data also define that expansion of the stem cell pool occurs in vivo and is further manifest as enhanced self-renewal without emergence of a leukemic population. Although Notch1 appears to affect the balance toward a more primitive phenotype, there is not an absolute block in differentiation capability.
The increase in stem cell numbers induced by activated Notch1 appears to be quite distinct from a similar increase noted by other defined molecular regulators of stem cell kinetics. We previously noted that inhibition of p21Cip1 also increased the size of the stem cell pool.38 Yet in the absence of p21Cip1, stem cell self-renewal was diminished and the increased population of stem cells was not at the expense of more mature descendants. The p21Cip1 null genotype was accompanied by near-normal peripheral blood cell populations, reflective of the predominant function of p21Cip1 in restricting cell cycle entry of the stem cell compartment with less profound effects on the kinetics of other populations. In contrast, Notch1 activation, which has been reported to have no effect on overall cell cycle length in hematopoietic progenitors,30 increased stem cell numbers and self-renewal while reducing more mature populations. An additional mechanism for stem cell expansion is altered sensitivity to apoptosis induction as demonstrated in mice overexpressing BCL-2.51Therefore, a similar outcome of increased stem cell numbers may be induced by altering cell cycle (p21Cip1) or apoptosis (BCL-2) or influencing the self-renewal versus differentiation choice (Notch1). Potentially complementary strategies for stem cell expansion are thereby suggested.
In addition to the effect on self-renewal versus differentiation, Notch1 appears to have an impact on the proposed binary lymphoid versus myeloid choice made as primitive cells undertake a differentiation pathway. Prior studies with Notch activation have been limited in evaluating primitive hematopoietic populations in vivo due to the rapid emergence of T cell leukemia24 34 (and S.S., unpublished observations, 2000). The use of stem cells derived from animals engineered to be RAG-1 deficient abrogated development of leukemia. This finding both defined a differentiation stage-specific role of Notch1 in leukemogenesis (post–T-cell receptor rearrangement) and permitted evaluation of events occurring early in lymphoid differentiation.
Our data indicate a previously unassigned activity of Notch1 in early lymphoid lineage commitment, promoting early lymphoid differentiation with an increase in common lymphoid progenitors. Further, the increased fraction of B220+NK1.1+, which were CD19− and CD25− demonstrate an expansion of early NK progenitor cells46 by activated Notch1. The increased fraction of CD25+CD44+ in the bone marrow expressing activated Notch1 suggests an expansion of early T-cell precursors. Although this immunophenotype has been used to define intrathymic T-cell precursors,47 these antigenic markers may reasonably be considered indicative of T-lineage differentiation in bone marrow as well, particularly given the bone marrow–based T-cell differentiation induced by Notch1 previously shown by Pui et al24 and Allman et al.52 The lack of B220+CD19+ cells in the Notch1-transduced bone marrow is consistent with prior reports of B-lineage inhibition by Notch24,33 53 and not necessarily in conflict with the conclusion that Notch can enhance early lymphoid commitment.
The decline in myeloid colonies (CFCs) and granulocytes and erythroid cells we observed is similar to the in vitro data presented by Milner et al.28 Other studies have not noted myeloid effects, but systems were used in which changes in the myeloid system would be difficult to observe (eg, the conditional Notch1 knockout dependent on an interferon promotor53 or the rapid induction of leukemia24). The decrease in myeloid cells we documented, accompanied by the increase in lymphoid precursor cells, is consistent with the hypothesis that lineage choice may be influenced by Notch1 activation favoring lymphoid commitment. The absence of increased BrdU staining in this progenitor population argues against Notch1 expanding already committed lymphoid cells. Rather, the relative reduction in myeloid cells supports an effect of Notch on lineage choice at the lymphoid-myeloid juncture. However, preferential changes in lymphoid survival time over myeloid cell survival cannot be excluded as an alternative explanation for the data. The model that lineage choice is affected is highly consistent with prior studies demonstrating an impact of Notch on other binary differentiation events in hematopoiesis such as αβ versus γδ T-cell, CD4 versus CD8 αβ T-cell or B- versus T-cell determination.24-27
Taken together, our data support a model in which Notch1 functions at multiple levels in the hematopoietic cascade with distinct outcomes dependent on the differentiation stage at which it is activated. In the primitive populations we studied, Notch1 facilitates self-renewal of hematopoietic stem cells by impeding exit from the stem cell pool and influences lineage outcome on a very primitive level, affecting the relative abundance of lymphoid populations. Analyzing the molecular accompaniments of Notch1 functional activity may provide insight into determinants of stem cell self-renewal and lineage commitment and will be of considerable interest. It should be noted, however, that the data presented here are obtained from an overexpression system and require verification using more physiologic mechanisms of Notch1 activation. The use of Notch ligands to increase stem cell expansion and favor subsequent lymphoid differentiation has substantial appeal in transplantation strategies and in the context of human immunodeficiency virus disease. Controlled manipulation of the activities defined here may provide ex vivo approaches to increase stem cells and cells moving toward T-lineage maturation, highly desirable events to advance immune reconstitution after bone marrow transplantation or in the setting of acquired immunodeficiency syndrome.
The authors gratefully acknowledge the contributions of Dr Fred Preffer for flow cytometric expertise, Dr Jon Aster in reagents and careful reading of the manuscript, and Dr Ken Cohen for careful manuscript review.
Supported by National Institutes of Health grants HL45851, DK50234 (to D.T.S.), DK02761 (to T.C.), Defense Advanced Research Projects Agency (DARPA) (to D.T.S.), the Deutscher Akademischer Austauschdienst (to S.S.), Partners Investigator/Nesson Award (to N.C.), and the Richard Saltonstall Charitable Foundation (to D.T.S).
The publication costs of this article were defrayed in part by page charge payment. Therefore, and solely to indicate this fact, this article is hereby marked “advertisement” in accordance with 18 U.S.C. section 1734.
References
Author notes
David T. Scadden, Massachusetts General Hospital, 149 13th St, Rm 5212D, Boston, MA 02129; e-mail:scadden.david@mgh.harvard.edu.

