Abstract
Chemokines are important mediators of cell trafficking during immune inductive and effector activities, and dysregulation of their expression might contribute to the pathogenesis of human immunodeficiency virus type 1 and the related simian immunodeficiency virus (SIV). To understand better the effects of SIV infection on lymphoid tissues in rhesus macaques, we examined chemokine messenger RNA (mRNA) expression patterns by using DNA filter array hybridization. Of the 34 chemokines examined, the interferon γ (IFN-γ)–inducible chemokine CXC chemokine ligand 9/monokine induced by interferon-γ (CXCL9/Mig) was one of the most highly up-regulated chemokines in rhesus macaque spleen tissue early after infection with pathogenic SIV. The relative levels of expression of CXCL9/Mig mRNA in spleen and lymph nodes were significantly increased after infection with SIV in both quantitative image capture and analysis and real-time reverse transcriptase–polymerase chain reaction assays. In addition, in situ hybridization for CXCL9/Mig mRNA revealed that the patterns of expression were altered after SIV infection. Associated with the increased expression of CXCL9/Mig were increased numbers of IFN-γ mRNA–positive cells in tissues and reduced percentages of CXC chemokine receptor (CXCR) 3+/CD3+ and CXCR3+/CD8+ lymphocytes in peripheral blood. We propose that SIV replication in vivo initiates IFN-γ–driven positive-feedback loops in lymphoid tissues that disrupt the trafficking of effector T lymphocytes and lead to chronic local inflammation, thereby contributing to immunopathogenesis.
Introduction
The ultimate consequences of the immune destructive effects of human immunodeficiency virus 1 (HIV-1) are well described,1 but the precise mechanisms by which immune function is progressively lost during the course of infection remain incompletely understood. To develop new strategies for combating the pathogenic effects of HIV-1 infection, it is crucial to obtain a better understanding of the effects of the virus on local lymphoid tissues in vivo. Central to immune inductive and effector activities is the trafficking of antigen-presenting cells (APCs), naı̈ve T and B lymphocytes, and effector lymphocytes.2 Among the components critical for cellular trafficking events required for appropriate induction of immune responses are chemokines, which are small (8-10 kd) cytokines chemotactic for cells bearing the appropriate G-protein–coupled receptor.3 This idea has been underscored through studies of antigen-presenting dendritic cells (DCs) showing that during DC maturation, a switch in chemokine receptor expression from CC chemokine receptor (CCR) 6 to CCR7 occurs concordant with a change in chemotactic responsiveness of the DCs from CC chemokine ligand (CCL) 20/macrophage inflammatory protein (MIP)-3α, a potent attractant for Langerhans cell precursors, to CCL21/6Ckine and CCL19/MIP3-β, which are expressed in secondary lymphoid tissues.4 These latter 2 chemokines represent a functional group involved in constitutive, homeostatic immune trafficking events. A second functional group is involved in inflammatory processes, and increased and sustained levels of expression of members of this group of chemokines have been associated with several chronic inflammatory diseases.5 Dysregulation of expression of either class of chemokine could contribute to the functional and pathological outcomes comprising acquired immunodeficiency syndrome (AIDS).
To determine whether levels of chemokine expression change during the course of pathogenic simian immunodeficiency virus (SIV) infection, we used DNA array hybridization to quantitate the relative expression levels of 34 chemokine messenger RNAs (mRNAs) in spleen tissues during different stages of disease. The most highly induced chemokine was the inflammatory chemokine CXC chemokine ligand 9/monokine induced by interferon-γ (CXCL9/Mig). After cloning rhesus CXCL9/Mig complementary DNA (cDNA), we used in situ hybridization (ISH) followed by quantitative image capture and analysis and real-time reverse transcriptase–polymerase chain reaction (RT-PCR) to define the patterns and levels of expression of CXCL9/Mig mRNA in macaque lymphoid tissues. We propose that increased levels of expression of CXCL9/Mig play an important role in SIV-associated immunopathogenesis as a result of the inflammatory recruitment of CXC chemokine receptor (CXCR)3+ T lymphocytes to secondary lymphoid tissues through interferon γ (IFN-γ)–driven positive-feedback loops.
Methods
Macaques and tissues
The studies were done with the approval of the University of Pittsburgh Institutional Animal Care and Use Committee and included 15 adult rhesus macaques (Macaca mulatta) negative for SIV, simian retrovirus (type D), and simian T-lymphotropic viruses 1, 2, and 3. Eight macaques were inoculated intravenously with 1 mL of a 5 × 10⁻⁴ dilution of a cryopreserved stock of the SIV/ΔB670 primary isolate,6 which was equivalent to 5 median tissue culture infectious doses. Four macaques (M5299, M5499, M5599, and M5699) were killed 2 weeks after infection (PI), but the infection had disseminated in only 3. The 4 remaining macaques were reinoculated with 1 mL of a 1:5 dilution of virus 1 week after the first inoculation to ensure infection and were killed on progression to AIDS. Four macaques (M0999, M5899, M5999, and M6299) were inoculated with the higher dose and killed 2 weeks PI for control purposes. M9597 was a long-term nonprogressor (LTNP) inoculated intravenously with bacille Calmette-Guérin 304 weeks after SIV/ΔB670 infection and killed 80 weeks later as described previously.7Transcardial perfusion with 0.9% saline was done at necropsy to remove contaminating blood cells from tissues. Tissues were fixed in fresh 4% paraformaldehyde and phosphate-buffered saline and processed as described previously.8 9
DNA array hybridization and analyses
Total RNAs were extracted from snap-frozen spleen tissue homogenized in Trizol (Life Technologies, Carlsbad, CA). Equivalent masses of total RNA were combined from individual macaques to generate pools of RNA from animals with the same disease states. Synthesis of cDNA probes and hybridization to human cytokine filter arrays were done according to the manufacturer's recommendations (R&D Systems, Minneapolis, MN). Washed filters were exposed to a phosphorimager screen (BAS-SR; Fuji, Stamford, CT) for 5 to 7 days. High-resolution TIFF file images were analyzed by using Imagene software (version 4.1; Biodiscovery, Los Angeles, CA). The mean signal intensity per pixel for each spot was measured and the mean signal intensity for local background was subtracted to obtain the signal per spot. These values were then normalized for each filter by dividing the signal-intensity value for each spot by the mean signal intensity per pixel for 9 housekeeping genes on the filter.
RT-PCR, subcloning, and sequencing of rhesus macaque CXCL9/Mig
Rhesus macaque CXCL9/Mig partial cDNA was obtained by RT-PCR amplification of macaque lung total RNA with primers TRMigF (5′-ATGAAGAAAAGTGGTGTTCTT-3′) and TRMigR (5′-AAGTGGTCTCTTATGTAGTCTT-3′). PCR products were ligated to the pGEM-T vector (Promega, Madison, WI) and the DNA was sequenced (GenBank accession number AY044445). Comparison of the deduced amino acid sequences of the rhesus macaque and human CXCL9/Mig cDNAs showed 92.8% identity.
In situ hybridization
ISHs were done as described previously,8,9 except that tissue pretreatments consisted of microwaving in 0.01 M citrate buffer (pH 6.0) followed by acetylation in 0.25% acetic anhydride and 0.1 M triethanolamine and hybridization was done at 50°C. ISHs simultaneously using sulfur 35 (35S)–labeled and digoxigenin 11-uridine triphosphate–labeled probes were done identically, except that all dithiothreitol (DTT) concentrations were 10 mM. Sections were then rinsed for 2 minutes in Tris-buffered saline (TBS; 0.1 M Tris [pH 7.5]) and blocked overnight at 4°C in TBS, 3% blocking agent (Roche, Indianapolis, IN), and 3% nonfat dry milk. Digoxigenin-labeled riboprobe was detected with an antidigoxigenin antibody conjugated to alkaline phosphatase (1:500; 4-hour incubation; Roche) according to the manufacturer's recommendations. After incubation with 5-bromo-4-chloro-3-indolylphosphate and nitroblue tetrazolium for 4 hours, sections were rinsed in TBS, dehydrated, air dried, and subjected to emulsion autoradiography with exposure times of 1 to 2 days. Simultaneous immunohistochemical staining and ISHs were done as described previously,8 9 except that all DTT concentrations were reduced to 10 mM.
Quantitative image analysis
ISH signals for CXCL9/Mig were quantitated by using a quantitative image capture and analysis system as described previously.8 The system employed a SPOT digital camera (Diagnostic Instruments, Sterling Heights, MI) mounted on a Nikon E600 microscope fitted with a 20× Plan Apochromat objective and an IGS polarizing filter cube (Omega Optical, Brattleboro, VT). Images were captured and analyzed with Metaview software (Universal Imaging, West Chester, PA).
Real-time RT-PCR 5′ fluorogenic nuclease assay
Real-time RT-PCR was done with a 2-step protocol as described previously.10 Total RNAs were obtained from snap-frozen tissue specimens by using Trizol, treated with deoxyribonuclease (Ambion, Dallas, TX), and purified with RNeasy columns (Qiagen, Valencia, CA). For each specimen, 400 ng and 100 ng RNA were separately reverse transcribed by using random hexamers and Superscript II RT (Life Technologies) in a 100-μL reaction. RT-negative controls were obtained with 400 ng of each RNA. PCR amplification used 5 μL of each cDNA at empirically determined optimal concentrations of forward and reverse primers and 6-carboxyfluorescein (FAM)–labeled Taqman probe. The following primer and probe concentrations were used for amplification and detection of specific mRNAs. CXCL9/Mig mRNA primers were used at 300 nM each and FAM/6-carboxy-N,N,N′, N′-tetramethylrhodamine (TAMRA)–labeled probe was used at 200 nM; β-glucuronidase (β-GUS) primers and FAM/TAMRA-labeled probe were all used at 100 nM each; and IFN-γ primers were used at 200 nM and FAM/TAMRA-labeled probe was used at 100 nM. The PCR reactions were cycled at 95°C for 12 minutes followed by 40 cycles at 95°C for 15 seconds and at 60°C for 1 minute on an ABI Prism 7700 Sequence Detection System (PE Applied Biosystems, Foster City, CA).
The CXCL9/Mig and IFN-γ primers and probe were designed by using Primer Express software (PE Applied Biosystems) and contained the following sequences: SSRhMigF2 (5′-CAGATTCAGCAGATGTGAAGGAA-3′), SSRhMigR2 (5′-ACGTTGAGATTTTCTAACTTTCAGAACTT-3′), SSRhMigF2R2Pr (5′-FAM-CAGCCAAAAGAAAAAGCAAAAGAATGG-TAMRA-3′), SSRhINFgF3 (5′-CAGCTCTGCATTGTTTTGG-3′), SSRhINFgR3 (5′-ATCTGGATCACCTGCATTAAAATATTT-3′), and SSRhINFgF3R3Pr (5′-FAM-CTTGGCTGTTACTGCCAGGACCCATATGTAA-TAMRA-3′). The primer and probe sequences for β-GUS were identical to those previously described.10
Relative quantitation of CXCL9/Mig mRNA expression levels was calculated by using the comparative CTmethod,10,11 with the ΔCT value from macaque M6600 used as the calibrator for the spleen analyses and the ΔCT value from M5600 as the calibrator for the lymph node analyses. Because this calculation assumes 100% PCR efficiency, PCR efficiencies were measured as described previously11 and were 99.5% for CXCL9/Mig, 100% for IFN-γ, and 100% for β-GUS (data not shown).
Determinations of plasma viral load
Virion-associated RNA in plasma was measured by using Taqman real-time RT-PCR with an external standard curve.57
Statistical analyses
All statistical analyses were done with Minitab software (State College, PA). Data from the Mig ISH experiments were analyzed by repeated measures analysis of variance (ANOVA). Data from the IFN-γ ISH and the CXCR3 flow cytometry experiments were analyzed by using a nonparametric equivalent to a one-way ANOVA (Kruskal-Wallis test) when comparisons were made between groups of different macaques. For analysis of changes in CXCR3 expression levels at different times PI in the same group of macaques, data were checked for the normality of the paired differences and a paired t test was then performed. Reported P values were not adjusted for multiple comparisons. Real-time RT-PCR data were analyzed by using at test.
Results
Array hybridization identifies CXCL9/Mig up-regulation in spleen
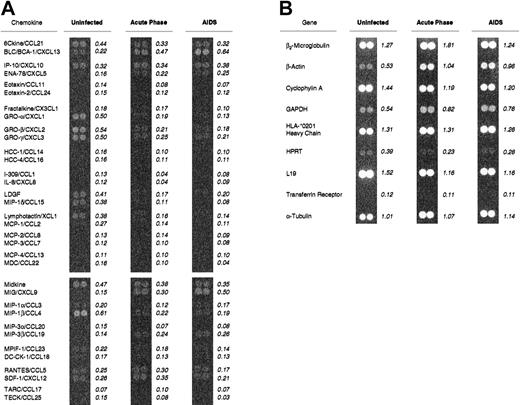
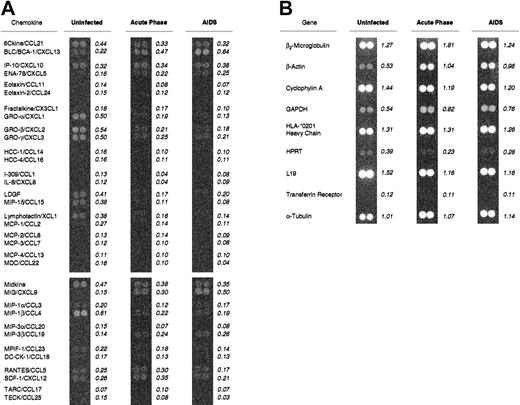
To examine patterns of expression of chemokine mRNA in lymphoid tissues of rhesus macaques infected with SIV, we obtained spleen tissues from macaques infected with the pathogenic SIV/ΔB670 isolate6 and determined chemokine mRNA expression levels by using DNA filter array hybridization. The macaques included in these studies represented different stages of SIV-associated disease, ranging from acute infection to AIDS (Table 1). We extracted total RNAs from snap-frozen specimens, pooled them by disease state, generated phosphorus 33 (33P)–labeled cDNA probes, and hybridized them to commercially available DNA filter arrays (Figure 1). The signal-intensity values represented the mean of the intensity values for the duplicate spots for each gene after subtraction of local background and normalization against the mean of the intensity values of the 9 housekeeping genes (Figure 1B) on each filter. The relative levels of expression of the chemokine mRNAs are listed in Table 2 in the order of greatest to least signal intensity for the AIDS pool. Ratios of 2.0 or greater that included at least one normalized value greater than 0.2 are noted.
DNA array hybridization determination of chemokine mRNA expression levels in rhesus macaque spleen tissues during SIV infection.
Total RNAs were purified from snap-frozen spleen samples obtained at necropsy and pooled according to disease state. Complementary DNA labeled with 33P–deoxycytidine triphosphate and reverse transcribed from each pool was hybridized to the human cytokine arrays, washed, and exposed to a high-resolution phosphorimaging screen. (A) The indicated values for each chemokine mRNA represent the mean signal intensity per pixel for the duplicate spots, after subtraction of local background and normalization against the mean signal intensity per pixel for 9 housekeeping genes (B). The uninfected pool included macaques M5600 and M6600; the acute-infection pool included M5499, M5699, M0999, M5899, and M5999; and the AIDS pool included M1799 and M5199. The new nomenclature for chemokines3 is shown here as the second part of each name.
Of the 34 chemokine mRNAs examined, 21 had relatively constant levels of expression throughout infection (ratios, 0.5 to 1.9), including 6Ckine/CCL21, which is involved in the recruitment of mature or maturing DCs4 and naı̈ve and central memory T lymphocytes.12 Eleven chemokine mRNAs, including MIP-1β/CCL4, had lower levels of expression (ratios ≤ 0.5) in spleen tissue during AIDS than in spleens of uninfected animals (Table2). Interestingly, the analyses revealed that CXCL9/Mig and CXCL13/B-lymphocyte chemoattractant (BLC) mRNAs were the most highly up-regulated chemokine mRNAs in spleens of macaques with AIDS compared with spleens of uninfected animals (Table 2). These chemokines are fundamentally different in that CXCL9/Mig is induced by IFN-γ13 and recruits CXCR3+ T-helper (Th) 1 and T-cytotoxic 1 cells,14 whereas BLC/B-cell attracting 1/CXCL13 is constitutively expressed and recruits CXCR5+ B and T lymphocytes and DCs to germinal centers.15-17Although signal intensities of approximately half of the chemokine mRNAs were at or below the limits of sensitivity of the assay (Table2), this was not due to nucleotide-sequence heterogeneity between the rhesus macaque and human genes, since we have cloned and sequenced more than 10 of these rhesus macaque cDNAs and all are more than 90% homologous to their human counterparts (data not shown).
SIV infection alters CXCL9/Mig expression patterns and levels in macaque lymphoid tissues
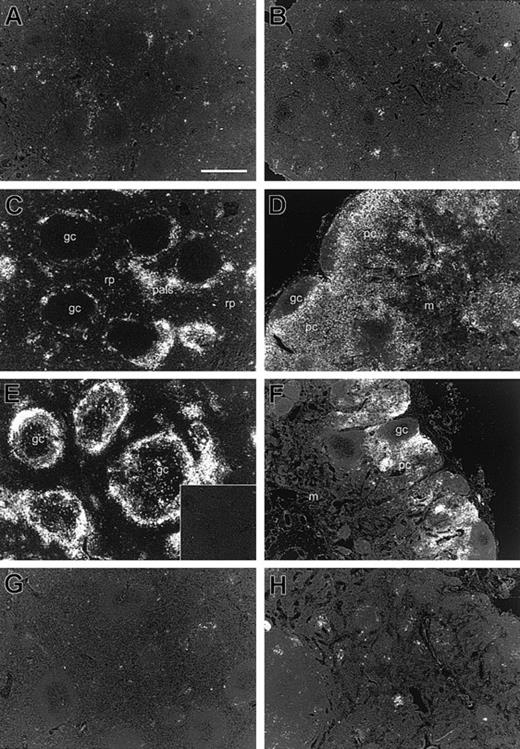
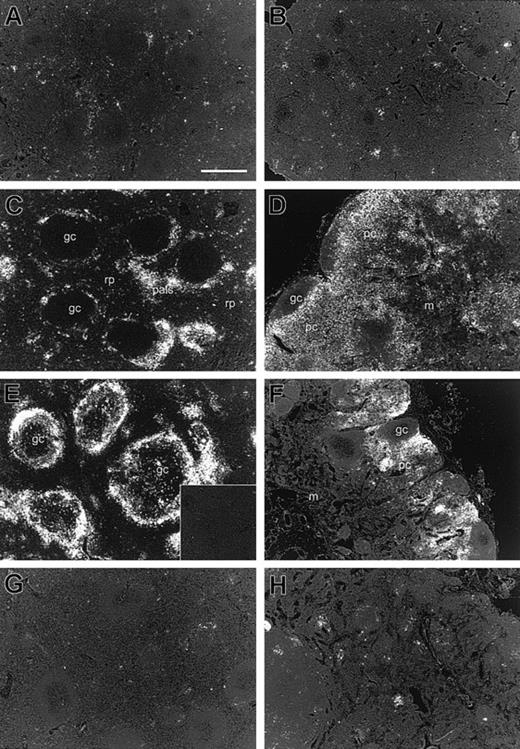
We next focused our analyses on expression of CXCL9/Mig mRNA because CXCL9/Mig is an inflammatory chemokine that is induced by the type 1 cytokine IFN-γ13 and because increases in its expression have been observed in chronic inflammatory diseases.5 We examined the expression patterns of CXCL9/Mig in greater detail directly in tissues from individual macaques. ISH with a 35S-labeled rhesus macaque CXCL9/Mig-specific riboprobe confirmed that the levels of expression of CXCL9/Mig mRNA were much lower in spleen and lymph node tissues from uninfected macaques (Figures 2A and 2B) than in tissues from macaques with acute infections (Figures 2C and 2D) or AIDS (Figures 2E and 2F). In spleens of uninfected macaques, rare CXCL9/Mig mRNA-positive (mRNA+) cells were predominantly in the macrophage-rich red pulp. Such cells were also present during acute infection, but there was also a dramatic increase in the ISH signals in the periarteriolar lymphoid sheaths in the white pulp (Figure 2C). In animals with AIDS, the pattern of expression changed further, to include cells in germinal centers and marginal zones (Figure 2E). In lymph nodes, increased levels of expression of CXCL9/Mig during acute infection and AIDS were observed in T-lymphocyte–rich paracortical regions, with some increased expression in medullary regions (Figures2D and 2F).
ISH characterization of CXCL9/Mig mRNA in rhesus macaque lymphoid tissues during SIV infection.
Tissue sections from spleens (A, C, E, and G) and axillary lymph nodes (B, D, F, and H) were hybridized in situ with a35S-labeled, CXCL9/Mig-specific riboprobe, which was revealed by emulsion autoradiography after an exposure time of 7 days. (A,B) Macaque M5600 (uninfected), (C,D) macaque M5999 (acute infection), (E,F) macaque M6199 (AIDS), and (G,H) macaque M9597 (LTNP). The bar in panel A is equivalent to 500 μm. The inset in panel E represents ISH to a spleen tissue section from M6199 with a control sense riboprobe, shown at the same magnification. All images were captured as bright-field images, converted to grayscale, and then inverted to show the silver grains as bright white; gc indicates germinal center; rp, red pulp; pals, periarteriolar lymphoid sheath; pc, paracortex; and m, medulla. Original magnifications, × 100.
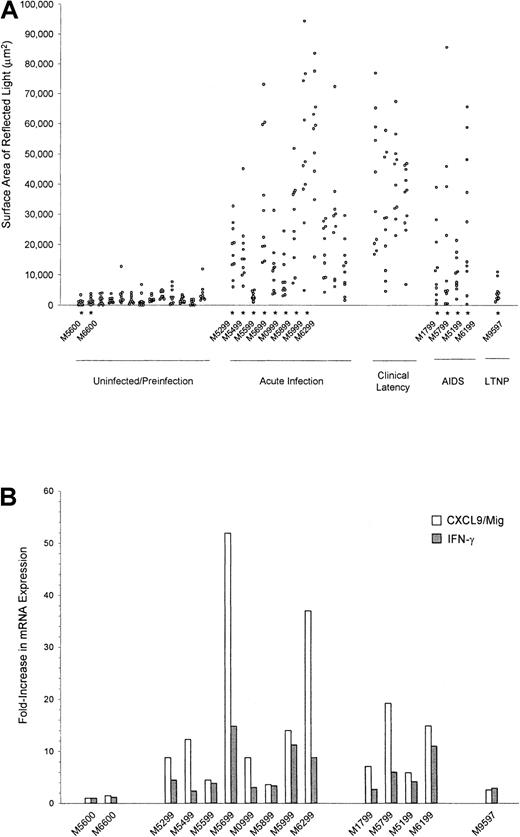
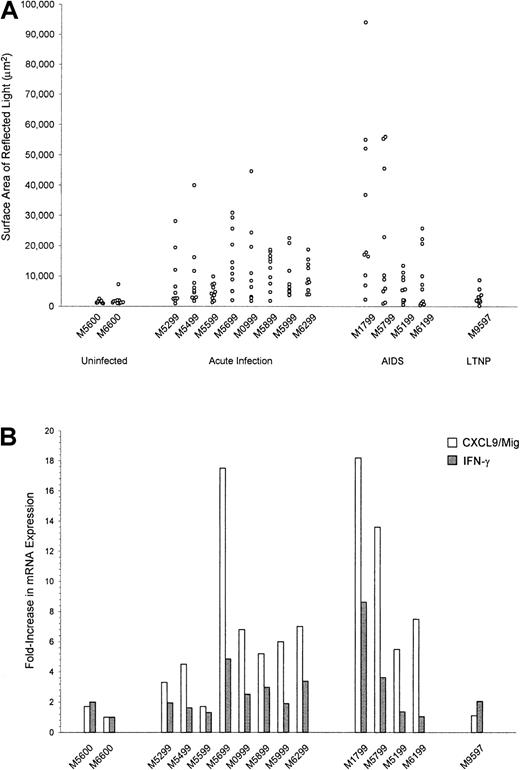
We quantitated the ISH signals for CXCL9/Mig mRNA by using image capture and analysis,8 whereby the surface area of epipolarized light reflected by silver grains can be thresholded and measured. Ten randomly chosen microscopical fields were examined from each tissue section hybridized with the antisense riboprobe and are presented in Figure 3A as background-corrected individual data points. The signals obtained after ISH to uninfected macaque spleen tissues with the CXCL9/Mig riboprobe were extremely low (mean surface area of reflected light, 1773 μm2; Figure 3A), whereas the ISH signals for CXCL9/Mig mRNA in spleen tissues from animals with acute infection or AIDS were significantly higher (P = .005 and P < .001, respectively; mean values, 10 251 μm2 and 16 800 μm,2 respectively; Figure 3A). To further assess the differences in expression of CXCL9/Mig mRNA, we developed a real-time RT-PCR assay specific for CXCL9/Mig. Using this approach, we found that the levels of CXCL9/Mig mRNA expression were also significantly higher during acute infection and AIDS (P = .02 andP = .044, respectively; mean increases, 6.5 and 11.2 fold, respectively, over values in the uninfected macaque used for calibration [M6600]; Figure 3B).
Quantitation of CXCL9/Mig mRNA expression in spleen tissues from rhesus macaques by image capture and analysis and real-time RT-PCR.
(A) Quantitative image capture and analysis was used to determine the signal intensities after ISH for CXCL9/Mig mRNA in spleen tissue sections from rhesus macaques that were either uninfected or had the indicated stage of SIV disease. Each data point represents the surface area of reflected light determined for an individual 20 × microscopic field from the same tissue section after subtraction of the surface area of reflected light determined for a tissue section hybridized in parallel with the corresponding sense control probe. The values in each vertical collection of data points are from an individual animal. The differences in CXCL9/Mig expression were significant for both the acute infection (P = .005) and AIDS (P < .001) spleen measurements compared with uninfected spleen measurements. (B) Real-time RT-PCR was used to determine the relative levels of expression of CXCL9/Mig and IFN-γ mRNA in snap-frozen spleen tissue specimens, normalized against an endogenous control, β-GUS. The data were further normalized by using values from an uninfected macaque (M6600) for calibration.
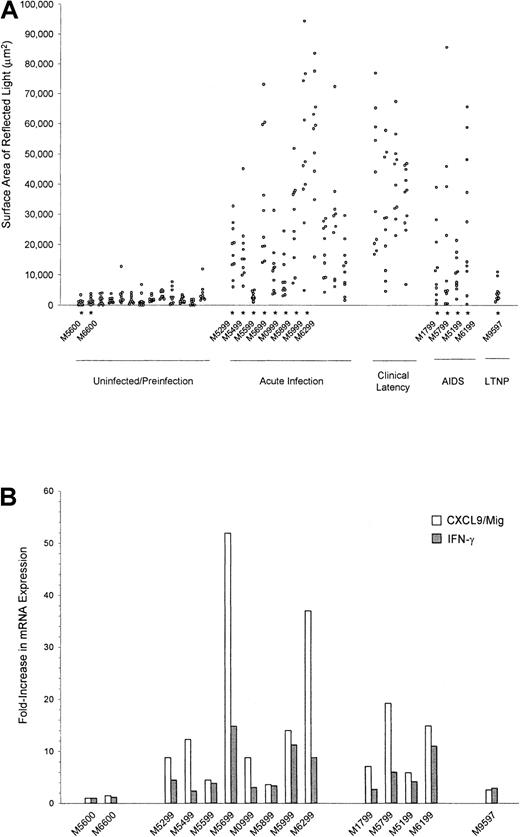
Lymph node specimens were obtained from macaques before infection with SIV/ΔB670, 2 weeks PI, 10 to 17 weeks PI, and at necropsy. The ISH signal intensities for CXCL9/Mig mRNA were universally low in lymph nodes obtained from animals without SIV infection (Figure4A). In contrast, lymph nodes obtained 2 weeks PI through AIDS development had significantly higher levels of expression of CXCL9/Mig mRNA (P < .001 for all groups, including acute infection, clinical latency, and AIDS; Figure 4A). Furthermore, the levels of expression of CXCL9/Mig mRNA in the spleen and lymph node tissues from an LTNP macaque (M9597) were low (Figures3A and 4A). Real-time RT-PCR analysis of lymph node total RNA preparations from necropsy specimens (Figure 4B) also showed significantly increased expression of CXCL9/Mig mRNA during acute infection (P = .032) and AIDS (P = .046).
Quantitation of CXCL9/Mig mRNA in lymph node tissues from rhesus macaques by image capture and analysis and real-time RT-PCR.
Quantitative image capture and analysis (A) and real-time RT-PCR (B) were used to determine CXCL9/Mig expression levels in lymph node specimens, as described in the legend for Figure 3. The levels of expression of IFN-γ mRNA as assessed by real-time RT-PCR are also presented in panel B. The 15 specimens obtained at necropsy are indicated by the asterisks in panel A. All differences in CXCL9/Mig expression measured by image capture and analysis were significant (P < .001) for the acute infection, clinical latency, and AIDS values compared with values in uninfected animals.
Increased levels of expression of CXCL9/Mig mRNA (Figures 1-4) were associated with increased levels of local and systemic SIV/ΔB670 replication (Table 1). This finding is underscored by data obtained from uninfected macaques and preinfection lymph node biopsies, as well as from macaque M5599, which although infected with SIV, had an extremely low level of local and systemic viral replication (Table 1and Figures 3 and 4). In summary, these results indicate that SIV infection led to significant increases in the levels of mRNA expression of the IFN-γ–inducible chemokine CXCL9/Mig in rhesus macaque lymphoid tissues.
CXCL9/Mig mRNA+ cells colocalize with SIV-positive cells in lymphoid tissues
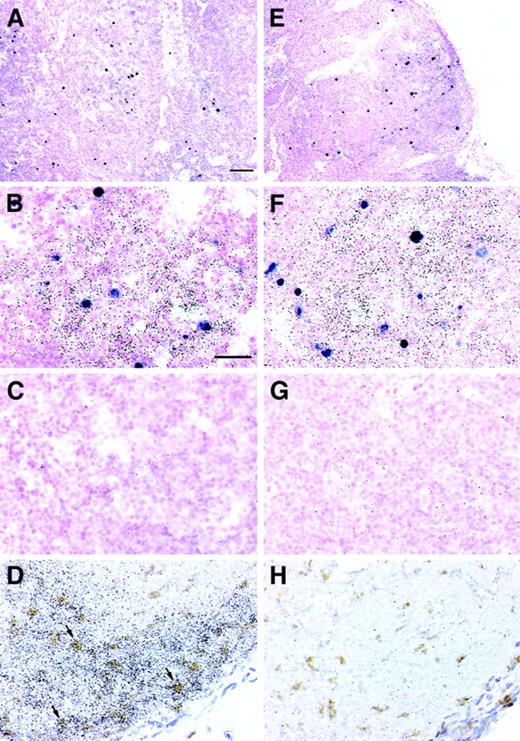
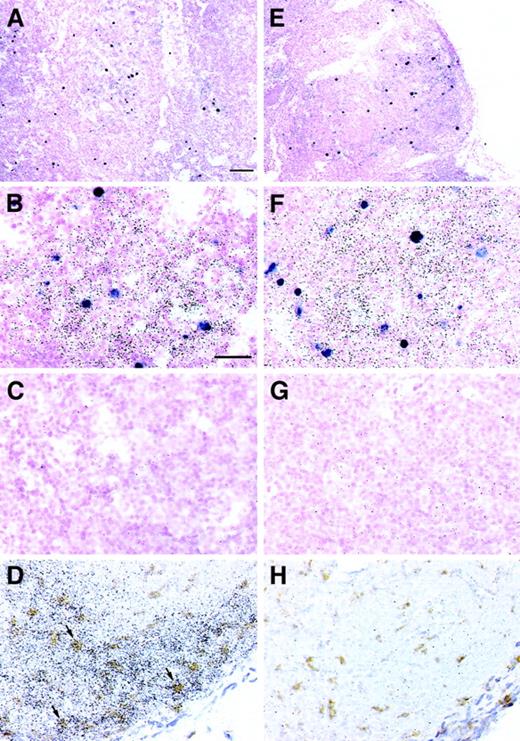
To examine the spatial relations among cells expressing CXCL9/Mig and SIV mRNAs, we conducted simultaneous ISHs for CXCL9/Mig mRNA with a35S-labeled riboprobe and for SIV RNA with digoxigenin-labeled riboprobes. This strategy revealed that productively infected cells did not express appreciable levels of CXCL9/Mig mRNA (Figures 5B and 5F). However, SIV RNA+ cells were localized predominantly in microanatomical regions that also contained CXCL9/Mig mRNA (Figures 5A,5B, 5E, and 5F). Classification of the immediate local environment of SIV RNA+ cells as either abundant for or devoid of CXCL9/Mig mRNA on the basis of the control sense riboprobe hybridization showed that 84% of SIV RNA+ cells were localized in areas with abundant CXCL9/Mig mRNA expression.
Colocalization of CXCL9/Mig mRNAs with SIV virion RNA+ cells and CD68+ monocytes/macrophages in lymph nodes from rhesus macaques.
Lymph node tissue sections from macaques in the acute phase of infection (A-C, M5299) or AIDS (E-G, M5199) were hybridized in situ simultaneously with a 35S-labeled riboprobe specific for CXCL9/Mig and a pool of digoxigenin-labeled riboprobes specific for SIV. SIV viral RNA+ cells appear purple, whereas the CXCL9/Mig signal is a more diffuse distribution of black silver grains. Autoradiographic exposure times were kept to 2 days to maintain visualization of the SIV viral RNA+ cells in a lower plane of focus. Parallel simultaneous ISH with the sense control probes are shown for comparison (C,G). Lymph node tissue sections from a macaque with AIDS (M5199) were simultaneously hybridized in situ with a CXCL9/Mig-specific, 35S-labeled riboprobe and stained immunohistochemically for the monocyte/macrophage marker, CD68 (D). ISH signal is the diffuse distribution of black silver grains, whereas the CD68 signal is the deposition of an insoluble brown precipitate. Arrows indicate several double-positive cells. ISH with the sense control probe, with simultaneous staining for CD68, is shown in panel H. The bar in panel A is equivalent to 100 μm and applies to panels A and E. The bar in panel B is equivalent to 40 μm and applies to panels B-D and F-H. Sections were counterstained with nuclear fast red (A-C, E-G) or hematoxylin (D, H). Original magnifications, × 100 (A, E) and × 400 (B-D, F-H).
To identify the populations of cells expressing the increased amounts of CXCL9/Mig mRNA, we conducted ISH for CXCL9/Mig mRNA simultaneously with immunohistochemical staining for the monocyte/macrophage marker CD68 (Figures 5D and 5H). Only a proportion of CXCL9/Mig mRNA+ cells were also CD68+. We also identified and enumerated IFN-γ mRNA+ cells in spleen and lymph node sections by ISH and found that they were extremely rare in uninfected macaques but were more abundant in acutely infected animals and less so in macaques with AIDS (Table 1). Compared with values in the uninfected controls, these differences were significant (acute infection,P = .037) or only marginally significant (AIDS,P = .064). Additional determination of the IFN-γ mRNA levels in these tissues by means of real-time RT-PCR further demonstrated elevated levels of expression after SIV infection, with mean increases of 2.6 and 3.7 fold, respectively, during acute infection and AIDS in spleen tissue, and mean increases of 6.5 and 6.0 during acute infection and AIDS, respectively, in lymph node tissue, over values in the uninfected macaque used for calibration (Figures 3B and 4B).
Reduced levels of CXCR3 on CD3+ and CD8+peripheral blood cells during SIV infection
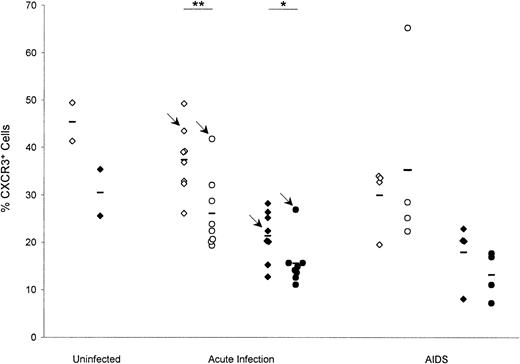
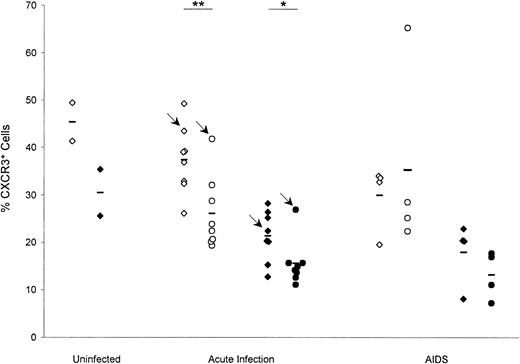
To determine whether the high levels of expression of CXCL9/Mig in lymphoid tissues affected the expression of its receptor, CXCR3,14 in peripheral blood, we conducted 2-color flow cytometry analyses of cryopreserved peripheral blood mononuclear cells with gating on CD3+ or CD8+ lymphocytes. CXCR3 is also a receptor for CXCL10/IFN-inducible protein 10 (IP-10) and CXCL11/IFN-inducible T-cell α-chemoattractant (I-TAC); it is found on effector T lymphocytes as well as on T lymphocytes recently activated in the presence of interleukin 2,14 and its expression has been associated with a type 1 cytokine production profile.18-21 The percentages of CD3+lymphocytes and CD8+ lymphocytes that were CXCR3+ were higher in uninfected macaques than in infected macaques (Figure 6). Although these data indicate an overall trend toward reduced CXCR3 expression of CD3+ and CD8+ lymphocytes after SIV infection, the differences between findings in uninfected macaques and infected animals were not significant (P values, .064 to .355). However, results of paired sample comparisons of preinfection and necropsy values for CXCR3 expression on CD3+ lymphocytes during acute infection were significantly different (P = .005; Figure 6). Of note, the percentages of CXCR3+/CD3+ and CXCR3+/CD8+ lymphocytes from M5599, which had only minimal SIV replication (Table 1) and CXCL9/Mig induction (Figures3 and 4), were among the highest in the acutely infected animals (Figure 6). These data therefore indicated that there was an association between the increased CXCL9/Mig expression in secondary lymphoid tissues and reduced CXCR3 expression on peripheral blood T lymphocytes.
Reduced expression of CXCR3 on rhesus macaque peripheral blood lymphocytes during SIV infection.
Cryopreserved peripheral blood mononuclear cells (PBMCs) were stained for CXCR3 and CD3 or CXCR3 and CD8 and examined by using 2-color flow cytometry. Data are presented as the percentages of CD3+cells or CD8+ cells that were also CXCR3+. Mean values for each group are represented by black horizontal lines. Arrows indicate the values for M5599, which had only low-level viral replication. Open diamonds indicate uninfected or preinfection PBMCs gated on CD3+ lymphocytes; filled diamonds indicate uninfected or preinfection PBMCs gated on CD8+ lymphocytes; open circles indicate necropsy PBMCs gated on CD3+lymphocytes; filled circles indicate necropsy PBMCs gated on CD8+ lymphocytes. Comparisons of the percentage of CXCR3+ cells in uninfected and infected macaques, or paired comparisons of preinfection and necropsy time points showed significant differences only for CD3+ lymphocytes during acute infection (P = .005, 2 asterisks), although data for the CD8+ lymphocytes during acute infection were marginally different (P = .071, 1 asterisk).
Discussion
Chemokines are small chemoattractant cytokines that recruit cells into microenvironments as part of constitutive and inflammatory trafficking events.2,3 Trafficking of cells to specific microanatomical compartments is important for immune inductive and effector activities, since APCs, naı̈ve T lymphocytes, and effector T lymphocytes must move from one environment to another. Although the exact mechanisms by which HIV-1 and SIV cause immunologic dysfunction leading to AIDS remain incompletely understood, inappropriate trafficking or homing of cell populations to secondary lymphoid tissues might play a significant role.22 In this study, we demonstrated that during infection of rhesus macaques with pathogenic SIV, changes occur in the levels of expression of mRNAs encoding chemokines in lymphoid tissues and that some of these changes are evident within 2 weeks PI. Of the 34 chemokine mRNAs examined by means of DNA filter array hybridization, CXCL9/Mig and CXCL13/BLC had the greatest increases in spleens of macaques with AIDS compared with uninfected controls. We focused our analyses on CXCL9/Mig because it is an inflammatory chemokine induced by IFN-γ and it is involved in many chronic inflammatory diseases.5 Analyses of the expression levels and patterns of the homeostatic chemokine CXCL13/BLC are currently under way.
In-depth ISH and real-time RT-PCR analyses showed a large, significant increase in the expression of CXCL9/Mig mRNA in spleen and lymph nodes, which we found to be associated not only with local SIV replication but also with increased IFN-γ mRNA expression. Our findings regarding IFN-γ induction are consistent with those of previous studies of IFN-γ induction during HIV-1 and SIV infection.23-27 It is important to note that although we identified CXCL9/Mig as a differentially expressed chemokine in macaque lymphoid tissues during SIV infection and propose a model for its contribution to immunopathogenesis (see below), other factors likely modulate the immune environment in lymphoid tissues, including the combined effects of multiple chemokines28 or chemokines and cytokines,29 as well as chemokine interactions with the extracellular matrix,30 and require further investigation.
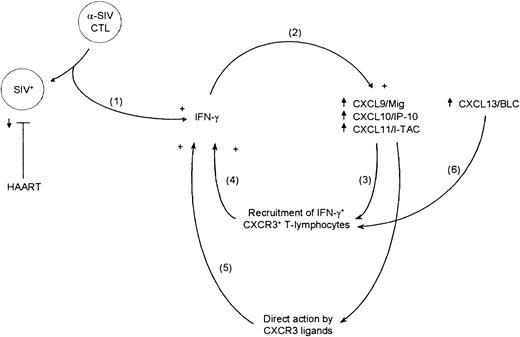
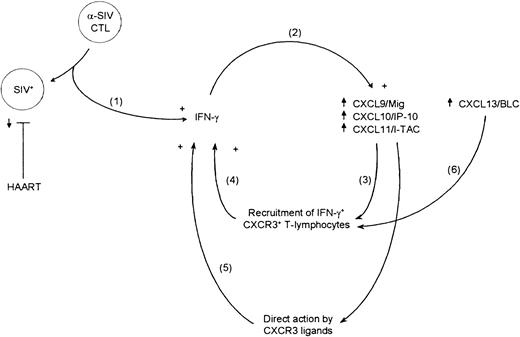
On the basis of the data presented here, we propose the following model of chronic inflammation in lymphoid tissues during SIV infection (Figure 7). First, productive infection of target cells leads to local SIV-specific cytotoxic T lymphocyte (CTL) and Th responses, some of which produce IFN-γ (step 1). SIV-specific CD8+ T lymphocytes have been detected in rhesus macaque lymph nodes as early as 11 days PI, with high numbers present during the peak of acute infection.31 Second, local production of IFN-γ induces expression of CXCR3 ligands, which in turn leads to increased recruitment of CXCR3+ T lymphocytes into secondary lymphoid tissues (steps 2 and 3). These CXCR3+ T lymphocytes need not be virus specific, and it is likely that many are not. Because a large proportion of CXCR3+ T lymphocytes produce IFN-γ,18-21 an IFN-γ–driven positive-feedback loop is established. Third, it was previously shown that recombinant CXCL10/IP-10, in addition to its chemotactic properties, leads specifically to the production of IFN-γ by T lymphocytes during stimulation with polyclonal activators or specific antigens.32 It is important to determine whether the CXCL9/Mig and CXCL11/I-TAC ligands for CXCR3 also lead to selective IFN-γ production, as well as whether the rhesus macaque homologues show the same activity. If this is a general property of CXCR3 ligands, then an additional IFN-γ–driven positive-feedback loop would be operating in lymphoid tissues of rhesus macaques infected with SIV (step 5). Fourth, it was previously found that CXCL13/BLC is an additional chemotactic ligand for CXCR3.33 Our DNA filter array data showed a large increase in CXCL13/BLC mRNA expression in spleen during SIV-associated disease progression (Figure 1), and this might also provide a positive signal that contributes to the maintenance of the IFN-γ–driven positive-feedback loops (step 6). Preliminary ISH studies examining CXCL13/BLC mRNA expression directly in tissue sections also found increased expression in spleens of macaque with AIDS (data not shown). Therefore, a positive-feedback loop in which IFN-γ expression is initiated by the antiviral cellular immune response would be established, and through the induction of CXCR3 ligands, IFN-γ–producing effector cells would be recruited into this local environment. Additional analyses are required to determine whether mechanisms other than SIV-specific effector T lymphocytes operate to increase IFN-γ production. These positive-feedback loops would result in a chronic inflammatory environment that could be considered an immunologic “black hole” that CXCR3+ effector T lymphocytes either have difficulty leaving or into which they are again recruited.
Model for IFN-γ–driven positive-feedback loops in lymphoid tissues from SIV-infected rhesus macaques.
Shown is a schematic representation of a model for 2 IFN-γ–driven positive-feedback loops that are initiated by the SIV-specific immune response in macaque lymphoid tissues.
Model for IFN-γ–driven positive-feedback loops in lymphoid tissues from SIV-infected rhesus macaques.
Shown is a schematic representation of a model for 2 IFN-γ–driven positive-feedback loops that are initiated by the SIV-specific immune response in macaque lymphoid tissues.
Predictions based on this model related to HIV-1 infection and pathogenesis are supported by previous findings. First, similar increases in the expression of CXCR3 ligands would be expected to occur in individuals infected with HIV-1. Indeed, immunohistochemical studies showed that IP-10/CXCL10 protein expression is increased in lymph nodes in individuals positive for HIV-1.34 Second, IFN-γ levels would be expected to be higher in lymphoid tissues of individuals with HIV-1 infection, and this has been demonstrated.25-27 Third, potent antiretroviral therapy would be expected to reduce IFN-γ expression in lymphoid tissues of such individuals, and this too has been observed.35 These activities are likely influenced by host genetic factors such as polymorphisms in the IFN-γ gene36 or variable CXCR3 expression levels.37
The IFN-γ–driven positive-feedback loops we propose to be operating in lymphoid tissues likely contribute to the pathogenesis of SIV and HIV-1 in several ways. Recruitment of CXCR3+ T lymphocytes to secondary lymphoid tissues would provide a continually renewed source of susceptible target cells for viral propagation. Secondary lymphoid tissues are highly suited for sustained viral replication because of the presence of local depots of infectious virus,38 the abundance of both activated and naı̈ve CD4+ T-lymphocyte targets,39,40 the expression of DC-specific ICAM-3–grabbing nonintegrin on DCs that transfers the virus to susceptible targets,41 and the induction of viral replication by the lymphoid chemokine 6Ckine/CCL21.42 In addition, T lymphocytes recruited to lymphoid tissues could be lost through direct viral killing, CTL action, or apoptosis.43Systemically, recruitment and loss of effector T lymphocytes would contribute to immunodeficiency by reducing the availability of effector cells to traffic to peripheral sites. Furthermore, a reduction would occur in the proportion of circulating T lymphocytes that are type 1. Among studies examining shifts in cytokine profiles in peripheral blood of HIV-1–infected individuals from type 1 to type 0 or type 244 are reports that support45-48 and do not support25,49 the existence of such a shift. Nevertheless, IFN-γ expression in lymph nodes increases25 and IFN-γ expression in peripheral blood decreases45-47,49 in individuals with HIV-1 infection, and antiretroviral therapy increases IFN-γ expression in peripheral blood.50 Interestingly, CXCL9/Mig and IP-10/CXCL10 are antagonists for the CCR3 chemokine receptor51 that is expressed on type 2 lymphocytes,52 and increased expression of CXCL9/Mig in lymphoid tissues might lead selectively to decreased trafficking of type 2 cells out of the blood.
Increased homing of resting T lymphocytes to secondary lymphoid tissues and their subsequent loss has been proposed as a mechanism of HIV-1 pathogenesis.22,53,54 The data presented here on the effects of SIV infection in lymphoid tissues of rhesus macaques are consistent with such a model, although the CXCR3+ T lymphocytes we propose as being important in these processes are likely effector T lymphocytes. Consistent with these models, the biphasic increase in CD4+ T lymphocyte counts observed in patients after potent antiretroviral therapy55 might be due partly to coordinated reductions in expression of IFN-γ and CXCL9/Mig. Indeed, reductions in IFN-γ mRNA expression were found in lymph nodes of patients with HIV-1 infection receiving potent antiretroviral therapy regimens that led to reductions in the numbers of HIV-1 viral RNA+ cells in lymphoid tissues.56 Therefore, potent antiretroviral therapy reduces the numbers of target cells for lysis by virus-specific CTLs and might thereby reduce the production of IFN-γ that drives the chronic inflammatory positive-feedback loops.
The findings and model described here have strong implications for current and new-generation therapies and vaccines for HIV-1. They underscore the importance of potent antiretroviral therapy in containing the infection because of the role of productively infected cells in the initiation of the IFN-γ–driven positive-feedback loops proposed in our chronic inflammatory model. In addition, therapeutic HIV-1 vaccine strategies should be used concurrently with antiretroviral therapy to suppress viral replication in lymphoid tissues during the process of improving HIV-1–specific CTL responses, which on its own is likely to result in increased IFN-γ production. Furthermore, therapies antagonistic to CXCR3 might disrupt one of the IFN-γ–driven positive-feedback loops and reduce the chronicity of the inflammation in lymphoid tissues. Finally, it is provocative to speculate that vaccine strategies designed to generate a type 2 CTL response selectively might provide an additional advantage by an attempting to avoid initiating and sustaining IFN-γ–driven feedback loops in lymphoid tissues.
We thank Dawn McClemens-McBride, Melanie O'Malley, and Shane Ritchey for excellent assistance with project coordination and animal care; Matt Delp for technical assistance; Dr Edward Klein for assistance in evaluating the histopathological findings; Dr Francois Villinger for providing the rhesus macaque IFN-γ plasmid clone; Dr Karoly Mirnics and Deborah Hollingshead of the PittArray Core Facility, Dr Tony Godfrey and Lori Kelly of the Taqman Core Facility, at the Center for Human Genetics and Integrative Biology of the University of Pittsburgh, for assistance with and advice on the differential gene-expression studies; Dr Carey Balaban for advice and assistance with transcardial perfusion; and Dr JoAnne Flynn for critically reading the manuscript.
Supported by National Institutes of Health grant R01 HL62056 to T.A.R.
The publication costs of this article were defrayed in part by page charge payment. Therefore, and solely to indicate this fact, this article is hereby marked “advertisement” in accordance with 18 U.S.C. section 1734.
References
Author notes
Todd A. Reinhart, Department of Infectious Diseases and Microbiology, Graduate School of Public Health, University of Pittsburgh, 606 Parran Hall, 130 DeSoto St, Pittsburgh, PA 15261; e-mail: reinhar@pitt.edu.

