Abstract
Inosine 5′-monophosphate dehydrogenase (IMPDH) is a rate-limiting enzyme that catalyzes the conversion of IMP to xanthosine monophosphate (XMP) at the branch point of purine nucleotide biosynthesis, leading to the generation of guanine nucleotides. Inhibition of IMPDH results in the depletion of guanine nucleotides, prevents cell growth by G1 arrest, and induces cell differentiation in a cell-type–specific manner. The molecular and sensing mechanisms underlying these effects are not clear. We have examined the induction of apoptosis by mycophenolic acid (MPA), a specific IMPDH inhibitor, in interleukin-3 (IL-3)–dependent murine hematopoietic cell lines. MPA treatment, at clinically relevant doses, caused apoptosis in 32D myeloid cells and in FL5.12 and BaF3 pre-B cells in the ongoing presence of IL-3. Apoptosis was completely prevented by the addition of guanosine at time points up to 12 hours, after which caspase 3 activity increased and apoptosis was not reversible. MPA treatment caused marked down-regulation of the MAP kinase kinase/extracellular regulatory kinase (MEK/Erk) pathway at 3 hours while simultaneously increasing the phosphorylation of c-Jun kinase. In addition, MPA strongly down-regulated the mammalian target of rapamcyin (mTOR) pathway, as indicated by the decreased phosphorylation of p70 S6 kinase and of 4EBP1. Inhibition of either the mitogen-activated protein kinase (MAPK) or the mTOR pathway alone by standard pharmacologic inhibitors did not induce apoptosis in IL-3–dependent cells, whereas inhibition of both pathways simulated the effects of MPA treatment. These results indicate that IMPDH inhibitors may be effective in modulating signal transduction pathways in hematopoietic cells, suggesting their usefulness in chemotherapeutic regimens for hematologic malignancies.
Introduction
Inosine monophosphate dehydrogenase (IMPDH; EC1.1.1.205) catalyzes the rate-limiting step in the de novo synthesis of guanine nucleotides from IMP.1 This enzymatic activity is the product of 2 enzymes encoded by separate genes that have 84% amino acid identity.2 One of the isoenzymes, IMPDH type II, is expressed at significantly higher levels in most tissues3 and is markedly up-regulated in proliferating, compared with resting, cells.4,5 Inhibitors of IMPDH have been developed as immunosuppressive agents and are highly effective at decreasing T- and B-cell responses in vitro6,7 and in vivo.8,9 Reversal of the in vitro antiproliferative effects are routinely seen with repletion of the guanine nucleotide pools through the salvage pathway, thereby establishing a direct relationship of the biologic activity with guanine nucleotide depletion. The clinical usefulness of this class of drugs ranges from combined therapy with other immunosuppressive agents in organ transplantation10 and graft-versus-host disease11 to the treatment of autoimmune disorders such as inflammatory skin diseases12 and of vasculitides such as Wegener granulomatosis.13
The antiproliferative effects of IMPDH inhibition and consequent guanine nucleotide depletion have been investigated in many cell culture systems. Effects include cell-cycle arrest in late G1, inhibition of pRB phosphorylation in peripheral blood lymphocytes, and decreased expression of several proteins important for cell-cycle progression including c-myc, cyclin D3, cdk 4, and cdk 6.14,15 The IMPDH inhibitor tiazofurin also induced down-regulation of the expression of c-Ki-ras, c-Ha-ras, and G-protein–mediated transmembrane signaling.14,16,17 Inhibition of IMPDH activity results in the differentiation of a number of cell lines,18,19 whereas the induction of apoptosis is limited to only a few cell types.20,21
Mycophenolic acid (MPA), a highly specific, uncompetitive inhibitor of IMPDH, was tested against the panel of 60 cell lines at the National Cancer Institute (http://dtp.nci.nih.gov) and was found to have growth inhibitory effects against most neoplastic cell types, with leukemias being the most sensitive. However, MPA did not have significant cytotoxic activity in this screen. None of these cells were dependent for proliferation on the presence of specific growth factors or cytokines other than those present in bovine serum. We have now found that MPA is able to induce apoptosis in 3 murine hematopoietic cell lines of diverse lineages that share the characteristic of interleukin-3 (IL-3) dependence. We have used the well-defined signaling pathways in these cells to determine how MPA interferes with cell survival signals induced by this cytokine. These studies should lay the foundation for the use of IMPDH inhibitors as chemotherapeutic effects in some hematologic malignancies, especially in combination with other chemotherapeutic agents or metabolic inhibitors.
Materials and methods
Cell culture and reagents
The murine myeloid cell line 32D and the pre–B-cell line BaF3 were maintained in RPMI 1640 medium supplemented with 10% heat-inactivated fetal bovine serum (FBS; Hyclone, Logan, UT) and 10% WEHI-conditioned medium as a source of IL-3. The murine pre–B-cell line FL5.12 (a gift from Craig B. Thompson, University of Pennsylvania, Philadelphia) was cultured in RPMI 1640 medium supplemented with 10% heat-inactivated FBS, 20 mM HEPES (N-2-hydroxyethylpiperazine-N′-2-ethanesulfonic acid), 55 μM 2-mercaptoethanol, and 10% WEHI-conditioned medium. All cell cultures were maintained in the presence of 100 μg/mL penicillin/100 μg/mL streptomycin. MPA was purchased from Sigma (St Louis, MO) and solubilized in ethanol. MAP kinase kinase (MEK) 1/2 inhibitor (UO126) was obtained from Cell Signaling Technology (Beverly, MA) and dissolved in dimethyl sulfoxide (DMSO). Rapamycin was purchased from CalBiochem (La Jolla, CA) and dissolved in DMSO. Antibodies against phospho-Akt (Ser473), total Akt, phospho-SAPK/JNK (Thr183/Tyr185), total SAPK/JNK, phospho-MEK1/2 (Ser217/221), total MEK1/2, phospho-p44/42 MPA kinase (Thr202/Tyr204), total p44/42 MAPK, phospho-p70 S6 kinases (Thr389), total p70 S6 kinase, phospho-Stat3 (Tyr705), phospho-Stat3 (Ser727), and phospho-Stat5 (Tyr694) were purchased from Cell Signaling Technology. Antibody against total Stat3 was obtained from Upstate Biotechnology (Lake Placid, NY). Antibody against 4E-BP1 was obtained from Santa Cruz Biotechnology (Santa Cruz, CA). All control cultures were treated with equivalent amounts of reagent diluents.
Analysis of DNA fragmentation
Mononucleosomes and oligonucleosomes in the cytoplasm of the apoptotic cells were measured using a Cell Death Detection ELISA kit (Roche Diagnostics GmbH, Indianapolis, IN) according to the manufacturer's protocol. Lysate from approximately 1 × 10³ cells was used for each well. Absorbance was measured at 405 nm against a reference of 490 nm using a MAXline Microplate Reader (Molecular Devices, Sunnyvale, CA). To visualize fragmented DNA on agarose gels, 5 × 10⁶ cells were lysed in 0.5 mL extraction buffer containing 10 mM Tris-HCl (pH 7.5), 15 mM NaCl, and 1 mg/mL RNase A. Samples were incubated at 37°C for 30 minutes, 550 μg proteinase K was added, and samples were incubated for an additional 30 minutes. Samples were then extracted twice with phenol/chloroform/IAA (25:24:1) and once with chloroform, followed by ethanol precipitation. Approximately one third of the DNA obtained was separated on 1.5% agarose gels.
Assay for caspase 3 activity
To measure caspase 3 activity, cells were washed once with phosphate-buffered saline (PBS) and were lysed in buffer containing 50 mM HEPES, pH 7.4, 0.1% CHAPS, 1 mM dithiothreitol (DTT), 0.1 mM EDTA (ethylenediaminetetraacetic acid), and 0.1% Triton X-100. Cells were incubated on ice for 30 minutes followed by centrifugation at 12 000g at 4°C for 10 minutes. The protein concentration in the supernatant was quantitated by the Bradford method (Bio-Rad Laboratories, Hercules, CA). Fifty micrograms protein lysate was used for each assay in the presence of 200 μM caspase 3 substrate, AC-DEVD-pNA (CalBiochem), in a 100 μL assay buffer containing 50 mM HEPES, pH 7.4, 100 mM NaCl, 0.1% CHAPS, 10 mM DTT, 1 mM EDTA, and 10% glycerol. Samples containing 50 μM P-nitroaniline (Sigma) were used as calibration standards. Plates were read at 405 nm absorbance using a MAXline Microplate Reader. Caspase 3 activity is expressed as picomoles per minute and is calculated based on the concentration of P-nitroaniline in the calibration standard (conversion factor), as calculated from the formula, [slope (OD/min) × conversion factor (μM/OD) × assay volume (μL)], as described in the protocol for the Caspase-3 Cellular Activity Assay Kit (BIOMOL, Plymouth Meeting, PA).
Determination of intracellular purine nucleotide pools
Cells were extracted with 5% cold perchloric acid and incubated on ice for 20 minutes. After centrifugation at 15 000g for 10 minutes, supernatants were adjusted to pH 6 using 3 M KOH/3M KHCO3. Samples were incubated on ice for an additional 10 minutes and were centrifuged for 10 minutes at 4°C. Supernatants were stored at –80°C until use. Intracellular guanosine triphosphate (GTP) and adenosine triphosphate (ATP) levels were measured using high-performance liquid chromatography (HPLC) (Partisil 5 SAX, RAC 11 column; VWR Suwance, GA).
Immunoblots
To prepare cell lysate for Western immunoblot analysis, cell pellets were lysed in buffer containing 20 mM Tris-HCl (pH 8.0), 137 mM NaCl, 10% glycerol, 1% Triton X-100, 1 mM Na3VO4, 25 mM β-glycerophosphate, 1× protease inhibitor cocktail (Sigma), and 1× phosphatase inhibitor cocktail 1 (Sigma). After centrifugation at 16 000g for 15 minutes, protein concentrations were quantitated by the Bradford method. Equal amounts of protein were separated using sodium dodecyl sulfate–polyacrylamide gel electrophoresis (SDS-PAGE) and were transferred to either polyvinylidene difluoride (PVDF) Immobilon-P membranes (Millipore, Bedford, MA) or Protran nitrocellulose membranes (Schleicher & Schuell, Keene, NH). Different amounts of protein and different percentage gels were used, depending on the protein analyzed, as described in the figure legends. Membranes were blocked with 5% nonfat milk in TBS buffer containing 0.1% Tween 20 (TBST) at room temperature for 1 hour and then were incubated with primary antibodies diluted either in 5% bovine serum albumin (BSA) for phospho-protein detection or in blocking solution for other antibodies at 4°C overnight. Dilutions of primary antibodies were made according to the manufacturer's instructions. After several washes in TBST buffer, membranes were incubated with appropriate secondary antibodies (1:2000-1:5000 dilution; Amersham, Arlington Heights, IL) at room temperature for 1 hour. Detection was performed using the enhanced chemiluminescence system (ECL; Amersham). For all Western blots, membranes were probed with antibodies specific for phosphorylated proteins, dried, and reprobed with antibodies specific for total protein. For Erk Western blots, identical amounts of protein were loaded in duplicate gels, one for phospho-Erk and one for total Erk.
Assay for MEK kinase activity
To assess MEK kinase activity, a MEK1 immunoprecipitation kinase assay kit was used (Upstate Biotechnology) according to the manufacturer's protocol. Briefly, 100 μL protein A beads were incubated with 10 μL anti-MEK1 antibody at 4°C on a rotator overnight. After several washes, 800 μg cell lysate was mixed with antibody/protein A complex and was rotated at 4°C for another 2 hours. Complexes were then washed and incubated with 0.4 μg unactivated MAPK 2/Erk2 in the presence of magnesium chloride and ATP (Mg/ATP cocktail) at 30°C with shaking for 30 minutes. After centrifugation at 15 000g for 15 seconds, 4 μL supernatant was incubated with 20 μg myelin basic protein in the presence of 10 μCi (0.37 MBq) γ-32P]-ATP (3000 Ci/mmol [111 MBq]; Amersham) diluted with Mg/ATP cocktail. Reactions were carried out at 30°C for 30 minutes and were spotted onto P81 phosphocellulose paper. After washing twice with 0.75% phosphoric acid buffer and once with acetone, 5 mL scintillation cocktail was added to dried filters, counted in a Liquid Scintillation Analyzer (Packard, Downers Grove, IL). Samples with no anti-MEK1 antibody or with no lysate were used as background controls.
Results
Induction of apoptosis in three IL-3–dependent cell lines by MPA dose and time dependency
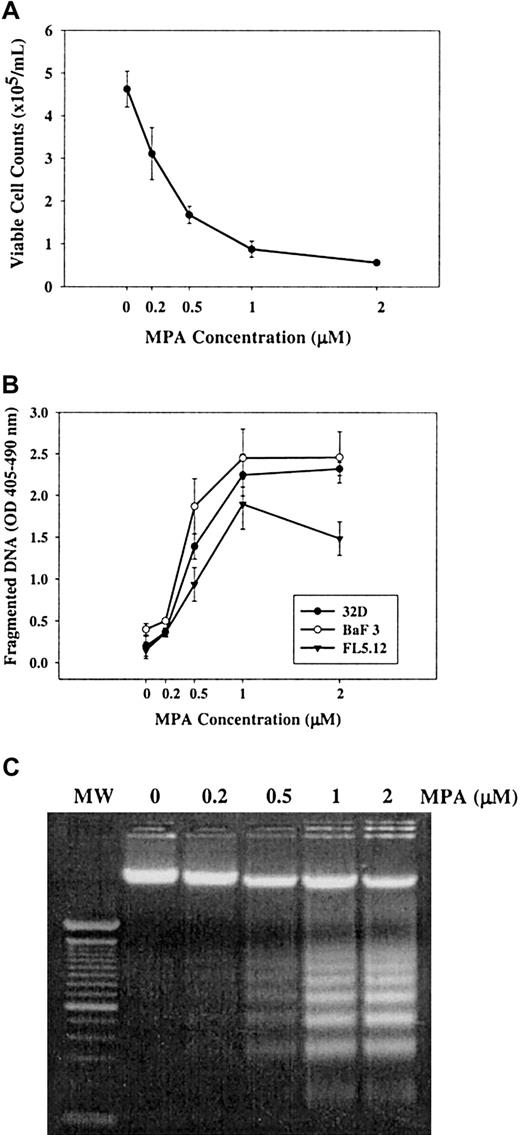
Murine myeloid 32D cells and pre-B BaF3 and FL5.12 cells were cultured in the presence of 10% WEHI-conditioned medium as a source of IL-3 for growth, and MPA was added at the concentrations indicated in Figure 1. Dose-dependent growth inhibition (Figure 1A) and apoptosis (Figure 1B-C) were observed at 24 hours. Apoptosis was induced at concentrations of 0.5 μM and above, as demonstrated by the detection of fragmented DNA using enzyme-linked immunosorbent assay (ELISA) and by the visualization of DNA ladders on agarose gel. The induction of apoptosis in 32D cells was also demonstrated using annexin V staining (data not shown).
Effect of MPA on 32D, FL5.12, and BaF3 cell growth and survival. Cells were treated with indicated doses of MPA for 24 hours. (A) 32D cell counts determined in quadruplicate. This is a representative experiment that has been repeated in 32D cells at least 3 times; the same effect was also seen in FL5.12 and BaF3 cells. (B) 32D, BaF3, and FL5.12 cells were treated with indicated doses of MPA for 24 hours, and apoptosis was measured by the presence of fragmented DNA using ELISA. Values are mean ± SD of 3 independent experiments for each cell line. (C) Apoptosis of 32D cells as measured by DNA ladder formation. 100-bp DNA markers (MWt) are included.
Effect of MPA on 32D, FL5.12, and BaF3 cell growth and survival. Cells were treated with indicated doses of MPA for 24 hours. (A) 32D cell counts determined in quadruplicate. This is a representative experiment that has been repeated in 32D cells at least 3 times; the same effect was also seen in FL5.12 and BaF3 cells. (B) 32D, BaF3, and FL5.12 cells were treated with indicated doses of MPA for 24 hours, and apoptosis was measured by the presence of fragmented DNA using ELISA. Values are mean ± SD of 3 independent experiments for each cell line. (C) Apoptosis of 32D cells as measured by DNA ladder formation. 100-bp DNA markers (MWt) are included.
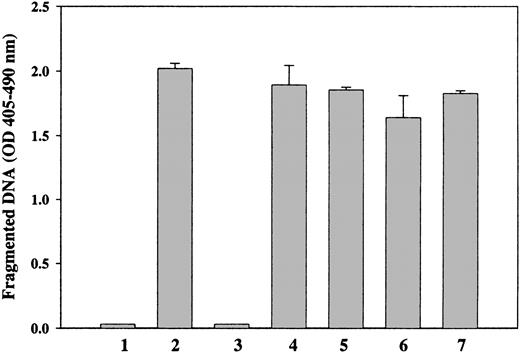
To confirm that the effect of MPA on 32D cells is specifically caused by the inhibition of IMP dehydrogenase and the consequent depletion of intracellular guanine nucleotides, different ribonucleosides or bases were added to the cultures. Guanosine completely reversed MPA-induced apoptosis (Figure 2, lane 3), whereas adenine, adenosine, cytidine, and uridine had no effect (Figure 2, lanes 4-7). Guanosine also reversed MPA-induced apoptosis in BaF3 and FL5.12 cells (data not shown). Guanosine was used instead of guanine because of its better solubility. Guanine generated from guanosine in the presence of serum containing purine nucleoside phosphorylase activity can be converted to guanosine monophosphate (GMP) by hypoxanthine-guanine phosphoribosyl transferase,1 thus circumventing the effect of inhibition of IMPDH on guanine nucleotide levels.
Reversal of MPA-induced apoptosis by guanosine in 32D cells. Cells were cultured without (lane 1) or with (lanes 2 to 7) 2 μM MPA. At beginning of the culture 100 μM guanosine (lane 3), 100 μM adenine (lane 4), 20 μM adenosine (lane 5), 100 μM cytidine (lane 6), or 100 μM uridine (lane 7) was added. ELISA was used to measure apoptosis after 24 hours of treatment. Data are from 1 representative experiment assayed in triplicate. Similar reversal by guanosine has been documented at least 5 times in 32D cells and in BaF3 and FL5.12 cells.
Reversal of MPA-induced apoptosis by guanosine in 32D cells. Cells were cultured without (lane 1) or with (lanes 2 to 7) 2 μM MPA. At beginning of the culture 100 μM guanosine (lane 3), 100 μM adenine (lane 4), 20 μM adenosine (lane 5), 100 μM cytidine (lane 6), or 100 μM uridine (lane 7) was added. ELISA was used to measure apoptosis after 24 hours of treatment. Data are from 1 representative experiment assayed in triplicate. Similar reversal by guanosine has been documented at least 5 times in 32D cells and in BaF3 and FL5.12 cells.
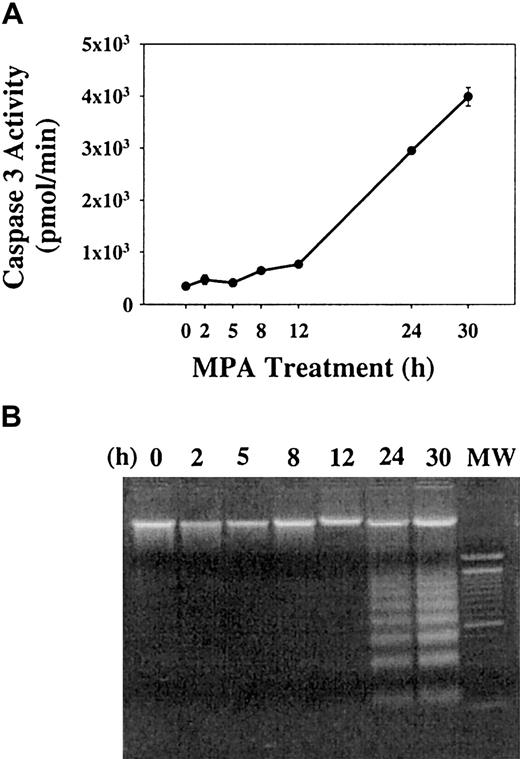
MPA-induced apoptosis occurs in a time-dependent manner, as indicated in Figure 3. Caspase 3 activity was used as a marker of apoptosis induction and was increased by 10-fold after 24 hours of MPA treatment, with little change at 12 hours (Figure 3A); DNA ladder formation was induced in a similar time frame (Figure 3B). Finally, the addition of guanosine at increasing time intervals after the addition of MPA showed complete prevention of apoptosis at time points up to 12 hours but little or no effect after 12 hours (data not shown).
Time-dependent induction of apoptosis by MPA. 32D cells were treated with 2 μM MPA and harvested at indicated time points. (A) Activation of caspase 3. (B) DNA fragmentation of the same samples. Data are representative of 3 independent experiments; the caspase 3 assay was performed in triplicate, and values are mean ± SD.
Time-dependent induction of apoptosis by MPA. 32D cells were treated with 2 μM MPA and harvested at indicated time points. (A) Activation of caspase 3. (B) DNA fragmentation of the same samples. Data are representative of 3 independent experiments; the caspase 3 assay was performed in triplicate, and values are mean ± SD.
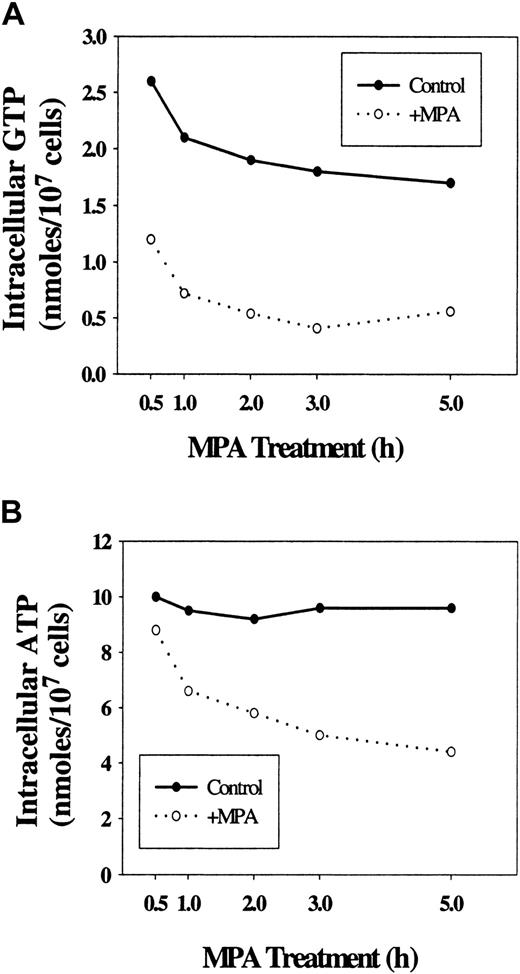
Effect of MPA treatment on purine nucleotide pools. For purine nucleotide quantitation, 32D cells treated with 2 μM MPA were harvested at various time points. GTP levels were dramatically reduced as early as 30 minutes after MPA treatment (Figure 4A). ATP pools were also decreased, though to a lesser extent, after MPA addition (Figure 4B), as has been reported for higher doses of MPA.22 The addition of guanosine completely reversed the fall in GTP levels (data not shown). dGTP was also greatly reduced after MPA treatment (data not shown). However, the induction of apoptosis was not prevented with adenine or adenosine, each of which can be salvaged into adenine nucleotide pools, strongly suggesting that the fall in ATP level is not directly relevant for the induction of cell death.
Effect of MPA treatment on purine nucleotide pools. 32D cells were treated with MPA at 2 μM for the indicated times. GTP (A) and ATP (B) levels were measured by HPLC. Data are from 1 representative experiment. Similar results were obtained in at least 3 other independent assays. The decrease in ATP following MPA treatment was also confirmed by luciferase assays.
Effect of MPA treatment on purine nucleotide pools. 32D cells were treated with MPA at 2 μM for the indicated times. GTP (A) and ATP (B) levels were measured by HPLC. Data are from 1 representative experiment. Similar results were obtained in at least 3 other independent assays. The decrease in ATP following MPA treatment was also confirmed by luciferase assays.
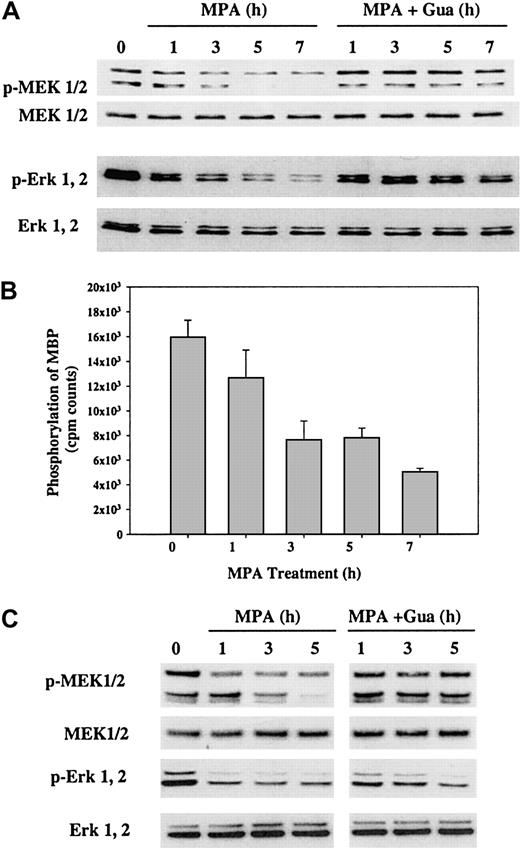
Effect of MPA on MEK-Erk, JNK, and Akt signaling pathways. One of the major pathways activated following IL-3 stimulation is the Ras-Raf MAPK cascade, which in turn results in the phosphorylation of MEK1/2 and Erk 1 and 2. To assess whether the depletion of guanine nucleotides affected these signaling molecules, we determined the levels of the activated, phosphorylated forms of MEK and Erk after MPA treatment (Figure 5). Phospho-MEK1/2 and phospho-Erk 1 and 2 levels were markedly decreased 1 to 3 hours after MPA treatment in 32D (Figure 5A) and FL5.12 (Figure 5C). We have consistently obtained 2 bands using our phospho-MEK1/2 antibody, though only the upper band is detected using an antibody for total MEK1/2. Because both bands demonstrate similar decreases in intensity after drug treatment, we infer that the bottom band may represent a degradation product of the upper phosphorylated form of MEK. The addition of guanosine reverses the effect of MPA in all instances, confirming that a reduction in guanine nucleotide level accounts for the alterations in these signaling molecules.
Effect of MPA treatment on MEK-Erk pathway. (A) 32D cells were treated with 2 μM MPA alone or MPA plus 100 μM guanosine (Gua), and cells were harvested at indicated time points. Western blot analysis was performed using antibodies specific for phospho-MEK, phospho-Erk, and total MEK and Erk protein. (B) 32D cells were treated with 2 μM MPA for the indicated time points. Total lysate (800 μg) was used for immunoprecipitation with MEK-specific antibody, followed by an MEK kinase activity assay using Erk and MBP substrates as described in “Materials and methods.” Data are from 1 of 2 representative experiments, each performed in triplicate. (C) FL5.12 cells were treated as 32D cells in panel A and were harvested at indicated times. Total cell lysate (3 μg) was used for MEK and Erk analysis.
Effect of MPA treatment on MEK-Erk pathway. (A) 32D cells were treated with 2 μM MPA alone or MPA plus 100 μM guanosine (Gua), and cells were harvested at indicated time points. Western blot analysis was performed using antibodies specific for phospho-MEK, phospho-Erk, and total MEK and Erk protein. (B) 32D cells were treated with 2 μM MPA for the indicated time points. Total lysate (800 μg) was used for immunoprecipitation with MEK-specific antibody, followed by an MEK kinase activity assay using Erk and MBP substrates as described in “Materials and methods.” Data are from 1 of 2 representative experiments, each performed in triplicate. (C) FL5.12 cells were treated as 32D cells in panel A and were harvested at indicated times. Total cell lysate (3 μg) was used for MEK and Erk analysis.
We next determined the effect of MPA on MAPK activity. Immunoprecipitated MEK protein was assayed for its kinase activity using p42 Erk2 as a substrate. Phosphorylated Erk2 then phosphorylates myelin basic protein (MBP) in the presence of γ-32P] ATP, as described in “Materials and methods.” As shown in Figure 5B, MEK kinase activity is reduced to less than 50% of control levels after 3 hours of MPA treatment, a time course that is consistent with the reduction in the level of phosphorylated MEK.
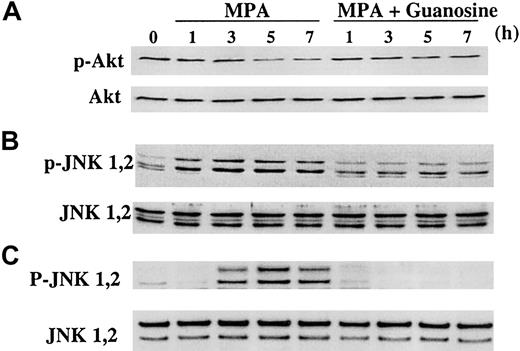
Phospho-Akt was only slightly decreased after approximately 5 hours of MPA treatment in 32D cells (Figure 6A), though this effect was consistently observed. In contrast, the phosphorylation of c-Jun kinase (JNK) is clearly increased at 1 to 3 hours after treatment in 32D and FL5.12 cells (Figure 6B-C). Another stress response kinase, p38 MAPK, was not affected by MPA treatment (data not shown).
Effect of MPA treatment on Akt and JNK phosphorylation. 32D and FL5.12 cells were treated with 2 μM MPA alone or MPA plus 100 μM guanosine and were harvested at indicated time points. Western blot analysis for phospho-Akt and total Akt was performed on 32D cells (A), and for phospho-JNK and total JNK was performed on 32D (B) and FL5.12 cells (C). Total lysate (40 μg) was used for these blots.
Effect of MPA treatment on Akt and JNK phosphorylation. 32D and FL5.12 cells were treated with 2 μM MPA alone or MPA plus 100 μM guanosine and were harvested at indicated time points. Western blot analysis for phospho-Akt and total Akt was performed on 32D cells (A), and for phospho-JNK and total JNK was performed on 32D (B) and FL5.12 cells (C). Total lysate (40 μg) was used for these blots.
Because 32D cells require IL-3 for growth, the addition of WEHI-conditioned medium containing this cytokine to a fresh culture of 32D cells results in the phosphorylation and hence activation of many signaling molecules, including Akt and MAPK. To avoid this confounding variable, we initiated all cell cultures 12 to 15 hours before the addition of MPA and harvested drug-treated and untreated cells at indicated time points after MPA addition. None of the effects observed with MPA were seen in untreated cells (data not shown).
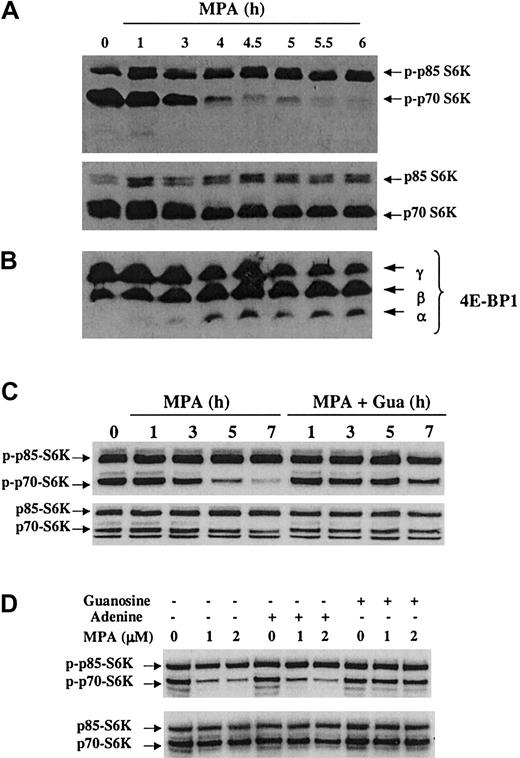
Effect of MPA on mTOR pathway. The mammalian target of rapamycin (mTOR) acts as an intermediate between nutrient sensing and the regulation of protein translation and ribosome biosynthesis. In response to growth stimulation, mTOR phosphorylates and controls the activities of 2 key translational regulators, S6 kinase 1 (p70 S6K) and eukaryotic initiation factor 4E binding protein 1 (4E-BP1/PHAS).23,24 To answer the question of whether depletion of GTP or dGTP also affects the mTOR pathway, 32D and FL5.12 cells were treated with MPA for different time periods, and the phosphorylation status of p70, p85 S6 kinases (Figure 7A, C) and 4E-BP1 (Figure 7B) was measured. Levels of phosphorylated p70 S6 kinase were dramatically reduced after 4 hours of MPA treatment, whereas its nuclear isoform, p85 S6 kinase, was not affected. A hyperphosphorylated 4E-BP1 γ form was reduced, and a hypophosphorylated α form was induced 3 to 4 hours after MPA treatment. These results indicate that MPA down-regulates the mTOR pathway in a time frame roughly equivalent to its effects on the MAPK and JNK signaling pathways.
Effect of MPA treatment on the mTOR pathway. 32D cells were treated with 2 μM MPA for the indicated time points. Total cell lysate (100 μg) was used for phospho-S6 kinase detection (A, upper panel); the membrane was probed with antibody against total S6 kinase (A, lower panel) and 4E-BP1 (B). FL5.12 cells were treated with 2 μM MPA alone or MPA plus 100 μM guanosine and were harvested at indicated time points; 40 μg protein was analyzed for phospho-S6K and total S6K (C). 32D cells were treated with 1 or 2 μM MPA in the absence or presence of 100 μM adenine or 100 μM guanosine for 4.5 hours; 40 μg lysate was analyzed for phospho-S6K and total S6K (D).
Effect of MPA treatment on the mTOR pathway. 32D cells were treated with 2 μM MPA for the indicated time points. Total cell lysate (100 μg) was used for phospho-S6 kinase detection (A, upper panel); the membrane was probed with antibody against total S6 kinase (A, lower panel) and 4E-BP1 (B). FL5.12 cells were treated with 2 μM MPA alone or MPA plus 100 μM guanosine and were harvested at indicated time points; 40 μg protein was analyzed for phospho-S6K and total S6K (C). 32D cells were treated with 1 or 2 μM MPA in the absence or presence of 100 μM adenine or 100 μM guanosine for 4.5 hours; 40 μg lysate was analyzed for phospho-S6K and total S6K (D).
To verify that the down-regulation of mTOR pathway following MPA treatment is a specific result of the reduction in GTP and not ATP,25 we treated 32D cells with 1 or 2 μM MPA in the presence of adenine or guanosine. As shown in Figure 7D, guanosine but not adenine completely reversed the MPA effect on phosphorylated p70 S6K. The addition of adenine to 32D cells resulted in a 1.7-fold increase over control values in ATP levels after 3 hours (data not shown). Therefore, we conclude that the down-regulation of the mTOR pathway in the presence of MPA results directly from effects in the guanine, and not the adenine, nucleotide pools.
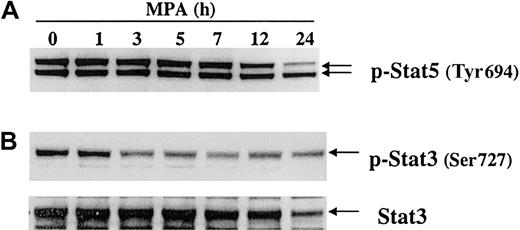
Effect of MPA on STAT protein phosphorylation. On IL-3 stimulation, a group of transcription factors termed signal transducers and activators of transcription (STATs) is activated through tyrosine phosphorylation by Janus kinase 2 (JAK2) or Src-kinase.26 Tyrosine-phosphorylated STAT then dimerize and translocate to the nucleus. In addition to tyrosine phosphorylation, maximal activation of Stat3 also requires phosphorylation of serine residues by mTOR and MAPK.27-29 To test whether MPA treatment affects STAT phosphorylation, 32D cells were treated with MPA in the presence of IL-3 for various times. As shown in Figure 8A, tyrosine (Tyr694)–phosphorylated Stat5 was not changed after MPA treatment until after 12 hours, when apoptosis has already been induced. In the ongoing presence of IL-3, tyrosine (Tyr705)–phosphorylated Stat3 was barely detectable at 0 hour and did not change following MPA treatment (data not shown). These results indicate that the Src/JAK/STAT pathway is not a target for MPA effects. However, Stat3 phosphorylated on Ser727 was significantly reduced at 3 hours after MPA treatment (Figure 8B), consistent with the observed down-regulation of the mTOR and MAPK pathways after MPA treatment.
Effect of MPA on phosphorylation of Stat proteins. 32D cells were treated with 2 μM MPA for the indicated time points. (A) Lysate (30 μg) was used for detection of tyrosine-phosphorylated Stat5. (B) Lysate (30 μg) was used for serine-phosphorylated Stat3, and the same membrane was reprobed with antibody against total Stat3.
Effect of MPA on phosphorylation of Stat proteins. 32D cells were treated with 2 μM MPA for the indicated time points. (A) Lysate (30 μg) was used for detection of tyrosine-phosphorylated Stat5. (B) Lysate (30 μg) was used for serine-phosphorylated Stat3, and the same membrane was reprobed with antibody against total Stat3.
Concordant down-regulation of the MAPK and mTOR pathways induces 32D cell apoptosis
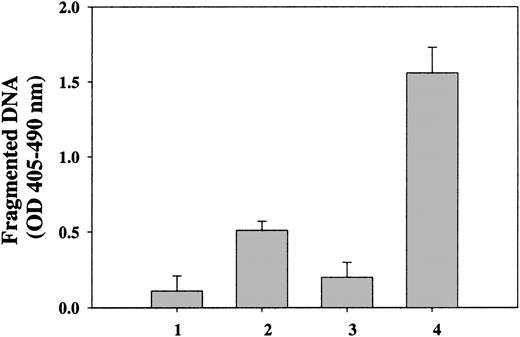
Although it is unclear which molecular event(s) directly trigger apoptosis in 32D cells after MPA treatment, we hypothesize that the down-regulation of MAPK and mTOR pathways might contribute to the induction of apoptosis because all documented changes in the signaling pathways occur in conjunction with the depletion of GTP and dGTP and before the induction of apoptosis. To test this hypothesis, we used selective inhibitors of each pathway alone and in combination. Treatment of 32D cells with UO126, a specific MEK inhibitor, did not induce significant apoptosis at concentrations below 40 μM, whereas rapamycin, a specific mTOR inhibitor, did not induce apoptosis at concentrations up to 10 μM. Each inhibitor was demonstrated to down-regulate phosphorylated Erk and p70 S6 kinase, respectively, at much lower concentrations. These results indicated that down-regulation of either the MAPK or the mTOR pathway alone is insufficient to induce apoptosis. However, treatment of 32D cells with UO126 in combination with rapamycin resulted in apoptosis equivalent to that seen with MPA treatment (Figure 9). This result clearly demonstrated that the inhibition of MAPK and mTOR pathways was sufficient to induce apoptosis in 32D cells, but it does not rule out the possibility that MPA may have additional effects outside these 2 pathways.
Induction of apoptosis by inhibition of MAPK and mTOR pathways. 32D cells were untreated (lane 1) or were treated with 10 μM UO126 (lane 2), 5 μM rapamycin (lane 3), or 5 μM rapamycin in combination with 10 μM UO126 (lane 4). ELISA was used to measure apoptosis after 24 hours of treatment. Data represent the mean ± SD of quadruplicate determinations. This experiment was repeated at least 3 times with slightly variable concentrations of inhibitors.
Induction of apoptosis by inhibition of MAPK and mTOR pathways. 32D cells were untreated (lane 1) or were treated with 10 μM UO126 (lane 2), 5 μM rapamycin (lane 3), or 5 μM rapamycin in combination with 10 μM UO126 (lane 4). ELISA was used to measure apoptosis after 24 hours of treatment. Data represent the mean ± SD of quadruplicate determinations. This experiment was repeated at least 3 times with slightly variable concentrations of inhibitors.
Discussion
Guanine nucleotides are essential to many aspects of cellular metabolism, including, but not limited to, nucleic acid synthesis and the function of numerous G proteins involved in receptor function and intracellular signaling pathways. Limitation of these metabolites, as induced by inhibition of their synthesis from IMP through the de novo pathway, has been shown to result in cell-cycle arrest in late G1 in many cell lines and in peripheral blood lymphocytes stimulated to proliferate. The induction of quiescence, as opposed to apoptosis, has posed a conceptual block to the use of IMPDH inhibitors in chemotherapy regimens. Despite some initial enthusiasm for use of the drug tiazofurin as a potential differentiating agent in chronic myelogenous leukemia in blast crisis,30 IMPDH inhibitors have been used primarily for their immunosuppressive effects.
We have documented that IMPDH inhibition and the consequent guanine nucleotide depletion result in apoptosis rather than mere cell-cycle arrest at relatively low doses in 3 IL-3–dependent hematopoietic cell lines. This observation, in conjunction with the cell-type specificity, suggests that IL-3 signals essential for cell survival are interfered with by limitation of these metabolites. To understand the mechanism of action of MPA-induced apoptosis, we have examined the effects of MPA on 3 major signaling pathways important in IL-3–mediated cellular proliferation.
Activation of caspase 3 was observed after 12 hours following MPA treatment and the addition of guanosine after this time point was ineffective at preventing apoptosis. These results signify that commitment to apoptosis requires a relatively long time period after the initial depletion of guanine nucleotides. It was surprising that only 3 hours after drug addition, and coincident with GTP depletion, signaling through the MEK/ERK and the mTOR pathways was significantly inhibited, as manifested by the decrease in MEK phosphorylation and activity and the decrease in S6 kinase1 and 4EBP1 phosphorylation. Inhibition of either pathway alone, as carried out through the use of relatively selective pharmacologic inhibitors, was ineffective in inducing apoptosis, whereas the combined inhibition of the 2 pathways was sufficient for this effect.
IL-3 receptors generate several major signals to promote cell growth and survival. One of these is clearly through the MAPK pathway, activated through Ras/Raf signaling. It has been demonstrated that c-ras is activated after IL-3 stimulation31,32 and that constitutive expression of activated Ras or Raf prevents apoptosis in response to the withdrawal of IL-3.33-35 Activated Ras, in addition to many other small G proteins, has a high affinity for guanine nucleotide binding,36 and it has been thought doubtful that the 80% decline in total intracellular GTP levels induced by MPA would be sufficient to modulate the function of these proteins. However, there is some evidence that free GTP pools, as measured by sophisticated patch clamp techniques, are significantly lower than total cytoplasmic GTP concentrations and may be in the 50 to 150 μM range rather than the millimolar range.37 If true, IMPDH inhibition could significantly impair the function of some G proteins.
The second major pathway increased through IL-3 stimulation is the mTOR pathway, regulated by nutrient deprivation and by mitogen and cytokine stimulation.38 Activation of p70 S6 kinase results in phosphorylation of the 40S ribosomal protein S6, whereas hyperphosphorylated 4EBP1 causes its dissociation from eIF4E, leading to increased protein translation through 5′ capping of specific mRNAs.39 Our studies have clearly demonstrated that MPA treatment reduces the phosphorylated active form of p70 S6 kinase and causes hypophosphorylation of 4EBP1, the latter effect potentially mediating the decreases in c-myc and cyclin D protein translation that have been observed in cells treated with IMPDH inhibitors.14,15 Both proteins are encoded by mRNAs that contain polypyrimidine tracts, and they have been shown to be down-regulated through the inhibition of translation and the mTOR pathway.38,40 mTOR itself has been shown to be inhibited by limiting amounts of ATP and to have low affinity for this nucleotide, thus acting as a direct and highly sensitive sensor of ATP depletion.25 However, down-regulation of mTOR following MPA treatment is reversed by the addition of guanosine, not adenine, suggesting that the mTOR pathway is directly affected by the depletion of GTP as well as ATP.25
A further variable is the observation of JNK activation with MPA treatment. The JNK pathway has been implicated in apoptosis and survival signaling, and JNK phosphorylation frequently reflects a response to cellular “stress.” 41 We hypothesize that the combined effects of MEK inhibition and inhibition of the mTOR pathway are sufficient to result in JNK activation, and we have preliminary data to support the induction of JNK phosphorylation in the presence of rapamycin (5 μM) and UO126 (10 μM) in combination, but not with either inhibitor alone. Whether JNK activation is required for the apoptotic response in IL-3–dependent cells is unclear at present.
Our results clearly do not rule out the possibility that MPA and, by extension, guanine nucleotide depletion have effects on additional apoptotic effector mechanisms, but they demonstrate that limitation of these important metabolites has an early effect in down-regulating at least 2 signaling pathways important in cytokinemediated cell survival. Selectivity is evident from the fact that p38 phosphorylation and the tyrosine phosphorylation of Stat3 and Stat5 were unaffected. The decrease in the phosphorylation of Stat3 Ser727 underscores the more proximal effects on the MAPK and mTOR pathways, both of which lead to Ser727 phosphorylation.28,29 We conclude from these observations that the manipulation of intracellular metabolites by inhibitors of selective pathways, such as the purine nucleotide synthetic pathway, may have more complex ramifications on cellular signaling than the use of directed and specific inhibitors under development. Given that 50% of primary acute myelogenous leukemia cells have constitutive activation of the MAPK pathway,42 the use of IMPDH inhibitors in conjunction with other cytotoxic drugs may well lead to enhanced cytotoxic responses.
Prepublished online as Blood First Edition Paper, February 27, 2003; DOI 10.1182/blood-2002-08-2547.
Supported by National Institutes of Health grants CA 64193 (B.S.M.) and GM59767 (L.M.G.). M.H. is supported by the Leukemia Research Foundation.
The publication costs of this article were defrayed in part by page charge payment. Therefore, and solely to indicate this fact, this article is hereby marked “advertisement” in accordance with 18 U.S.C. section 1734.
We thank Dr Carol Beach at the Protein Sequencing Analysis and Macromolecular Structure Analysis Facility, University of Kentucky for analyzing the GTP and ATP levels using HPLC.

This feature is available to Subscribers Only
Sign In or Create an Account Close Modal