Infant acute lymphoblastic leukemia (ALL) is characterized by a high incidence of mixed lineage leukemia (MLL) gene rearrangements, a poor outcome, and resistance to chemotherapeutic drugs. One exception is cytosine arabinoside (Ara-C), to which infant ALL cells are highly sensitive. To investigate the mechanism underlying Ara-C sensitivity in infants with ALL, mRNA levels of Ara-C–metabolizing enzymes were measured in infants (n = 18) and older children (noninfants) with ALL (n = 24). In the present study, infant ALL cells were 3.3-fold more sensitive to Ara-C (P = .007) and accumulated 2.3-fold more Ara-CTP (P = .011) upon exposure to Ara-C, compared with older children with ALL. Real-time quantitative reverse trancriptase–polymerase chain reaction (RT-PCR) (TaqMan) revealed that infants express 2-fold less of the Ara-C phosphorylating enzyme deoxycytidine kinase (dCK) mRNA (P = .026) but 2.5-fold more mRNA of the equilibrative nucleoside transporter 1 (hENT1), responsible for Ara-C membrane transport (P = .001). The mRNA expression of pyrimidine nucleotidase I (PN-I), cytidine deaminase (CDA), and deoxycytidylate deaminase (dCMPD) did not differ significantly between both groups.hENT1 mRNA expression inversely correlated with in vitro resistance to Ara-C (rs = −0.58,P = .006). The same differences concerningdCK and hENT1 mRNA expression were observed between MLL gene–rearranged (n = 14) and germ lineMLL cases (n = 25). An oligonucleotide microarray screen (Affymetrix) comparing patients with MLL gene–rearranged ALL with those with nonrearranged ALL also showed a 1.9-fold lowerdCK (P = .001) and a 2.7-fold higherhENT1 (P = .046) mRNA expression in patients with MLL gene–rearranged ALL. We conclude that an elevated expression of hENT1, which transports Ara-C across the cell membrane, contributes to Ara-C sensitivity in MLLgene–rearranged infant ALL.
Introduction
Although the treatment of childhood acute lymphoblastic leukemia (ALL) has improved tremendously over the last few decades, for some subgroups of patients the prognosis still remains poor. Infants (ie, children 12 months of age or younger) form such a subgroup. Infant ALL is characterized by a high incidence of rearrangements of the mixed lineage leukemia (MLL,ALL-1, or HRX) gene on chromosome band 11q23. The frequency of these MLL gene rearrangements is possibly as high as 75% when detected with molecular techniques.1 The most common MLL abnormalities found in infants with ALL are the translocations t(4;11) and t(11;19) occurring in approximately 70% and 15% of the MLL gene–rearranged cases, respectively.2-5 The immunophenotype of MLLgene–rearranged infant ALL is usually that of an immature precursor B-lineage lacking CD10 expression and coexpressing myeloid-associated antigens. Furthermore, infants with ALL have a poor prognosis compared with older children with ALL, with an event-free survival (EFS) of approximately 35%.6 The most important reason for this poor prognosis is cellular drug resistance. Pieters et al7showed that leukemic cells from infants with ALL are in vitro significantly more resistant, especially to prednisone and L-asparaginase, than cells from older children with ALL. One exception, however, is cytosine arabinoside (Ara-C) to which infant ALL cells are highly sensitive.7 These findings have led to the development of a new treatment protocol for infants with ALL, that is, the INTERFANT-99 protocol.
Ara-C is a deoxycytidine analog that is phosphorylated into its active form cytosine arabinoside triphosphate (Ara-CTP) which competes with deoxycytidine triphosphate (dCTP) for incorporation into DNA. When incorporated, Ara-C blocks DNA synthesis and as a consequence the cell is subjected to programmed cell death (Figure1). Nucleosides and their analogues are hydrophilic molecules and therefore require specialized membrane transport proteins to be transported into cells.8 To permeate the cell membrane, Ara-C is mainly dependent on the human equilibrative nucleoside transporter 1 (hENT1).9,10 Inside the cell, deoxycytidine kinase (dCK) phosphorylates Ara-C to form Ara-CMP, which is thought to be the rate-limiting activation step of Ara-C.11 Subsequently, Ara-CMP is further phosphorylated into Ara-CDP by (deoxy)cytidylate kinase (UMP-CMPK) and finally into its active, cytotoxic form Ara-CTP by nucleotide diphosphate kinases (NDPKs). Pyrimidine nucleotidase I (PN-I) catalyzes the dephosphorylation of Ara-CMP,12 thereby opposing the action of dCK. Cytidine deaminase (CDA) and deoxycytidylate deaminase (dCMPD) convert Ara-C to Ara-U and Ara-CMP to Ara-UMP, respectively, by deaminating the cytosine base. Inactivation of Ara-C and Ara-CMP by these deaminating enzymes decreases the amount of Ara-CTP and thus the cytotoxic effects of Ara-C.13 14
Cytosine arabinoside (Ara-C) metabolism within cells.
Ara-C enters the cell mainly via (1) equilibrative nucleoside transporter 1 (hENT1). Inside the cell, Ara-C is phosphorylated to Ara-CMP by (2) deoxycytidine kinase (dCK). Subsequently, Ara-CMP is phosphorylated to its active form Ara-CTP. Incorporation of Ara-CTP into the DNA during DNA synthesis leads to programmed cell death or apoptosis. Ara-CTP formation can, however, be obstructed. (3) Pyrimidine nucleotidase I (PN-I) inhibits Ara-CTP formation by opposing the action of dCK. (4) Cytidine deaminase (CDA) and (5) deoxycytidylate deaminase (dCMPD) convert Ara-C to Ara-U and Ara-CMP to Ara-UMP, respectively, thereby decreasing the amount of Ara-CTP that can be formed.
The mechanism underlying the remarkable Ara-C sensitivity in infants with ALL is unknown. Hypothetically, increased activation of the prodrug Ara-C to its active, cytotoxic form Ara-CTP caused by aberrant expression of the above-described enzymes may be involved. Accordingly, we determined the mRNA levels of these Ara-C–metabolizing enzymes in a group of 18 infants and 24 children older than 12 months of age diagnosed with ALL, using real-time quantitative reverse transcriptase–polymerase chain reaction (RT-PCR; Taqman) analysis. In addition, we used an oligonucleotide microarray screen15to compare the expression levels of these enzymes in patients withMLL gene–rearranged ALL and patients with conventional ALL.
Patients, materials, and methods
Patient samples
Bone marrow and/or peripheral blood samples from untreated infants (ie, children 12 months of age or younger) initially diagnosed with ALL were collected from the University Hospital Rotterdam/Sophia Children's Hospital and other hospitals participating in the INTERFANT-99 treatment protocol. Samples from initially diagnosed patients with ALL who were older than 12 months of age were obtained from the German COALL study group (Dr G. E. Janka-Schaub, Hamburg, Germany). Within 24 hours after sampling, mononuclear cells were isolated by density gradient centrifugation using Lymphoprep (density 1.077 g/mL; Nycomed Pharma, Oslo, Norway), and centrifuged at 480g for 15 minutes at room temperature. The collected mononuclear cells were washed twice and kept in culture medium consisting of RPMI 1640 medium (Dutch modification without L-glutamine; Gibco BRL, Life Technologies, Breda, The Netherlands), 20% fetal calf serum (FCS; Integro, Zaandam, The Netherlands), 2 mM L-glutamine (Gibco BRL, Life Technologies) 5 μg/mL insulin, 5 μg/mL transferrin, 5 ng/mL sodium selenite (ITS media supplement; Sigma, St Louis, MO), 100 IU/mL penicillin, 100 μg/mL streptomycin, 0.125 μg/mL fungizone (Gibco BRL, Life Technologies), and 0.2 mg/mL gentamycin (Gibco BRL, Life Technologies). Contaminating nonleukemic cells were removed by immunomagnetic beads as described by Kaspers et al.16 All samples contained at least 90% leukemic cells, determined morphologically on May-Grünwald-Giemsa–stained (Merck, Darmstadt, Germany) cytospins. For RNA extraction, a minimum of 5 × 10⁶ cells were lysed in TRIzol reagent (Gibco BRL, Life Technologies) and stored at −80°C until extraction.
In vitro Ara-C cytotoxicity assay
In vitro Ara-C cytotoxicity was determined using the MTT assay as described by Pieters et al.17 Briefly, 100 μL aliquots of cell suspension (1.6 × 10⁵ cells) were cultured in round-bottomed 96-well microtitre plates in the presence of 6 different concentrations of Ara-C (Cytosar, Pharmacia, and Upjohn BV, Woerden, The Netherlands) ranging from 0.009 μg/mL to 10 μg/mL in duplicate. Control cells were cultured in 8 wells without Ara-C. There were 4 wells containing 100 μL culture medium that were used as blanks. After incubating the plates for 4 days at 37°C in humidified air containing 5% CO2, 10 μL of 3-[4,5-dimethylthiazol-2-yl]-2,5-diphenyl tetrazoliumbromide (MTT, 5 mg/ml; Sigma Aldrich, Zwijndrecht, The Netherlands) was added and the plates were incubated for an additional 6 hours under the same conditions. During this final 6-hour incubation, the yellow MTT tetrazolium salt is reduced to purple-blue formazan crystals by viable cells only. The formazan crystals were dissolved by adding 100 μL acidified isopropanol (0.04 N HCl-isopropyl alcohol) and the optical density (OD), which is linearly related to the number of viable cells,18 was measured spectrophotometrically at 562 nm. After subtraction of the blank values, the leukemic cell survival (LCS) was calculated by the following equation: LCS = (ODday 4treated well/mean ODday 4 control wells) × 100%.
Drug sensitivity was assessed by the LC50, the drug concentration lethal to 50% of the cells. Evaluable assay results were obtained when a minimum of 70% leukemic cells was present in the control wells after 4 days of incubation and when the control OD was more than or equal to 0.050.17
Ara-CTP accumulation
Leukemic cells from patients, prepared as described above, were incubated at 37°C for 24 hours in the presence of 1 μM (0.25 μg/mL) of Ara-C. After exposure to Ara-C, cells were washed in drug-free medium, centrifuged for 3 minutes at 5000 rpm, and rapidly frozen and stored at −80°C. Ara-CTP was extracted as described by Noordhuis et al.19 Cell pellets were resuspended in 150 μL ice-cold phosphate-buffered saline (pH 7.4) and subsequently 50 μL of 40% ice-cold trichloroacetic acid (TCA) (wt/vol) was added. The suspension was kept on ice for 20 minutes. After centrifugation for 5 minutes at 13 000 rpm and 4°C, the supernatant was removed and neutralized by adding 400 μL trioctylamine/1,1,2-tri-chloro-trifluorethane (1/4, vol/vol). After further centrifugation for 1 minute, the upper layer (the nucleotide extract) was collected and stored at −20°C. Nucleotides were separated using anion-exchange high-performance liquid chromatography (HPLC)19 on a Partisphere Sax column (Whatman, Clifton, NJ; internal diameter [id] 4.6 mm, length 12.5 cm, particle size 5 μm). A 1000S diode-array detector was set at 280 nm and 254 nm (Applied Biosystems, Foster City, CA) and a Chromeleon V 4.30 data acquisition system (Dionex, Breda, the Netherlands) was used for quantitation of the peaks. Elution was performed isocratically with 0.25 M KH2PO4 containing 0.5 M KCl (pH 4.5) at a flow of 1.5 mL/min. The retention time of Ara-CTP was 5.4 minutes.
RNA extraction and cDNA synthesis
Total cellular RNA was extracted from a minimum of 5 × 10⁶ cells using TRIzol reagent (Gibco BRL, Life Technologies) according to the manufacturer's protocol, except for minor modifications. An additional phenol-chloroform extraction was performed and the isopropanol precipitation at −20°C was facilitated by adding 1 μL (20 μg/mL) glycogen (Roche, Almere, The Netherlands). After precipitation with isopropanol, RNA pellets were dissolved in 20 μL RNAse-free TE-buffer (10 mM Tris-HCl,1 mM EDTA [ethylenediaminetetraacetic acid], pH = 8.0). The RNA was quantitated spectrophotometrically. Following a denaturation step of 5 minutes at 70°C, 1 μg of RNA was reverse transcribed to single-stranded cDNA using a mix of random hexamers (2.5 μM) and oligo dT primers (20 nM). The RT reaction was performed in a total volume of 25 μL containing 0.2 mM of each dNTP (Amersham Pharmacia Biotech, Piscataway, NJ), 200 U Moloney murine leukemia virus reverse transcriptase (M-MLV RT) (Promega, Madison, WI), and 25 U RNAsin (Promega) at 37°C for 30 minutes, 42°C for 15 minutes, and 94°C for 5 minutes. The obtained cDNA was diluted to a final concentration of 8 ng/μL. Samples were stored at −80°C.
Quantitative real-time PCR (Taqman technology)
The mRNA expression levels of dCK, PN-I,CDA, dCMPD, hENT1, and an endogenous housekeeping gene encoding for glyceraldehyde-3-phosphate dehydrogenase(GAPDH) as a reference, were quantified using real-time PCR analysis (Taqman chemistry) on an ABI Prism 7700 sequence detection system (PE Applied Biosystems). Amplification of specific PCR products was detected using dual-fluorescent nonextendable probes labeled with 6-carboxyfluorescein (FAM) at the 5′ end and with 6-carboxytetramethylrhodamine (TAMRA) at the 3′ end. All primers and probe combinations (Table 1) were designed using the OLIGO 6.22 software (Molecular Biology Insights, Cascade, CO) and purchased from Eurogentec (Seraing, Belgium). All primers had a melting temperature (Tm; nearest neighbor method) of 65°C ± 1°C. All internal probes had a Tmof 75°C ± 1°C. All PCRs performed with comparable efficiencies of E more than or equal to 95%. The quantitative real-time PCR was performed in a total reaction volume of 50 μL containing 1x Taqman buffer A (Applied Biosystems), 4 mM MgCl2, 200 μM of each dNTP (Amersham Pharmacia Biotech), 300 nM forward and reverse primers, 50 nM dual-labeled fluorogenic internal probe, 1.25 U AmpliTaq Gold DNA polymerase (Applied Biosystems), and 40 ng cDNA (see “RNA extraction and cDNA synthesis”) from each patient as a template, in MicroAmp optical 96-well plates covered with MicroAmp optical caps (Applied Biosystems). Samples were heated for 10 minutes at 95°C and amplified for 40 cycles of 15 seconds at 95°C and 60 seconds at 60°C. A serial dilution of cDNA derived from a cell line RNA-pool (CEM, K562, and 2 Epstein-Barr virus [EBV]–transformed lymphoblastoid B-cell lines) in dH2O was amplified in parallel as a control to verify amplification efficiency within each experiment. Since all PCRs performed with equal efficiencies, relative mRNA expression levels ofdCK, PN-I, CDA, dCMPD, andhENT1 for each patient can directly be normalized for input RNA against the GAPDH expression of the patient. The relative mRNA expression levels of the target genes in each patient were calculated using the comparative cycle time (Ct) method.20 Briefly, the target PCR Ct value (ie, the cycle number at which emitted fluorescence exceeds 10 × the standard deviation (SD) of baseline emissions as measured from cycles 3 to 15) is normalized to theGAPDH PCR Ct value by subtracting theGAPDH Ct value from the target PCR Ct value, which gives the Δ Ct value. From this Δ Ct value, the relative mRNA expression level to GAPDH for each target PCR can be calculated using the following equation: relative mRNA expression = 2−(Ct target–Ct GAPDH)× 100%.
Probe and primer combinations used for the quantitative real-time PCR
| Gene . | Sequence . |
|---|---|
| dCK | |
| Forward | 5′-TGC AGG GAA GTC AAC ATT-3′ |
| Reverse | 5′-TCC CAC CAT TTT TCT GAG-3′ |
| Probe | 5′-(FAM)-TAA ACA ATT GTG TGA AGA TTG GGA AG-(TAMRA)-3′ |
| CDA | |
| Forward | 5′-GGA GGC CAA GAA GTC AG-3′ |
| Reverse | 5′-GAC GGC CTT CTG GAT AG-3′ |
| Probe | 5′-(FAM)-CAA CAT AGA AAA TGC CTG CTA CCC-(TAMRA)-3′ |
| dCMPD | |
| Forward | 5′-AAT GGG TGC AGT GAT GAC-3′ |
| Reverse | 5′-CTT AGC GCA TTC ATT ACA AG-3′ |
| Probe | 5′-(FAM)-ATC ATG AAC AAA AAT TCG ACC GAT-(TAMRA)-3′ |
| PN-I | |
| Forward | 5′-AAT CGG CGA TGT ACT AGA G-3′ |
| Reverse | 5′-CAT CTG CCA TTC TTA AGT CTC-3′ |
| Probe | 5′-(FAM)-ATG AAA CTG GGG TGC TCA AAG GA-(TAMRA)-3′ |
| hENT1 | |
| Forward | 5′-TGT TTC CAG CCG TGA CT-3′ |
| Reverse | 5′-CAG GCC ACA TGA ATA CAG-3′ |
| Probe | 5′-(FAM)-CAG CAC CTG GGA ACG TTA CTT-(TAMRA)-3′ |
| GAPDH | |
| Forward | 5′-GTC GGA GTC AAC GGA TT-3′ |
| Reverse | 5′-AAG CTT CCC GTT CTC AG-3′ |
| Probe | 5′-(FAM)-TCA ACT ACA TGG TTT ACA TGT TCC AA-(TAMRA)-3′ |
Oligonucleotide microarray screen (Affymetrix)
A detailed material and method section for the oligonucleotide microarray screen (Affymetrix) comparing patients with MLLgene–rearranged ALL and those with nonrearranged ALL has been described elsewhere.15 In addition, further details regarding patient samples and data analysis can be found athttp://www.dfci.harvard.edu/korsmeyer/MLL.htm.
Statistics
Differences in the distribution of Ara-C LC50 values and mRNA expression between the 2 groups were analyzed using the Mann-Whitney U test. Correlations between mRNA expression of Ara-C–metabolizing enzymes and Ara-C LC50 values were calculated using the Spearman rank correlation test. Statistical tests were performed at a 2-tailed significance level of 0.05.
Results
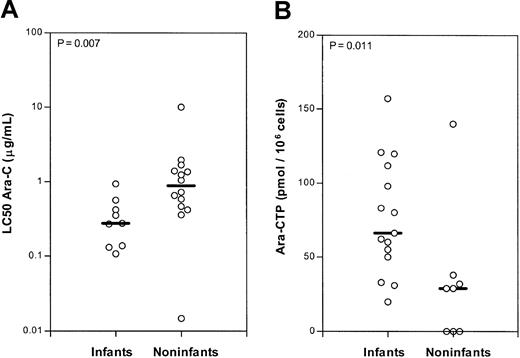
Leukemic cells from infants (n = 18) and older children (n = 24) newly diagnosed with ALL were used. Patient characteristics are listed in Table 2. The in vitro Ara-C cytotoxicity was successfully tested in 9 infants and 14 samples from older children with ALL. Assay failure was mostly due to a poor survival of control leukemic cells, that is, less than 70% survival of leukemic cells after 4 days of culture in the absence of Ara-C, or an OD at 562 nm of less than 0.050. Leukemic cells from infants with ALL were significantly (P = .007) more sensitive (3.3-fold) to Ara-C than were cells from older children with ALL (Figure2) with a median LC50 of 0.27 μg/mL Ara-C for the samples from infants and 0.89 μg/mL Ara-C for the samples from older children. This is in concordance with results published before.7 Furthermore, we determined Ara-CTP accumulation upon a 24-hour exposure to 1 μM (0.25 μg/mL) Ara-C in 15 samples from infants with ALL and 8 samples from older children with ALL. In 2 of the samples from older children, a limited number of cells were available in which no Ara-CTP was detectable. These samples were considered to contain less than 30 pmol Ara-CTP per million leukemic cells. In leukemic cells from infants, 2.3-fold more Ara-CTP accumulated (P = .011) (Figure2).
Patient characteristics
| . | Infants . | Older children . |
|---|---|---|
| Number (n) | 18 | 24 |
| Sex (male-female ratio), % | 67:33 | 67:33 |
| Age, y (median; P25-P75)* | 0.45 (0.198-0.65) | 5.5 (2.93-8.3) |
| Immunophenotype, % | ||
| Pro-B ALL | 56 | 0 |
| Pre-B ALL | 17 | 12 |
| c-ALL | 5 | 71 |
| T-ALL | 0 | 17 |
| Unknown | 22 | 0 |
| MLL gene status, % | ||
| MLL germ line | 11 | 100 |
| MLL rearranged | 78 | 0 |
| Unknown | 11 | 0 |
P25-P75 indicates 25th and 75th percentiles.
Ara-C cytotoxicity and Ara-CTP accumulation.
(A) Ara-C sensitivity (LC50 Ara-C in μg/mL) of leukemic cells from infants (n = 9) and older children (noninfants) (n = 14) with newly diagnosed acute lymphoblastic leukemia (ALL). (B) Ara-CTP accumulation (pmol/106 cells) in leukemic cells from infants (n = 15) and older children (n = 8) with ALL upon ex vivo exposure to 1 μM of Ara-C for 24 hours. The lines indicate the median values; and ○, individual patients.
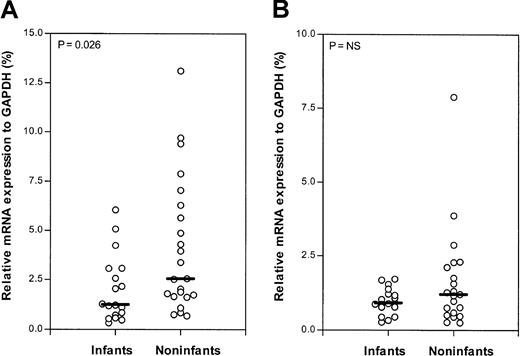
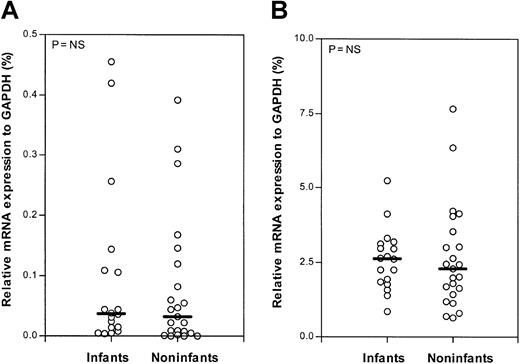
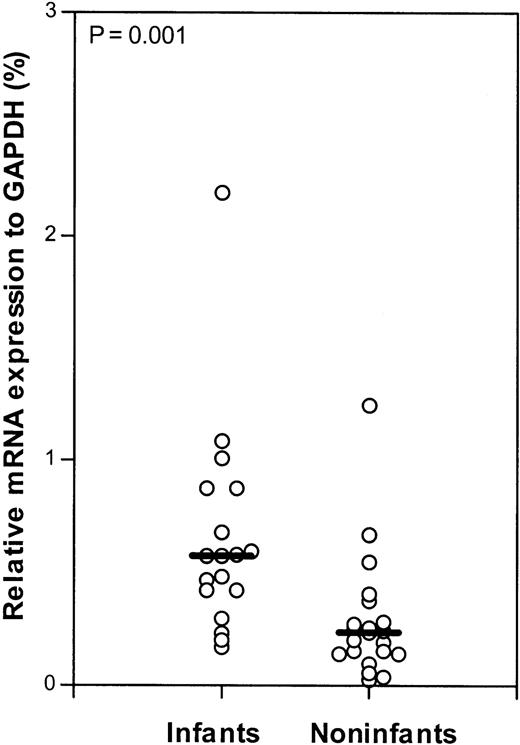
Using quantitative real-time PCR (Taqman technology), the mRNA expression levels of dCK, CDA, dCMPD,PN-I, and hENT1 were measured in 18 samples from infants with ALL. In 23 samples from older children with ALL, the mRNA expression levels of dCK, CDA,and dCMPD were determined. From 21 older childrenPN-I and hENT1 mRNA expression was determined. Infants expressed significantly less dCK mRNA (P = .026) compared with older children with ALL. The difference in the median relative dCK mRNA expression in the infant and older children groups is 2-fold. No significant difference in mRNA expression of PN-I, an enzyme opposing dCK activity, was found (Figure 3). Also, no significant differences were found in the mRNA expression of the deaminating (Ara-C–inactivating) enzymes CDA anddCMPD between infants and older children (Figure4). However, mRNA of the nucleoside transporter hENT1, on which Ara-C is mainly dependent to cross the cell membrane, was significantly 2.5-fold higher expressed (P = .001) in infants compared with older children with ALL (Figure 5).
Relative dCK and PN-I mRNA expression (Taqman).
Relative mRNA expression of deoxycytidine kinase (dCK; A) and pyrimidine nucleotidase (PN-I; B) in infants and older children (noninfants) with ALL. The lines indicate the median values; ○, individual patients; and NS, not significant.
Relative dCK and PN-I mRNA expression (Taqman).
Relative mRNA expression of deoxycytidine kinase (dCK; A) and pyrimidine nucleotidase (PN-I; B) in infants and older children (noninfants) with ALL. The lines indicate the median values; ○, individual patients; and NS, not significant.
Relative CDA and dCMPD mRNA expression (Taqman).
Relative mRNA expression of cytidine deaminase (CDA; A) and deoxycytidylate deaminase (dCMPD; B) in infants and older children (noninfants) with ALL. The lines indicate the median values; ○, individual patients; and NS, not significant.
Relative CDA and dCMPD mRNA expression (Taqman).
Relative mRNA expression of cytidine deaminase (CDA; A) and deoxycytidylate deaminase (dCMPD; B) in infants and older children (noninfants) with ALL. The lines indicate the median values; ○, individual patients; and NS, not significant.
Relative hENT1 mRNA expression (Taqman).
Relative mRNA expression of the human equilibrative nucleoside transporter 1 (hENT1) in infants and older children (noninfants) with ALL. The lines indicate the median values; and ○, individual patients.
Relative hENT1 mRNA expression (Taqman).
Relative mRNA expression of the human equilibrative nucleoside transporter 1 (hENT1) in infants and older children (noninfants) with ALL. The lines indicate the median values; and ○, individual patients.
Excluding the infant ALL samples from which the MLL status is unknown (n = 2) and transferring the infant ALL samples with germ line MLL genes (n = 2) to the group of older children (or rather MLL germ line; Table 2), results in similar differences. Patients with MLL gene–rearranged infant ALL express significantly 1.6-fold less dCK mRNA (P = .043) and 2.5-fold more hENT1 mRNA (P = .001) compared with patients with ALL with germ lineMLL genes.
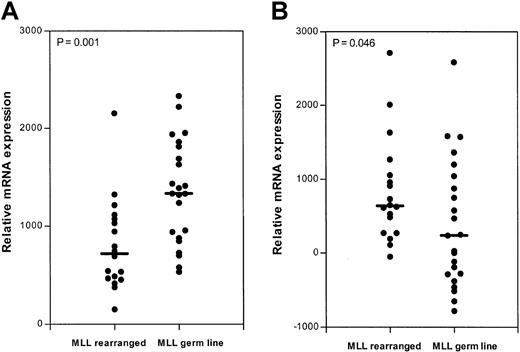
The oligonucleotide microarray screen comparing a group of patients with MLL gene–rearranged ALL (n = 18), consisting of 15 infants and 3 older children, and a group of children older than 12 months of age with conventional ALL (n = 23),15 revealed similar results. No significant differences in mRNA expression between patients with MLL gene–rearranged ALL and patients with ALL without MLL gene abnormalities were found for the deaminating enzymes CDA and dCMPD. In contrast, the relative gene expression of dCK was significantly (P = .001) lower (1.9-fold) and hETN1expression significantly (P = .046) higher (2.7-fold) in patients with MLL gene–rearranged ALL (Figure6). The expression of PN-1 was not measured because no oligonucleotides representing this gene are present on the Affymetrix microarray chip used in this screen.
Relative dCK and hENT1 mRNA expression (Microarray).
Deoxycytidine kinase (dCK; A) and equilibrative nucleoside transporter 1 (hENT1; B) mRNA expression in patients with MLLgene–rearranged (n = 18) and MLL germ line (n = 23) ALL measured on oligonucleotide microarrays. The lines indicate the median values; ●, individual patients.
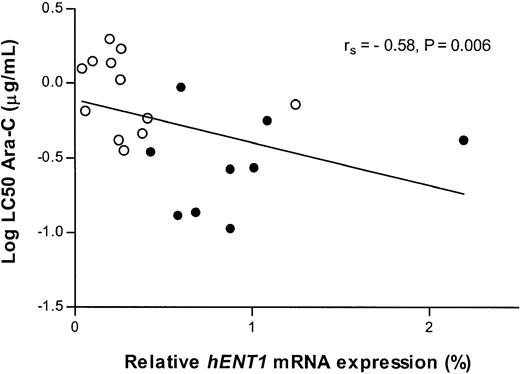
The hENT1 mRNA expression inversely correlates with the LC50 values of Ara-C (rs = -0.58,P = .006) (Figure 7). In other words, Ara-C sensitivity correlates with increasedhETN1 mRNA expression. In contrast, we found that increaseddCK mRNA expression tends to correlate, although weakly, with increased resistance to Ara-C (rs = 0.41,P = .052).
Relation between Ara-C cytotoxicity andhENT1 mRNA expression (Taqman).
Correlation between the Ara-C cytotoxicity (log LC50 in μg/mL) and the relative mRNA expression of the human equilibrative nucleoside transporter 1 (hENT1). ○ indicates individual infant ALL patients; and ●, older children (noninfants) with ALL.
Discussion
Infant ALL is characterized by a high incidence of MLLgene rearrangements and a poor treatment outcome compared with older children with ALL. The poor prognosis for infants with ALL is associated with rearrangements of the MLLgene,4,21,22 and in vitro resistance to prednisolone and asparaginase.7 However, infant ALL cells are highly sensitive to Ara-C.7 This knowledge has recently been implemented in a new international collaborative treatment protocol (INTERFANT-99) for infants with ALL in order to give a more specific treatment to patients with infant ALL.
The necessity of an exclusive treatment protocol for infants diagnosed with ALL has recently been stressed by a gene profiling study comparing (mostly) infants with MLL gene–rearranged ALL and older children with conventional ALL and acute myeloid leukemia (AML) withoutMLL gene rearrangements, using oligonucleotide microarrays.15 This resulted in a gene expression profile for patients with MLL gene–rearranged ALL that is clearly distinguishable from the gene profiles found for patients with conventional ALL and AML. This finding suggests that MLLgene–rearranged leukemia needs to be classified as a unique leukemia for which urgently molecular targets need to be found to explore the possibilities of developing an appropriate treatment protocol for these patients.
In the present study we analyzed the mechanism of Ara-C sensitivity in infant MLL gene–rearranged ALL. Because aberrant expression of key enzymes in Ara-C metabolism (Figure 1) might explain the remarkable sensitivity to Ara-C in infants with ALL, we used quantitative real-time PCR analysis (Taqman chemistry) and an oligonucleotide microarray screen15 to determine the mRNA levels of several Ara-C–metabolizing enzymes in infants and in older children with newly diagnosed ALL. Quantitative RT-PCR analysis revealed that infants with ALL express significantly 2-fold lessdCK and 2.5-fold more hENT1 mRNA compared with older children with ALL. No significant differences in PN-I,CDA, and dCMPD mRNA expression were observed. ThehENT1 mRNA expression correlated with sensitivity to Ara-C, whereas dCK mRNA expression tends to correlate, although weakly, with Ara-C resistance. In approximately 80% of the samples from patients with infant ALL, the MLL gene is rearranged (Table 2). Comparison between MLLgene–rearranged infants and MLL germ line patients revealed the same differences in dCK and hENT1 mRNA expression as observed for the infant versus older children groups. Similar results were obtained from the oligonucleotide microarray screen. Patients with MLL gene–rearranged ALL expressed 1.9-fold less dCK and 2.7-fold more hENT1 mRNA compared with children with ALL without MLL gene rearrangements. Because MLL gene rearrangements are strongly associated with infant ALL, it is diffecult to determine whether the observed differences are related to MLL gene rearrangements or to infancy or even to both. To answer this question, a large group of rather rare MLL germ line infant ALL samples is needed. However, since infant ALL is so strongly associated with MLLgene rearrangements, observations found in a group of infants with ALL shall therefore resemble a group of MLL gene–rearranged ALL samples and vice versa.
Deoxycytidine kinase (dCK) generally phosphorylates deoxycytidine (dCyd) to form dCMP, but also phosphorylates a variety of deoxycytidine analogues, including Ara-C.23 Reduced dCK mRNA expression and deficiency of functional dCK has often been associated with Ara-C resistance.24-27 In addition, it has been demonstrated that relapsed ALL and AML patients show decreaseddCK mRNA expression28 and that initial childhood ALL patients expressing low levels of dCK mRNA are more likely to relapse than patients expressing higher levels ofdCK mRNA.29 After Ara-C is phosphorylated by dCK, Ara-CMP is further phosphorylated to Ara-CDP by (deoxy)cytidylate kinase (UMP-CMPK) and finally to its active, cytotoxic form Ara-CTP by nucleotide diphosphate kinases (NDPKs). Because dCK has the lowest concentration of these 3 kinases, it is thought to be the rate-limiting enzyme in the activation of Ara-C.11 However, we show that infants with ALL express significantly 2-fold less dCK mRNA than older children with ALL, whereas no significant differences inPN-I mRNA expression was found. Since PN-I opposes the action of dCK by dephosphorylating Ara-CMP,12 the net phosphorylation of Ara-C into Ara-CMP may be considerably lower in infants with ALL. Yet, leukemic cells from these patients are significantly 3.3-fold more sensitive to Ara-C and 2.3-fold more Ara-CTP was formed upon exposure to Ara-C. Moreover, we observed thatdCK mRNA expression tends to correlate, although weakly, with the obtained LC50 values for Ara-C. In other words, higher dCK mRNA expression tends to correlate with increased resistance to Ara-C. These data suggest that dCK is not a rate-limiting factor in the activation of Ara-C in infant ALL cells, which may support the findings of White et al10 (see below). Another possibility could be that dCK is posttranscriptionally regulated and that despite the lower mRNA expression, the amount of protein or the activity of the enzyme in infant ALL cells are comparable with, or even higher than in cells from older children with ALL.
Cytidine deaminase (CDA) and deoxycytidylate deaminase (dCMPD) both inhibit the formation of Ara-CTP by converting Ara-C to Ara-U and Ara-CMP to Ara-UMP, respectively. Increased CDA and dCMPD activity in several cell lines transfected with human CDA or humandCMPD cDNA has been shown to confer resistance to Ara-C.13,14,30,31 Furthermore, CDA activity proved to be significantly higher in patients with Ara-C refractory AML than in untreated patients.32 Our results did not show significant differences in the mRNA expression of CDA anddCMPD between infants and older children with ALL, suggesting that Ara-C sensitivity in infant ALL cannot be ascribed to decreased inactivation of Ara-C by these enzymes.
Nucleosides and their analogues are hydrophilic molecules, and therefore dependent on specialized transport proteins to permeate cell membranes. Ara-C membrane transport is mainly facilitated by a nitrobenzylmercaptopurine riboside (NBMPR)–sensitive nucleoside transport system.9,10,33 Since hENT1 is the only known NBMPR-sensitive nucleoside transporter capable of transporting pyrimidine nucleosides over the cell membrane,8 it is reasonable to assume that Ara-C mainly enters the cell via hENT1. In this study we show that infants with ALL express significantly 2.5-fold more hENT1 mRNA compared with older children with ALL. In addition, we demonstrate a strong correlation between hENT1mRNA expression and Ara-C sensitivity. Others showed that inhibition of Ara-C membrane transport with NBMPR confers Ara-C resistance in cells from both patients with ALL and those with AML.9,10 33 Taken together, these data suggest that Ara-C sensitivity in infant ALL can, at least to some extent, be explained by a higher hENT1 mRNA expression, possibly resulting in more Ara-C membrane transport sites and thus an elevated uptake of Ara-C into the cell. Furthermore, these data suggest thathENT1 mRNA expression may be a valuable predictor of Ara-C sensitivity in both infant and older ALL patients.
Our observation that Ara-C sensitivity may be a consequence of increased hENT1 mRNA expression and the finding that dCK apparently is not rate-limiting in the formation of Ara-CTP in infants with MLL gene–rearranged ALL is in concordance with the findings of White and coworkers.10 White et al showed that Ara-C is phosphorylated by dCK almost as rapidly as it enters the cell at extracellular Ara-C concentrations below 1 μM, whereas at high Ara-C concentrations (> 10 μM) unphosphorylated Ara-C accumulates inside cells. Thus, at Ara-C concentrations less than 1 μM, the rate of Ara-C accumulation inside the cell is primarily determined by the transport rate or rather the number of transporter sites on the cell membrane (ie, hENT1 expression). At extracellular Ara-C concentrations exceeding 10 μM, dCK becomes the rate-limiting factor.10 The median LC50 values for Ara-C for the infant and older children groups in this study are 0.27 μg/mL (1 μM) and 0.89 μg/mL (3.6 μM) Ara-C, respectively. Therefore, it is likely that the rate of Ara-C influx via hENT1 and not the level of dCK determines the amount of Ara-C phosphorylation by dCK and subsequently the sensitivity to Ara-C in these patient samples, even if dCK is posttranscriptionally regulated and the actual protein levels or enzyme activity in the infant samples are comparable or even higher than in those in cells from older children. Since infants with ALL who enter the INTERFANT-99 treatment protocol receive both low-dose and high-dose Ara-C, corresponding to plasma levels less than 1 μM and more than 10 μM, respectively,34 35 these patients may benefit from their increased hENT1 expression at least during treatment with low to normal doses of Ara-C.
Based on these considerations we conclude that the observed increase inhENT1 mRNA expression contributes to the remarkable sensitivity to Ara-C in infants diagnosed with ALL.
We wish to express our gratitude to the members of the INTERFANT-99 and the German COALL study groups for their support of this study by providing fresh leukemic samples.
Prepublished online as Blood First Edition Paper, October 24, 2002; DOI 10.1182/blood-2002-05-1600.
Supported by a grant from the Sophia Foundation for Medical Research (SSWO grant 296).
The publication costs of this article were defrayed in part by page charge payment. Therefore, and solely to indicate this fact, this article is hereby marked “advertisement” in accordance with 18 U.S.C. section 1734.
References
Author notes
Ronald W. Stam, University Hospital Rotterdam/Sophia Children's Hospital/Erasmus MC, Laboratory of Pediatrics, Division of Oncology/Hematology, Rm Ee 15-14, Dr Molewaterplein 50, 3015 GE Rotterdam, The Netherlands; e-mail:stam@kgk.fgg.eur.nl.


This feature is available to Subscribers Only
Sign In or Create an Account Close Modal