Abstract
Extracellular superoxide dismutase (SOD3) is the primary extracellular enzymatic scavenger of superoxide (
Introduction
Renal metabolism requires roughly 10% of basal oxygen (O2) consumption,1 and the kidney produces reactive oxygen species (ROS), such as superoxide anion (
To maintain O2 homeostasis, a number of genes are up-regulated at low O2 tension via signaling that activates transcription (eg, via hypoxia-inducible transcription factor 1 [HIF-1]). HIF-1 is crucial in sensing hypoxia and integrating the adaptive response via transcription of O2-sensitive genes.12,13 The physiologic factors that link O2 availability to transcription relate broadly to ROS abundance in the cell. ROS are implicated in HIF-1 signal transduction, particularly in the regulation of HIF-1α activity in hypoxia by signals such as NO·, cytokines, and growth factors.14,15 HIF-1α stability is controlled by binding of von Hippel Lindau factor, which targets it for ubiquitination and degradation.16,17 This HIF-1α destabilization pathway requires O2-dependent prolyl-4-hyroxylase activity, which can be stimulated by ROS. When O2 partial pressure (PO2) decreases, less
The mammalian kidney serves adaptation to hypoxia by producing erythropoietin (EPO), the principal regulator of erythropoiesis. The stimulus for EPO production is low PO2 from anemia or hypoxia, which markedly increases EPO mRNA and active EPO expression in renal cells. EPO production in hypoxia involves O2 sensing by heme protein.18 EPO expression is regulated in part by HIF-1, but the mechanisms by which changes in PO2 are translated to appropriate renal EPO production are not fully understood. Recently a nicotinamide adenine dinucleotide phosphate (NADPH) oxidase, a source of
The clear physiologic importance of
Materials and methods
Animals
The protocol was preapproved by the Duke University Institutional Animal Care and Use Committee. SOD3–knock-out (KO) mice (initial background C57BL/6 × 129/SV) were derived from a breeding colony at Umea University.11 SOD3 KO mice were backcrossed 10 times into C57BL-6J, and C57BL-6J mice were used as Wt controls. The SOD3 KO phenotype is completely without SOD3 activity but has unaltered activities of CuZn-SOD, Mn-SOD, catalase, glutathione peroxidase, glutathione reductase, and glucose-6-phosphate dehydrogenase.11
Fresh kidneys were removed from mice killed by sodium pentobarbital injection (100 mg/kg intraperitoneally) and frozen at –80° C until use. For immunochemistry and in situ hybridization, the circulation was perfused through the heart with 4% paraformaldehyde in 0.1 M phosphate buffer (pH 7.4). The kidneys were dissected and placed in fixative for 4 hours at 4° C and then transferred to 2% paraformaldehyde at 4° C until paraffin embedding, sectioning, and staining.
Hypoxia exposures
Mice were exposed to hypoxia in an altitude chamber at 17 000 to 18 000 feet (∼395 mmHg) above sea level for 2, 6, 12, and 24 hours for molecular studies and for 1, 3, and 5 days for physiologic assessment. At the end of the exposures, animals were anesthetized with sodium pentobarbital (50 mg/kg intraperitoneally) and blood was collected from the posterior vena cava to measure the hematocrit (Instrumentation Laboratories Model 1640 analyzer; Lexington, MA). EPO was measured using plasma dot blot and densitometry, and plasma nitrite/nitrate was measured as an indicator of NOx production using the Bioxytech NO assay kit (OXIS International, Portland, OR).
Isolation of proximal tubules
Adult B57BL/6 mice (25-30 g) were anesthetized, and the descending aorta cannulated and perfused with 10 mL of 37° C Dulbecco modified Eagle medium (DMEM; Gibco BRL, Grand Island, NY) to clear the blood. The kidneys were harvested and divided, and the medulla was dissected carefully. Proximal tubules were isolated by cutting the cortex into small pieces and digesting it in Krebs-Henseleit supplemented with 0.1% collagenase and 5% bovine serum albumin (BSA) under 95% O2/5% CO2 at 37° C for 20 minutes.22 After digestion, the suspension was filtered through 50-mesh gauze and spun on a 40% Percoll cushion for 30 minutes at 4° Cto 8° C to separate the tissue into 4 distinct bands.22 The lowermost band enriched in PT was collected, suspended in DMEM, and centrifuged for 10 minutes to obtain a preparation of 95% PT.
RNA probes
Renal cytoplasmic RNA was extracted from B57BL/6 mice using the TRIzole RNA isolation kit (Gibco BRL). RNA concentration was determined by absorbance at 260 nm. Mouse SOD3 (Genbank acc. no. BC010975) and EPO (Genbank acc. no. NM-007942) cDNA were generated by reverse-transcription–polymerase chain reaction (RT-PCR) with oligonucleotide primers specific for mouse SOD3 (MSODSP6, 5′-SP6-GTGTCCCAAGACAATC-3′ and MSODT7, 5′-T7-GTGCTATGGGGACAGG-3′) or EPO (ISH-epo6, 5′-SP6-CCACCCTGCTGCTTTTACTC and ISH-epo7, T7-5′-CTCAGTCTGGGACCTTCTGC) to amplify 243 bp and 166 bp of mouse SOD3 and EPO cDNA, respectively. Amplified fragments were cleaned (PCR purification kit; Promega, Madison, WI), and RNA transcripts were generated using the T7 (antisense) or SP6 (sense) polymerase and labeled with digoxigenin-11–uridine triphosphate (UTP; Boehringer Mannheim, Mannheim, Germany).
Northern analysis
RNA was extracted with TRIzol reagent (Life Technologies, Grand Island, NY), separated on 1.2% agarose gels, stained, and photographed. RNA was transferred to nylon membranes (Nytran Super Charge; Schleicher and Schuell, Dassel, Germany), and ultraviolet (UV) cross-linked. The mouse SOD3 probe and 243-bp PCR products were radiolabeled with [α-32P] deoxycytosine triphosphate (dCTP) using random primers and Ready-to-Go DNA labeling beads (Amersham, Arlington Heights, IL). Northern hybridization was done using QuickHyb (Stratagene, Carlsbad, CA). After hybridization, membranes were washed twice in 0.2% sodium chloride, sodium citrate (SSC; 1 × SSC is 0.15 M NaCl/0.015 M sodium citrate) containing 0.1% (wt/vol) sodium dodecyl sulfate (SDS) at room temperature for 15 minutes then in 0.1% SSC/0.1% SDS at 60° C for 45 minutes. The membranes were exposed to X-ray film (Kodak, Rochester, NY) to develop autoradiograms.
In situ hybridization
Sections of formalin-fixed, paraffin-embedded control and 6-hour hypoxic kidney were probed with SOD3 or EPO antisense (test) and sense (control) single-stranded cRNA probes. All chemicals were RNase-free, and solutions and materials were treated with 0.1% (vol/vol) diethylpyrocarbonate before use. Tissue sections were hydrated by rinsing in serial dilutions of ethanol and then in phosphate-buffered saline (PBS) at pH 7.4. Proteinase K (100 μg/mL) in 50 mM EDTA (ethylenediaminetetraacetic acid) and 0.1 M Tris (hydroxymethyl) aminomethane–HCl, pH 8.0, was applied to each section (100 μL/section) for 30 minutes at room temperature. The sections were washed in 0.2 M Tris and 0.1 M glycine (Tris-Glycine) for 10 minutes and prehybridized at 45° C for 2 hours in a buffer of 0.6 M NaCl, 10 mM Tris-Cl, pH 7.5, 1 mM EDTA, 1 × Denhardt reagent, 0.5% (wt/vol) sheared DNA, 0.5% (wt/vol) yeast total RNA, and 0.005% (wt/vol) yeast tRNA (Boehringer Mannheim). Probes were denatured at 65° C for 5 minutes and diluted in the modified hybridization buffer, substituting 0.01% (wt/vol) sheared DNA and 0.05% (wt/vol) yeast total RNA, and adding 5% (wt/vol) dextran sulfate and 50 ng labeled cRNA (diluted 1:1 with deionized formamide). Sections were hybridized with their probes (100 μL/section) for 16 to 20 hours at 45° C. Separate sections on each slide were incubated with mouse SOD3 or EPO antisense or sense probes. To remove nonspecifically bound probes, slides were washed stringently in SSC at 60° C. SOD3 hybridization signals were visualized with antidigoxigenin antibody–alkaline phosphatase conjugates using 5-bromo-4-chloro-3-indoylphosphate and nitro-blue tetrazolium as chromogens. EPO hybridization signals were visualized with anti–digoxigenin-rhodamine conjugates. Renal EPO localization was confirmed using anti–digoxigenin-POD conjugates developed with diaminobenzidine (DAB).
Immunocytochemistry
Kidney sections (4-6 μm) of normal and hypoxic animals were treated with 10% goat serum for 30 minutes to minimize nonspecific staining. These sections were incubated with 0.1% trypsin for 30 minutes and washed with Tris-Glycine buffer (pH 7.6). The sections were incubated with polyclonal rabbit antimouse SOD3 antibody (gift from Dr Tim Oury, University of Pittsburgh) or goat anti-EPO antibody (Santa Cruz Biotechnology, Santa Cruz, CA) at room temperature for 2 hours. After washing with PBS-T, sections were immunostained by the peroxidase-antiperoxidase (PAP) or by cyanine 3 (Cy3) and anti–fluorescein isothiocyanate (FITC) antibodies and visualized with light microscopy or by confocal microscopy (Zeiss LSM; Carl Zeiss, Thornwood, NY). For double-labeling experiments, images were acquired in green and red channels, and noise levels were minimized using line scan averaging. Preimmune rabbit serum and preabsorbed antibodies were used as controls.
Western analysis
Fresh whole kidneys, isolated proximal tubules, cortex, and medulla were homogenized in 10 vol of ice-cold 50 mM potassium phosphate buffer (pH 7.4) with 0.3 M KBr and antiproteolytic agents. Protein concentration was determined and 20 μg sample protein was electrophoresed on 12% SDS–polyacrylamide gel electrophoresis (PAGE) gels and electroblotted onto Immobilon-P membranes (Millipore, Bedford, MA). The membranes were rinsed with PBS and probed with antimouse SOD3 polyclonal antibody and endothelial nitric oxide synthase (eNOS) antibody (Transduction Labs, Lexington, KY). For HIF-1α and HIF-1β, nuclear and cytoplasmic extracts were prepared using NE-PER Nuclear and Cytoplasmic Extraction Reagents (Pierce, Rockford, IL). Membranes were probed with mouse anti–HIF-1α monoclonal antibody (1 μg/mL; Transduction Labs) or mouse anti–HIF-1β monoclonal antibody (Santa Cruz Biotechnology). Antirabbit, antimouse, or antigoat horseradish peroxidase–conjugated secondary antibodies (Jackson Laboratories, West Grove, PA) were used (1:5000 dilution) for detection by chemiluminescence, and blots were quantified using ImageQuant software (Molecular Dynamics, Sunnyvale, CA). Protein loading was confirmed by stripping the membranes and reprobing with antibody against β-actin (Sigma, St Louis, MO).
RT-PCR
Total RNA (1 μg) was reverse transcribed with random primers using the reverse-transcription system (Promega). PCR was performed in a final volume of 50 μL containing 100 ng cDNA template, 0.4 mM of each primer (Table 1), 0.2 mM of each deoxynucleoside triphosphates (dNTPs), 10 mM Tris-HCl (pH 9.0), 50 mM KCl, 0.1% Triton X-100, 1.5 mM MgCl2, and 2.5 U Taq DNA polymerase (Promega). PCR was optimized at 15 to 29 cycles of 30-second denaturation at 94° C, 30-second annealing at 62° C, followed by 30-second extension at 72° C. Amplicons were visualized on 2% agarose gels containing SYBR Green (FMC Bioproducts, Rockland, ME) and quantified by densitometry using image analysis software (Bio-Rad, Hercules, CA). EPO or NOX4 was coamplified with ribosomal 18S RNA (amplicon: 324 bp). For EPO and NOX4 duplex, PCR was processed at 2 ratios of 18S primers/competimer: 1:9 and 2:8. To control 18S RNA amplification, we used Quantum RNA alternate 18S RNA internal standard (Ambion, Austin, TX) including the competimer to modulate the amplification efficiency of template without affecting other targets. For EPO and NOX4, PCR was optimized and the product was measured in the exponential phase of PCR by visualization of SYBR Green–stained gels. Results were expressed as the mean of the ratio of optical density (OD) of EPO or NOX4 amplicons to the OD of the 18S amplicon.
Primer sequences and conditions for RT-PCR
Gene . | Sense (5′-3′) . | Antisense . | Annealing temperature, °C . |
|---|---|---|---|
| EPO | ATCTGCGACAGTCGAGTTCT | GTATCCACTGTGGTGTTCG | 58 |
| NOX4 | CAGCAAGATACCGAGATG | CTGGCTTATTGCTCCGGA | 60 |
Gene . | Sense (5′-3′) . | Antisense . | Annealing temperature, °C . |
|---|---|---|---|
| EPO | ATCTGCGACAGTCGAGTTCT | GTATCCACTGTGGTGTTCG | 58 |
| NOX4 | CAGCAAGATACCGAGATG | CTGGCTTATTGCTCCGGA | 60 |
Glutathione and lipid hydroperoxide measurements
Total glutathione (GSH) and glutathione disulfide (GSSG) content in kidney homogenate was determined using an enzymatic recycling assay.23 GSSG levels were determined after derivatization of GSH by 2-vinylpyridine. Lipid peroxidation was assessed as malondialdehyde (MDA) content in homogenate using a kit (Calbiochem, La Jolla, CA).
Measurement of 3-nitrotyrosine (3-NTyr)
Tissues were homogenized in 0.1 M NaOAC (pH 7.2) and centrifuged briefly to pellet nuclei and heavy particulates. Supernatants were collected, protein concentrations were determined, and proteolysis was performed.24 For high-performance liquid chromatography–electrochemical receptor (HPLC-ECD) analysis of 3-NTyr, an electrochemical detector (ESA 5011) system was used.24 The detector potential was + 0.8 V and the product eluted on a C-18 column using 50 mM NaAOC and 10% methanol (pH 4.7) using a preinjection guard cell set at + 0.8 V. The identity of 3-NTyr was confirmed by retention time, electrochemical profile, and coelution with authentic 3-NTyr standards.
Statistics
Statistical analyses were performed by 2-way analysis of variance (ANOVA) followed by Tukey post hoc test. A probability of P values less than .05 was considered significant. The n values refer to replicates from separate animals.
Results
SOD3 and EPO mRNA in mouse kidney
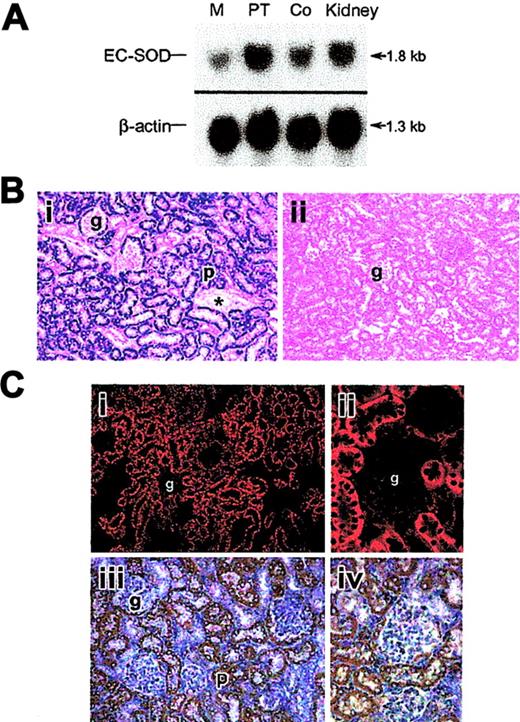
The renal PT and cortex had the highest levels of SOD3 mRNA expression by Northern analysis (Figure 1A) and in situ hybridization (ISH; Figure 1B). SOD3 mRNA was detected by ISH as a dense hybridization cytoplasmic signal in proximal tubules of the cortical and outermost medullary subcompartment (Figure 1Bi). This distribution of SOD3 mRNA was consistent with the Northern analysis and indicates that SOD3 is produced mainly in proximal tubule cells. Staining was absent in glomeruli, blood vessels, and other parts of the nephron. SOD3 was not detected in the KO kidney (Figure 1Bii). EPO mRNA was detectable by ISH only after hypoxia; EPO labeling was found primarily in proximal tubules of the cortex (Figure 1Ci-iv). Labeling was not observed in the glomeruli but was often seen in capsular epithelium. Control experiments using sense SOD3 and EPO cRNA as probes showed no hybridization (not shown).
SOD3 and EPO mRNA distribution in kidneys of adult mice. (A) Typical autoradiograph of Northern blot analysis showing SOD3 mRNA levels in kidney. Lanes 1, 2, 3, and 4 are medulla (M), proximal tubules (PT), cortex (Co), and total kidney, respectively. β-actin was used for normalization and verification of RNA loading. (B) Localization of SOD3 mRNA transcripts in mouse kidney by in situ hybridization. Paraformaldehyde-fixed renal sections (5 μm) were prepared from normal mice and hybridized with digoxigenin-labeled SOD3 antisense. (i) Wt kidney; the majority of the positive (dark blue) in situ labeling was observed in proximal tubules (p) of the cortex and outer medulla. The glomeruli (g), distal tubules, and the blood vessels (*) exhibit no significant staining. (ii) KO kidney; note absence of significant in situ staining. Original magnification, × 220 for all sections. (C) EPO mRNA localization by in situ hybridization in mouse kidney after 6 hours of hypoxia. (i) Low-power view of in situ red fluorescence staining of EPO mRNA; most labeling was observed in proximal tubules of cortex. (ii) High-power view of fluorescence staining in tubules near glomeruli but not in the tufts. (iii) Low-power view of EPO mRNA by DAB staining reveals structural detail and stain distribution in proximal tubules and capsular epithelium (p, proximal tubule). Glomeruli (g), distal tubules, and peritubular cells exhibit no or minimal staining. (iv) High-power view of details of proximal tubule staining for EPO mRNA. Final magnifications were × 220 (Ci), × 280 (Ciii), and × 550 (Cii,Civ). Objectives: × 20 (B, Ci, Ciii), × 40 (Cii, Civ).
SOD3 and EPO mRNA distribution in kidneys of adult mice. (A) Typical autoradiograph of Northern blot analysis showing SOD3 mRNA levels in kidney. Lanes 1, 2, 3, and 4 are medulla (M), proximal tubules (PT), cortex (Co), and total kidney, respectively. β-actin was used for normalization and verification of RNA loading. (B) Localization of SOD3 mRNA transcripts in mouse kidney by in situ hybridization. Paraformaldehyde-fixed renal sections (5 μm) were prepared from normal mice and hybridized with digoxigenin-labeled SOD3 antisense. (i) Wt kidney; the majority of the positive (dark blue) in situ labeling was observed in proximal tubules (p) of the cortex and outer medulla. The glomeruli (g), distal tubules, and the blood vessels (*) exhibit no significant staining. (ii) KO kidney; note absence of significant in situ staining. Original magnification, × 220 for all sections. (C) EPO mRNA localization by in situ hybridization in mouse kidney after 6 hours of hypoxia. (i) Low-power view of in situ red fluorescence staining of EPO mRNA; most labeling was observed in proximal tubules of cortex. (ii) High-power view of fluorescence staining in tubules near glomeruli but not in the tufts. (iii) Low-power view of EPO mRNA by DAB staining reveals structural detail and stain distribution in proximal tubules and capsular epithelium (p, proximal tubule). Glomeruli (g), distal tubules, and peritubular cells exhibit no or minimal staining. (iv) High-power view of details of proximal tubule staining for EPO mRNA. Final magnifications were × 220 (Ci), × 280 (Ciii), and × 550 (Cii,Civ). Objectives: × 20 (B, Ci, Ciii), × 40 (Cii, Civ).
Distribution of renal SOD3 protein
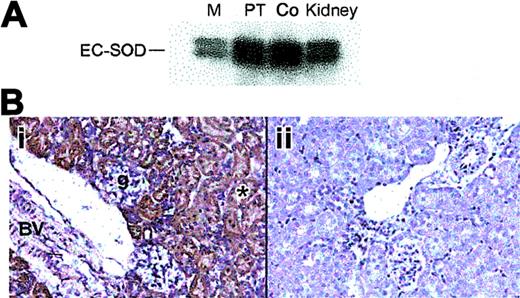
The distribution of SOD3 protein in mouse kidney was examined by Western blot and immunohistochemistry. Western blot analysis showed constitutive SOD3 protein in the proximal tubules and cortex (Figure 2A). SOD3 staining was present in both the renal cortex and the outermost medulla. In the cortex, immunostained segments were identified as proximal convoluted tubules (PCTs) on the basis of cell morphology. Most of the immunostaining occurred in the cortex and outermost medulla (Figure 2B). No immunoreactive cells were found in the inner medulla. The heavier labeling of the first part of the PT may indicate that filtered SOD3 is reabsorbed. Consistent extracellular staining was detected around the brush boarder, cell basement membranes, and large vessels, but not around glomeruli (Figure 2Bi). No significant staining was detected in the KO kidney (Figure 2Bii).
Distribution of renal SOD3 protein in adult mice. (A) Western blot of total protein (10 μg) from kidney regions probed with antibody against mouse SOD3. Lanes 1, 2, 3, and 4 are medulla (M), proximal tubules (PT), cortex (Co), and total kidney, respectively. (B) Immunohistochemical localization of renal SOD3. Paraformaldehyde-fixed renal sections (5 μm) were prepared from normal mice and incubated with polyclonal SOD3 antisera. Control sections were incubated with antisera preabsorbed with excess SOD3 peptide. (i) Wt kidney; brown labeling is present in the proximal convoluted tubules in the cortex and outer medulla. No SOD3 staining was detected in the inner medulla but was prominent in cortical proximal convoluted tubules (*) near the urinary pole of the glomerulus (g). The muscular renal blood vessel showed prominent staining with anti-SOD3 (BV). (ii) KO kidney; no staining is detected (original magnification, × 280). Objective magnification, × 20.
Distribution of renal SOD3 protein in adult mice. (A) Western blot of total protein (10 μg) from kidney regions probed with antibody against mouse SOD3. Lanes 1, 2, 3, and 4 are medulla (M), proximal tubules (PT), cortex (Co), and total kidney, respectively. (B) Immunohistochemical localization of renal SOD3. Paraformaldehyde-fixed renal sections (5 μm) were prepared from normal mice and incubated with polyclonal SOD3 antisera. Control sections were incubated with antisera preabsorbed with excess SOD3 peptide. (i) Wt kidney; brown labeling is present in the proximal convoluted tubules in the cortex and outer medulla. No SOD3 staining was detected in the inner medulla but was prominent in cortical proximal convoluted tubules (*) near the urinary pole of the glomerulus (g). The muscular renal blood vessel showed prominent staining with anti-SOD3 (BV). (ii) KO kidney; no staining is detected (original magnification, × 280). Objective magnification, × 20.
Immunofluorescence for renal SOD3 and EPO
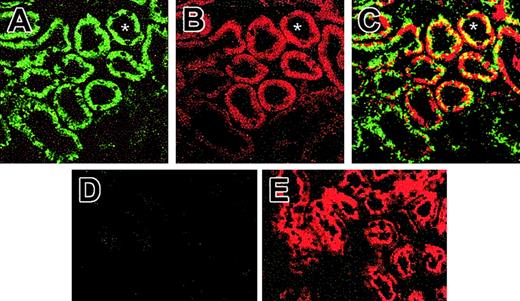
The possibility that SOD3 localized with EPO production in the kidney was evaluated by immunofluorescence colocalization using confocal microscopy. The double-staining technique indicated close proximity of SOD3 and EPO-expressing cells in the kidney (Figure 3). Specific staining for SOD3 was observed primarily in the proximal tubules, but there was no induction of SOD3 expression by exposure to 6 hours of hypoxia (Figure 3A), confirmed by Western analysis (not shown). SOD3 expression was absent in the KO mice (Figure 3D). EPO staining was present in proximal tubule cells in the cortico-medullary border (Figure 3B,E). EPO staining intensity increased markedly in kidneys of 6- and 12-hour hypoxic mice but was less dramatic in sections from KO mice (Figure 3E). Many proximal tubule profiles in the cortico-medullary border exhibited both FITC and Cy3 fluorescence, confirming that the proximal tubule cells were staining for SOD3 as well as for EPO protein after hypoxia.
Immunofluorescence for SOD3 and EPO protein in kidneys of animals exposed to hypoxia for 6 hours. (A) Confocal laser scanning micrograph of histologic sections of Wt kidney stained with antibody against SOD3. Renal sections were visualized with FITC-conjugated secondary antibody. SOD3 stained as brilliant green immunofluorescence in the proximal tubules; faint labeling is seen in the glomeruli and other tubules. (B) Confocal micrograph of Wt kidney stained for EPO using Cy3 secondary antibody. EPO stained as brilliant red fluorescence in the proximal tubules of the cortex. No staining was observed in glomeruli, distal tubule cells, or medulla. (C) Dual-labeling immunofluorescence of SOD3 with FITC (green) colocalizing with EPO Cy3 (red). Overlay of images in panels A and B reveals colocalization of SOD3 and EPO proximal tubule (yellow fluorescence). (D) KO kidney shows negligible SOD3 expression. (E) KO kidney shows EPO expression. Asterisk (*) denotes proximal tubules (original magnification, × 650).
Immunofluorescence for SOD3 and EPO protein in kidneys of animals exposed to hypoxia for 6 hours. (A) Confocal laser scanning micrograph of histologic sections of Wt kidney stained with antibody against SOD3. Renal sections were visualized with FITC-conjugated secondary antibody. SOD3 stained as brilliant green immunofluorescence in the proximal tubules; faint labeling is seen in the glomeruli and other tubules. (B) Confocal micrograph of Wt kidney stained for EPO using Cy3 secondary antibody. EPO stained as brilliant red fluorescence in the proximal tubules of the cortex. No staining was observed in glomeruli, distal tubule cells, or medulla. (C) Dual-labeling immunofluorescence of SOD3 with FITC (green) colocalizing with EPO Cy3 (red). Overlay of images in panels A and B reveals colocalization of SOD3 and EPO proximal tubule (yellow fluorescence). (D) KO kidney shows negligible SOD3 expression. (E) KO kidney shows EPO expression. Asterisk (*) denotes proximal tubules (original magnification, × 650).
Effect of hypoxia on hematocrit (Hct) and plasma EPO levels
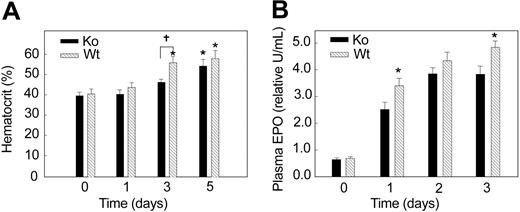
To determine a functional role for renal SOD3 in vivo, we compared the hematocrit responses of Wt and KO mice with hypoxia. Germ-line ablation of SOD3 does not cause overt defects in embryogenesis, hematopoiesis, or organ development, and the mouse phenotype appears normal. Baseline blood hemoglobin concentrations and erythrocyte morphology on blood smears are normal. After 3 days of hypoxia, the Hct had increased significantly in Wt (52.6 ± 2.6) compared with KO mice (46.8 ± 1.8). At 5 days of hypoxia exposure, the Hct continued to rise in KO mice (55.8 ± 3.3) and approached the Wt value (58.2 ± 3.8). Thus, the hematocrit response in the KO strain lagged behind that of the Wt animals (Figure 4A; P < .05). Similarly, plasma EPO levels rose more gradually in the KO mice during the first 3 days of hypoxia (Figure 4B; P < .05). These data suggested that absence of SOD3 delays the erythroid response to hypoxia by blunting the EPO response.
Hematocrit response to hypoxia in Wt and KO mice. Hematocrit (%) increased after 3 days of hypoxia in Wt mice but was delayed until 5 days in KO mice. Values are mean ± SEM (n = 6-8 per group at each time point; *P < 0.05 relative to control; †P < .05 between groups).
Hematocrit response to hypoxia in Wt and KO mice. Hematocrit (%) increased after 3 days of hypoxia in Wt mice but was delayed until 5 days in KO mice. Values are mean ± SEM (n = 6-8 per group at each time point; *P < 0.05 relative to control; †P < .05 between groups).
Renal EPO mRNA expression in hypoxia
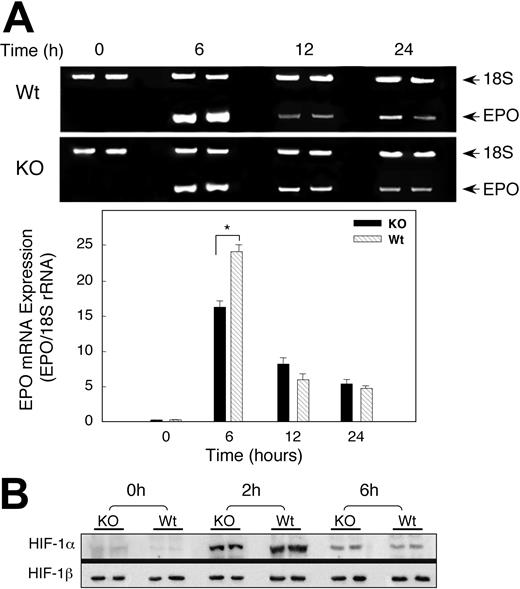
On the basis of renal colocalization of SOD-3 and EPO, we investigated whether the delay in the Hct response in the KO mice was due to altered EPO gene expression profiles by measuring renal EPO mRNA levels of Wt and KO animals exposed to hypoxia. Basal measurements of EPO transcripts in the wild-type and SOD3 KO mice were similar. Hypoxia significantly increased EPO mRNA in both Wt and KO mice after 6 hours of hypoxia, but the increase in EPO mRNA expression was 25-fold in Wt animals compared with 15-fold in KO mice (Figure 5A). Renal EPO mRNA levels in the Wt and KO declined after 12 hours of hypoxia, although they were still elevated significantly compared with sea-level controls. Differences in EPO transcript levels between Wt and KO mice were no longer detectable by 24 hours of hypoxia exposure.
Renal EPO mRNA transcription and HIF-1 expression after hypoxia. (A) Photograph of 2% agarose gel stained for EPO transcript coamplified with 18S rRNA to control for RNA loading and efficiency of RT-PCR (top panel). Bottom panel of densitometry data for EPO gene expression after normalization to 18S rRNA shows attenuated response in KO mice. Values are expressed as mean ± SEM for 6 mice at each time point (*P < .05). (B) Effect of hypoxia on nuclear HIF-1α accumulation. Nuclear extracts of kidneys of Wt and KO mice after hypoxia were probed with antibody against HIF-1α. The blots were stripped and probed with antibody against HIF-1β. Data are representative of 4 animals at each time point. By densitometry, nuclear HIF-1α was significantly greater in Wt mice at 2 hours but not at 6 hours of hypoxia.
Renal EPO mRNA transcription and HIF-1 expression after hypoxia. (A) Photograph of 2% agarose gel stained for EPO transcript coamplified with 18S rRNA to control for RNA loading and efficiency of RT-PCR (top panel). Bottom panel of densitometry data for EPO gene expression after normalization to 18S rRNA shows attenuated response in KO mice. Values are expressed as mean ± SEM for 6 mice at each time point (*P < .05). (B) Effect of hypoxia on nuclear HIF-1α accumulation. Nuclear extracts of kidneys of Wt and KO mice after hypoxia were probed with antibody against HIF-1α. The blots were stripped and probed with antibody against HIF-1β. Data are representative of 4 animals at each time point. By densitometry, nuclear HIF-1α was significantly greater in Wt mice at 2 hours but not at 6 hours of hypoxia.
HIF-1α protein expression in mice exposed to hypoxia
Since EPO expression in the kidney depends mainly on HIF-1 activity, we determined whether lack of SOD3 influenced HIF-1α protein expression in hypoxia. Mice of both strains were exposed to hypoxia for 2 or 6 hours and the kidneys were harvested immediately. Nuclear extracts were prepared and examined by immunoblot for HIF-1α and HIF-1β protein expression. Antibody against transcription factor specificity protein 1 (Sp1) was used to ensure that equal amounts of nuclear proteins were analyzed by densitometry (not shown). Renal HIF-1α protein was undetectable in normoxia, became detectable after 2 hours of hypoxia, and began to decline by 6 hours (Figure 5B). The accumulation of renal HIF-1α protein in Wt mice exceeded that of KO animals by 1.5-fold at 2 hours (P < .05), but nuclear HIF-1α protein was the same in both strains at 6 hours (P = NS). HIF-1β was present constitutively, and no differences were detected between the two strains.
Hypoxia effect on renal NOX4 mRNA expression
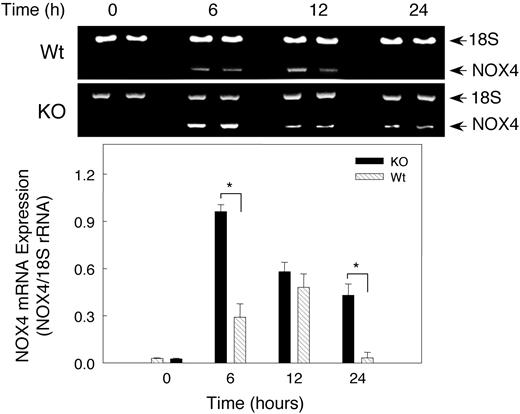
Because NADPH oxidase has been postulated to be involved in O2 sensing during hypoxia, we checked NOX4 expression in hypoxic mouse kidney by RT-PCR (Figure 6). NOX4 mRNA increased significantly (P < .05) after 6 hours of hypoxia in both Wt and KO mice, but surprisingly the NOX4 response was significantly greater in the KO mice. Renal NOX4 mRNA levels increased 9-fold after 6 hours of hypoxia in KO mice compared with 3.3-fold in the Wt animals. NOX4 mRNA levels tended to return to normal by 24 hours in Wt animals, while the transcript remained above control values in the KO animals. In both strains of mice, hypoxia-induced NOX4 expression coincided roughly with elevation of EPO transcript.
Renal NOX4 mRNA expression after hypoxia. Gel Star–stained 2% agarose gels demonstrating NOX4 transcripts coamplified with 18S rRNA to control for RNA loading and efficiency of RT-PCR (top panel). Bottom panel shows quantitative NOX4 gene expression after normalization to 18S rRNA. Densitometry values are mean ± SEM (n = 6 mice per group; *P < .05).
Renal NOX4 mRNA expression after hypoxia. Gel Star–stained 2% agarose gels demonstrating NOX4 transcripts coamplified with 18S rRNA to control for RNA loading and efficiency of RT-PCR (top panel). Bottom panel shows quantitative NOX4 gene expression after normalization to 18S rRNA. Densitometry values are mean ± SEM (n = 6 mice per group; *P < .05).
Effect of hypoxia on NO release and eNOS expression
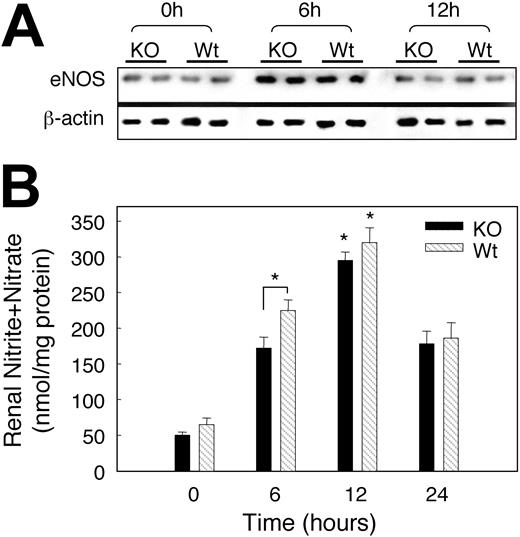
To explore whether reactive nitrogen species (RNS) produced in hypoxia could account for less robust EPO expression in SOD3 KO mice, renal eNOS expression was assessed by Western blot. Hypoxia induced renal eNOS equally (∼ 3-fold) in both Wt and KO mice (Figure 7A). To determine if the change in eNOS augmented NO generation in hypoxia, we measured and found a significant increase in plasma NOx in hypoxia compared with normoxia (Figure 7B). Of note, plasma NOx was significantly higher after 6 hours hypoxia (P < .05) in Wt than KO mice (Figure 7B). These data suggest that sustained hypoxia stimulates NO release at least in part via renal eNOS up-regulation.
Effect of hypoxia on renal eNOS expression and plasma NOx. (A) Representative Western blots showing eNOS antibody detected a single band at the expected 140 kDa; hypoxia increased eNOS staining intensity in both strains of mice. β-actin was used for normalization and verification of protein loading. (B) Changes in plasma nitrite/nitrate after hypoxia. A significant increase in NOx was detected after 6 hours of hypoxia in Wt mice and in both strains after 12 hours. Values are means ± SEM.
Effect of hypoxia on renal eNOS expression and plasma NOx. (A) Representative Western blots showing eNOS antibody detected a single band at the expected 140 kDa; hypoxia increased eNOS staining intensity in both strains of mice. β-actin was used for normalization and verification of protein loading. (B) Changes in plasma nitrite/nitrate after hypoxia. A significant increase in NOx was detected after 6 hours of hypoxia in Wt mice and in both strains after 12 hours. Values are means ± SEM.
Nitrotyrosine formation in hypoxia
The rapid reaction of superoxide with NO· generates peroxynitrite (ONOO–) and diminishes the bioactivity of NO·. ONOO– is too reactive to measure directly, but ONOO– stably nitrates aromatics such as tyrosine residues in proteins (3-nitrotyrosine [3-NTyr]).25 To determine whether hypoxia increased peroxynitrite formation, we measured renal protein 3-NTyr levels by HPLC. The renal 3-NTyr levels at baseline were about 0.1 pmol in the KO mice and below the assay detection limits in Wt animals. Renal 3-NTyr was not detected in the kidney of either strain of mice 2 hours after hypoxia, but significant differences between the 2 strains were found later in hypoxia (Figure 8C). The 3-NTyr content of kidney protein increased in KO mice after 6 hours of hypoxia (37-fold versus 12-fold in Wt). By 12 hours, 3-NTyr had increased sharply in the Wt kidney (34-fold), while the levels in the KO remained 18-fold above control. The 3-NTyr levels decreased in the 2 species by 24 hours but remained 7-fold above the detection limit.
Oxidative and nitrosative stress in kidneys of mice exposed to acute hypoxia. (A) Renal 3-nitrotyrosine (3-NTyr) protein content in renal tissue. Renal NTyr was measured by HPLC with electrochemical detection and NTyr was expressed in nmol/g protein. Increases in protein nitrotyrosine were found in both groups of mice at 6 to 24 hours of hypoxia. Values are means ± SEM (n = 4 mice per group at each time point; *P < .05). (B) GSSG/GSH ratio as a percentage of total GSH. Significant stress on the thiol pool was detectable early in hypoxia in the KO but not in the Wt strain. Values are mean ± SEM (n = 4 animals per group at each time point; *P < .05).
Oxidative and nitrosative stress in kidneys of mice exposed to acute hypoxia. (A) Renal 3-nitrotyrosine (3-NTyr) protein content in renal tissue. Renal NTyr was measured by HPLC with electrochemical detection and NTyr was expressed in nmol/g protein. Increases in protein nitrotyrosine were found in both groups of mice at 6 to 24 hours of hypoxia. Values are means ± SEM (n = 4 mice per group at each time point; *P < .05). (B) GSSG/GSH ratio as a percentage of total GSH. Significant stress on the thiol pool was detectable early in hypoxia in the KO but not in the Wt strain. Values are mean ± SEM (n = 4 animals per group at each time point; *P < .05).
Oxidative stress in hypoxic kidneys
Glutathione (GSH) was used to assess oxidative stress during hypoxia and to determine whether GSH oxidation (to GSSG) contributed to oxidative stress in hypoxic kidney. Baseline GSH levels in kidney homogenate were not significantly different in the 2 mouse strains. There was a trend toward increased kidney GSH levels in both strains exposed to hypoxia for 2 to 24 hours, but GSSG accumulated significantly only in kidneys of KO mice (reflected by an increase in GSSG/GSH; Figure 8B). These changes indicated a substantial renal oxidative stress in KO mice and minimal oxidative stress in Wt animals during hypoxia. In addition, we examined renal lipid peroxidation before and at 6, 12, and 24 hours of hypoxia. Lipid peroxidation, measured as the major aldehyde end product, malondialdehyde (MDA), was not significantly increased in kidneys of either mouse strain for 24 hours (data not shown).
Discussion
SOD3 is prominently expressed in the mouse kidney, and its localization to specific epithelial cells suggests it has an important physiologic role. We found evidence that SOD3, by regulating extracellular ROS and RNS in the kidney, contributes to the renal response to changes in O2 tension. This evidence is found in 4 major new findings of the study: (1) SOD3 localizes predominantly in the proximal tubules and colocalizes with EPO; (2) hypoxia increases EPO mRNA expression and hematocrit less rapidly in SOD3 knock-out than Wt mice; (3) hypoxia induces less nuclear translocation of HIF-1α in kidneys of SOD3 knock-out mice; and (4) hypoxia causes more GSSG accumulation and protein tyrosine nitration in kidneys of SOD3 knock-out mice, which relates negatively to EPO mRNA expression.
SOD3 localizes in mouse kidney to the proximal tubule in the cortex and outermost medullary region by ISH and IHC. Labeled antibody staining of large blood vessels suggests that they take up secreted SOD3 since the vessels do not stain with SOD3 cRNA probes. SOD3 protein accumulates in proximal tubules and colocalizes to the same portions of the nephron as does EPO, NOX4,18 and eNOS.26 These findings implicate
We found EPO labeling by ISH and IHC primarily in proximal tubule cells in mouse renal cortex. Previous studies of renal EPO-producing cells have suggested other sites of EPO synthesis including peritubular interstitial cells and capillaries.20,27-29 The detection of EPO mRNA in proximal tubule cells after hypoxia agrees with others.30-33 Lack of EPO signal in normoxia and its sharp localization in hypoxia support the specificity of our ISH technique. We also found similar protein distribution by IHC staining, which by correspondence with ISH makes renal filtration artifact seem unlikely. Although all sites of renal EPO synthesis are not agreed upon, proximal tubule cells are suitable for regulation of EPO because they are major sites of O2 use and are sensitive to hypoxia.
Immunolocalization and semiquantitative RT-PCR indicated that EPO induction in hypoxia is decreased in SOD3 knock-out compared with Wt mice. There are multiple mechanisms by which SOD3 could influence EPO gene expression during hypoxia. One is that scavenging extracellular
EPO gene expression in hypoxia is mediated to an important extent by HIF-1. The stability of the O2-sensitive subunit HIF-1α depends on local O2 and ROS concentrations. Activation of HIF-1α is redox sensitive, and thus regulated in part by the GSSG/GSH equilibrium.36 Moreover, increasing GSSG/GSH can inhibit HIF-1α binding activity,37 and selective inhibition of γ-glutamylcysteine synthetase (which depletes glutathione) abrogates nuclear localization and activation of HIF-1α in developing alveolar epithelium.37,38
In normoxia, HIF-1α is unstable because O2-dependent prolyl hydroxylases hydroxylate 2 proline residues,39 which permit HIF-1α to bind von Hippel Lindau protein, targeting it for ubiquitination and degradation. Prolyl hydroxylase activity decreases in hypoxia, which allows HIF-1α to stabilize and the complete transcription factor to form. There are two HIF-1 prolyl hydroxylases inducible by hypoxia: prolyl hydroxylase 2 (PHD2) and PHD3 tightly regulate HIF expression to avoid excessive nuclear HIF-1α accumulation.40 Prolyl hydroxylase may be activated by superoxide, and the disturbance in redox equilibrium by SOD3 gene knock-out may promote HIF-1α instability and thereby decrease EPO expression in the hypoxic kidney.
Another proposed mechanism for mammalian cells to sense hypoxia and transduce the signal to HIF-1 involves NADPH oxidases.21,41 Here, however, renal-specific NADPH oxidase (NOX4) expression was induced by hypoxia, especially in SOD3 knock-out mice, which should increase
Another important role of SOD3 is to prevent
Despite eNOS induction and increased plasma NOx in hypoxia, lack of SOD3 suppressed plasma NO· and caused earlier and greater protein nitration in hypoxia in the kidneys of SOD3 knock-out mice. Because the reaction rate of
Hydroxyl radical generation may be involved in O2-dependent HIF-1α degradation,61 perhaps by decomposition of ONOOH or by Fe2+ catalyzed H2O2 reduction driven by
In conclusion, renal SOD3 colocalizes with EPO in the mouse, and mice lacking the enzyme show decreased hypoxic induction of EPO in vivo. Since hypoxia increases HIF-1α protein translocation to the nucleus and stimulates EPO expression, the ability of SOD3 to scavenge
Prepublished online as Blood First Edition Paper, March 11, 2004; DOI 10.1182/blood-2003-07-2240.
Supported by PO1 HL 42444-12 (C.A.P.).
The publication costs of this article were defrayed in part by page charge payment. Therefore, and solely to indicate this fact, this article is hereby marked “advertisement” in accordance with 18 U.S.C. section 1734.


This feature is available to Subscribers Only
Sign In or Create an Account Close Modal