Abstract
Mitochondrial clearance is a well recognized but poorly understood biologic process, and reticulocytes, which undergo programmed mitochondrial clearance, provide a useful model to study this phenomenon. At the ultrastructural level, mitochondrial clearance resembles an autophagy-related process; however, the role of autophagy in mitochondrial clearance has not been established. Here we provide genetic evidence that autophagy pathways, initially identified in yeast, are involved in mitochondrial clearance from reticulocytes. Atg7 is an autophagy protein and an E1-like enzyme, which is required for the activity of dual ubiquitin-like conjugation pathways. Atg7 is required for the conjugation of Atg12 to Atg5, and Atg8 to phosphatidylethanolamine (PE), and is essential for autophagosome formation. In the absence of Atg7, mitochondrial clearance from reticulocytes is diminished but not completely blocked. Mammalian homologs of Atg8 are unmodified in Atg7−/− erythroid cells, indicating that canonical autophagy pathways are inactive. Thus, mitochondrial clearance is regulated by both autophagy-dependent and -independent mechanisms. In addition, mitochondria, which depolarize in wild-type cells before elimination, remain polarized in Atg7−/− reticulocytes in culture. This suggests that mitochondrial depolarization is a consequence rather than a cause of autophagosome formation in reticulocytes.
Introduction
Mitochondria are the site of oxidative phosphorylation and energy production in animal cells, and one of the by-products of this process, reactive oxygen species (ROS), causes mitochondrial damage. Damaged mitochondria generate more ROS than healthy mitochondria and can participate in a vicious cycle of ROS-mediated damage and ROS production.1 Mitochondrial damage accumulates with age and is thought to have a role in aging, degenerative diseases, and cancer.2,3 To maintain homeostasis, cells replace damaged mitochondria through mitochondrial elimination and biogenesis. Therefore, to develop novel therapies, it would be useful to understand the mechanisms whereby senescent or defective mitochondria are eliminated.
Several types of cells eliminate their organelles during the course of normal development; these include the lens cells of the eye and newly formed erythrocytes, also known as reticulocytes.4,5 Reticulocytes are formed in the bone marrow from orthochromatic erythroblasts by the process of enucleation. Nascent reticulocytes contain mitochondria, ribosomes, endocytic vesicles, golgi cisternae, and rough endoplasmic reticulum (ER).5,6 Reticulocytes lose surface area and volume as they mature7 and clear all of their membrane-bound organelles, including mitochondria, within a few days of generation. This rapid and coordinated clearance of mitochondria makes reticulocytes an ideal physiologic model for the study of programmed mitochondrial clearance.
The primary means of eliminating defective mitochondria is thought to be mitochondrial autophagy, also known as mitophagy (reviewed by Tolkovsky8 ). Mitophagy is observed in starved hepatocytes treated with glucagon9 and in serum-starved neurons treated with caspase inhibitor.10 Similarly, in reticulocytes, ultrastructural studies indicate that mitophagy is involved in mitochondrial clearance.5,11 Another mechanism, described in reticulocytes, is 15-lipoxygenase–dependent degradation of mitochondria.12-14 Recent work from our laboratory and by Sandoval et al demonstrated that an atypical BH3-only protein, NIX, is required for programmed mitochondrial clearance during reticulocyte maturation.15,16 These studies showed that NIX is required for mitochondrial autophagy and specifically for targeting mitochondria to autophagosomes.
Autophagy is an evolutionarily conserved process that maintains cellular homeostasis in changing nutrient conditions. Starvation induces autophagy, which in turn causes the sequestration of cytoplasm and subcellular organelles by double-membraned vesicles and their subsequent degradation. Genetic studies in yeast have defined several of the key pathways that regulate autophagy.17 Autophagy gene 1 (Atg1) is a serine-threonine protein kinase that is repressed by mTOR. mTOR senses nutrient conditions, and starvation or rapamycin inhibit mTOR and activate autophagy. Along with Atg6 (Beclin-1), a component of a class III PI3-kinase–containing complex, Atg1 is essential for the formation of a preautophagosomal structure. After formation of the preautophagosomal structure, dual ubiquitin-like conjugation pathways are required for the growth of autophagosomal membranes and autophagosome formation.18,19 These pathways, which require the E1-like enzyme Atg7, catalyze the conjugation of Atg12 to Atg5 and Atg8 to phosphatidylethanolamine (PE). Consistent with this function, Atg7 is required for the formation of autophagosomes.20 The Atg12-Atg5 and Atg8-PE ubiquitin-like conjugation pathways have been implicated in mitophagy in yeast,21-23 but the role of these pathways in mitochondrial clearance in mammalian cells remains to be determined.
The mammalian homologs of several autophagy genes have been identified. Targeted disruption of Atg5 or Atg7 in the germ line of mice causes lethality due to an inability to mobilize essential and branched-chain amino acids in the neonatal period.20,24 Circulating erythrocytes from Atg5−/− neonates appeared normal, raising the possibility that the ubiquitin-like conjugation pathways may be dispensable for mitochondrial clearance.25 However, in this study, an essential role of Atg5 in the induction of autophagy in erythroid cells was not confirmed. By contrast, Atg7 is known to be required for both ubiquitin-like conjugation pathways. Therefore, to gain insight into the role of autophagy in mitochondrial clearance, we examined the effect of Atg7 deficiency on mitochondrial clearance during reticulocyte maturation. Our studies indicate that the ubiquitin-like conjugation pathways make an important contribution, but are not strictly required for mitochondrial clearance in reticulocytes.
Methods
Atg7 fetal liver cell transplants and animal studies
Conditional Atg7flox/flox mice (gift of Masaaki Komatsu and Keiji Tanaka, Tokyo Metropolitan Institute of Medical Science, Tokyo, Japan) were bred with B6.FVB-Tg(EIIa-Cre) mice to generate heterozygous Atg7+/− mice on a C57BL/6J background.20,26 Atg7+/− mice were intercrossed to obtain E13.5 Atg7 null embryos. Polymerase chain reaction (PCR) primers for genotyping are 5′-TGGCTGCTACTTCTGCAATGATGT-3′ and 5′-TTAGCACAGGGAACAGCGCTCATGG-3′; the wild-type Atg7 allele gives a 3.3-kb product, and the null allele gives a 2.2-kb product. Fetal liver cells (2.5-5.0 × 10⁶) were injected into the tail vein of lethally irradiated (1050-1100 rads) B6.FVB-Tg(H2K-GFP) mice.27 Transplant recipients were treated with Enrofloxacin 45 mg/kg/day in their drinking water, prophylactically, to prevent infection. Bone marrow reconstitution was monitored by serial determination of the complete blood count and by monitoring the expression of green fluorescent protein (GFP) in the circulating erythrocytes, platelets, and leukocytes. Reticulocytosis was induced by phlebotomy of 0.35 mL blood daily for 4 days with saline volume replacement through intraperitoneal injection. The regimen was adjusted to achieve a target hematocrit of 20% to 25% on the final day, which was well tolerated by the mice. All studies were performed under an animal protocol approved by the Institutional Animal Care and Use Committee of St Jude Children's Research Hospital.
Flow cytometry
Reticulocyte-enriched blood was cultured in complete medium (30% fetal bovine serum, 1% deionized bovine serum albumin, 0.001% monothioglycerol, 2 mM glutamine, and penicillin-streptomycin in Iscove modified Dulbecco medium [IMDM]) for up to 3 days. ABT-737 (10 μM; gift of Abbott Laboratories) was added in selected experiments where indicated. Reticulocytes were stained with 200 nM Mitotracker Red CMXRos (MTR; Molecular Probes) in complete medium for 30 minutes at 37°C, followed by 2 washes with phosphate-buffered saline (PBS).15,28 Reticulocytes were stained with thiazole orange (TO) in PBS (2 μg/mL) for 45 minutes at room temperature, followed by 2 washes with PBS. Doubly stained reticulocytes were obtained by sequential staining with MTR, then TO. MTR fluorescence emission between 600 and 620 nm was collected after 562 nm laser excitation, using a BD LSR II flow cytometry analyzer (BD Biosciences). Alternatively, MTR fluorescence emission greater than 610 nm was collected after 568-nm laser excitation, using a BD FACSVantage SE cell sorter (BD Biosciences). In both cases, TO fluorescence was collected at 500 to 520 nm after excitation with a 488-nm laser.
Immunofluorescence
For mitochondrial imaging by immunofluorescence, reticulocyte-enriched blood was stained with MTR, as described above, and transferred to a glass-bottom dish. Alternatively, to image mitochondrial depolarization, reticulocytes were stained with 500 nM Mitotracker Green (MTG; Molecular Probes) and 1 μM tetramethylrhodamine methylester (TMRM) in complete medium for 1 hour, followed by 2 washes with PBS.28 Cells were viewed with a Nikon TE2000-E inverted microscope equipped with a C1Si confocal system and a X60 Plan Apo oil-immersion objective (NA 1.45; all from Nikon). To quantify mitochondrial polarization, the fluorescence of every cell containing mitochondria in a representative high-power field (original magnification, ×60) was quantified in the red and green channels with EZ-C1 software (Nikon), and the ratio of the signals determined. Approximately 50 to 100 cells were quantified per sample.
Electron microscopy
Reticulocyte-enriched blood was fixed and stained, and sections were examined with a JEM-1200EX II electron microscope (Jeol), as previously described.15,28 Images were archived with an Advanced Microscopy Techniques XR111 bottom-mount charge-coupled device (CCD) digital camera (Advanced Microscopy Techniques). Mitochondria and mature vacuoles with degraded contents were quantified, and the ratio determined. Approximately 50 images, containing 100 to 200 mitochondria and vacuoles, were quantified per sample.
Protein assays and antibodies
Embryonic day (E) 14.5 fetal liver cells were expanded in culture for 6 days in 2 U/mL complete medium with erythropoietin (Amgen), 100 ng/mL murine stem cell factor, 40 ng/mL human insulin-like growth factor-1 (IGF-1; Peprotech), and 1μM dexamethasone (Sigma-Aldrich). Lineage negative cells were obtained by magnetic bead technology and differentiated in culture for 2 days in complete medium with 4 U/mL erythropoietin and the protease inhibitors pepstatin A (10 μg/mL; Calbiochem) and E64d (10 μg/mL; Peptide Institute). Whole-cell extracts were made with RIPA buffer (150 mM NaCl, 1.0% Nonidet P-40, 0.5% sodium deoxycholate, 0.1% sodium dodecyl sulfate [SDS], 1 mM ethylenediaminetetraacetic acid [EDTA], and 50 mM Tris-HCl, pH 8.0) with protease and phosphatase inhibitors. Immunoblotting was performed as previously described.15,28
The following primary antibodies were used: 1 μg/mL LC3, mouse immunoglobulin G1 (IgG1) monoclonal antibody; 1 μg/mL GABARAP, mouse IgG1 monoclonal antibody; 1:1000 GATE-16, rabbit polyclonal antibody (Medical and Biological Laboratories); 1:1000 Atg12, rabbit polyclonal antibody (Cell Signaling Technology); 1 μg/mL Atg7, rabbit polyclonal antibody (ProSci); 0.5 μg/mL NIX, rabbit polyclonal antibody (Exalpha Biologicals); 0.1 μg/mL Beclin-1, rabbit polyclonal antibody (Santa Cruz Biotechnology); 0.25 μg/mL Ter119, rat monoclonal antibody (BD Biosciences); and 1:10 000 β-actin, mouse IgG1 monoclonal antibody (Sigma-Aldrich).
Results
Atg7−/− fetal liver cell transplant recipients are anemic and lymphopenic
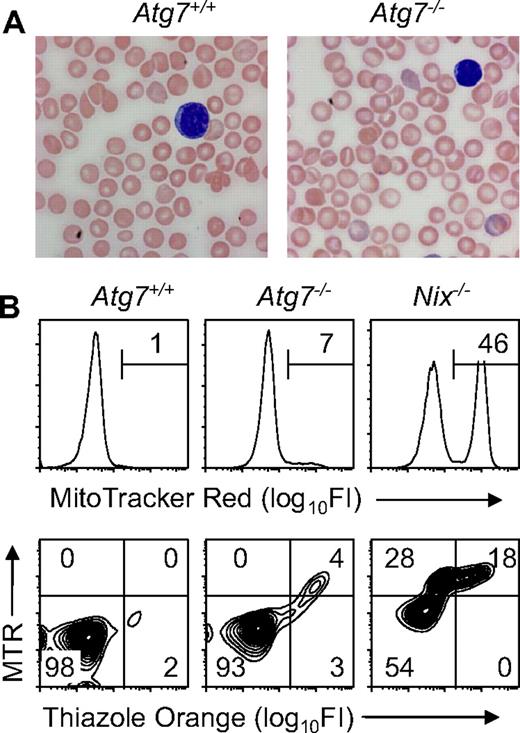
To generate mice that were Atg7-deficient in the hematopoietic lineage, Atg7flox/flox mice with a conditional null allele of the Atg7 gene were bred to the B6.FVB-Tg(EIIa-Cre) Cre-deletor strain,20,26 and the progeny intercrossed. The Cre transgene was removed by breeding, and heterozygous Atg7+/− mice were bred to obtain homozygous Atg7−/− embryos. Atg7+/+ or Atg7−/− E13.5 fetal liver cells (2.5 to 5.0 × 10⁶) were transplanted into lethally irradiated B6.FVB-Tg(H2K-GFP) mice.27 The H2K-GFP transgene in the transplant recipients is expressed in all hematopoietic lineages and allows discrimination between host and donor cells by flow cytometry. In contrast to the Atg7+/+ transplant recipients, which usually survived, approximately half of the Atg7−/− transplant recipients failed to engraft and died. Surviving Atg7−/− transplant recipients exhibited lymphopenia, anemia, and reticulocytosis (Table 1). Atg7−/− erythrocytes showed a modest increase in central pallor, but their morphology was otherwise unremarkable (Figure 1A). Consistent with these findings, the spleens of Atg7−/− transplant recipients exhibited erythroid-myeloid hyperplasia and lymphoid hypoplasia (supplemental Figure 1, available on the Blood website; see the Supplemental Materials link at the top of the online article). By 10 weeks after transplantation, the erythrocytes and reticulocytes of the surviving Atg7−/− transplant recipients were entirely of donor origin and therefore suitable for further analysis (supplemental Figure 2).
Complete blood counts and erythrocyte indices of Atg7−/− transplant recipients
| Atg7 genotype . | RBC, × 109/mL . | WBC, × 106/mL . | Gran, × 106/mL . | Lymph, × 106/mL . | Plts, × 106/mL . |
|---|---|---|---|---|---|
| +/+, n = 7 | 9.2 ± 0.4 | 23.0 ± 7.7 | 4.1 ± 1.4 | 17.1 ± 6.8 | 697 ± 184 |
| −/−, n = 11 | 7.9 ± 0.8* | 5.4 ± 2.0* | 3.0 ± 1.2 | 1.8 ± 0.7* | 489 ± 189 |
| Hct, % | Hb, g/dL | MCV, fL | MCHC, gm/dL | Reticulocytes, % | Mitotracker, % |
| 44 ± 2 | 15.5 ± 0.5 | 48 ± 3 | 35.4 ± 1.5 | 2.5 ± 1.0 | 0.9 ± 0.8 |
| 37 ± 3* | 12.9 ± 1.0* | 51 ± 6 | 34.8 ± 2.3 | 9.5 ± 5.4* | 9.9 ± 6.4* |
Values are presented as mean ± SD.
RBC indicates red blood cells; WBC, white blood cells; Gran, granulocytes; Lymp, lymphocytes; Plt, platelets; Hct indicates hematocrit; Hb, hemoglobin; MCV, mean corpuscular volume; and MCHC, mean corpuscular hemoglobin concentration.
P < .01.
Mitochondrial clearance is preserved in unstressed Atg7−/− transplant recipients. (A) Blood smears from Atg7+/+ and Atg7−/− transplant recipients, stained with Wright-Giemsa (original magnification, ×1000). Note the increased central pallor of the Atg7−/− erythrocytes. (B) Flow cytometry of blood stained with MTR (top panels) or doubly stained with MTR and TO (bottom panels) from Atg7+/+ and Atg7−/− transplant recipients and Nix−/− mice.
Mitochondrial clearance is preserved in unstressed Atg7−/− transplant recipients. (A) Blood smears from Atg7+/+ and Atg7−/− transplant recipients, stained with Wright-Giemsa (original magnification, ×1000). Note the increased central pallor of the Atg7−/− erythrocytes. (B) Flow cytometry of blood stained with MTR (top panels) or doubly stained with MTR and TO (bottom panels) from Atg7+/+ and Atg7−/− transplant recipients and Nix−/− mice.
Mitochondrial clearance is impaired, but not absent, in Atg7−/− reticulocytes
To determine the role of Atg7 in mitochondrial clearance in mice, we performed flow cytometry on blood from engrafted Atg7+/+ and Atg7−/− fetal liver transplant recipients, stained with MTR, or doubly stained with MTR and TO (Figure 1B). Staining with MTR alone provides optimal separation between MTR negative and positive populations, whereas staining with both MTR and TO permits the simultaneous assessment of mitochondrial and RNA (ie, ribosomal) content. In Atg7+/+ and Atg7−/− transplant recipients, 0.9% (± 0.8%) and 9.9% (± 6.4%) of the circulating erythrocytes contained mitochondria, respectively (Figure 1B and Table 1). By contrast, 53.4% (± 10.7%) of Nix−/− erythrocytes contain mitochondria, and approximately half of these have cleared their ribosomes15 (Figure 1B). These results suggest that if mitochondrial clearance is defective in Atg7−/− transplant recipients, the defect is less severe than in Nix−/− mice.
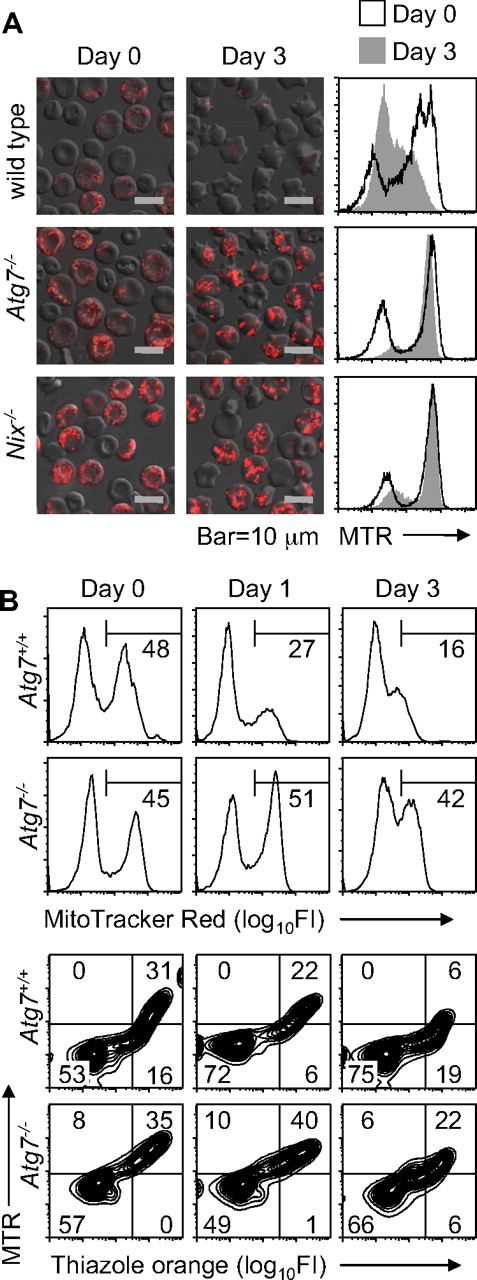
Because erythrocytes in mice under normal conditions are heterogeneous with respect to age, we considered the possibility that Atg7−/− reticulocytes have a defect in mitochondrial clearance but are able to clear their mitochondria in vivo, given enough time. To test this possibility, wild-type and Nix−/− mice, and Atg7−/− transplant recipients, were phlebotomized to induce reticulocytosis, and their blood was cultured in vitro. As previously shown, wild-type reticulocytes readily cleared their mitochondria.15 By contrast, mitochondrial clearance in Atg7−/− and Nix−/− reticulocytes was significantly impaired (Figure 2A). To exclude the possibility that this was an artifact caused by in vitro culture, we monitored mitochondrial clearance in the circulation of phlebotomized Atg7+/+ and Atg7−/− transplant recipients. Mitochondrial clearance was delayed in the Atg7−/− transplant recipients, confirming the in vitro studies (Figure 2B). Collectively, these studies indicate that mitochondrial clearance is partially impaired in Atg7−/− reticulocytes.
Mitochondrial clearance is impaired in Atg7−/− reticulocytes. (A) Immunofluorescence and flow cytometry of reticulocyte-enriched blood cultured for 3 days in vitro from wild-type and Nix−/− mice and Atg7−/− transplant recipients. The cells are stained with MTR. The black line in the histograms corresponds to day 0, and the shaded area to day 3. The scale is indicated at the bottom. (B) Flow cytometry of blood from phlebotomized mice stained with MTR (top panels) or doubly stained with MTR and TO (bottom panels). Mice were phlebotomized for 4 days. Thereafter, a small amount of blood (10 μL) was withdrawn on days 0, 1, and 3 for analysis. Day 0 was the day after the final day of phlebotomy. Genotypes are on the left.
Mitochondrial clearance is impaired in Atg7−/− reticulocytes. (A) Immunofluorescence and flow cytometry of reticulocyte-enriched blood cultured for 3 days in vitro from wild-type and Nix−/− mice and Atg7−/− transplant recipients. The cells are stained with MTR. The black line in the histograms corresponds to day 0, and the shaded area to day 3. The scale is indicated at the bottom. (B) Flow cytometry of blood from phlebotomized mice stained with MTR (top panels) or doubly stained with MTR and TO (bottom panels). Mice were phlebotomized for 4 days. Thereafter, a small amount of blood (10 μL) was withdrawn on days 0, 1, and 3 for analysis. Day 0 was the day after the final day of phlebotomy. Genotypes are on the left.
Atg7 is required for ubiquitin-like conjugation activity in erythroid cells
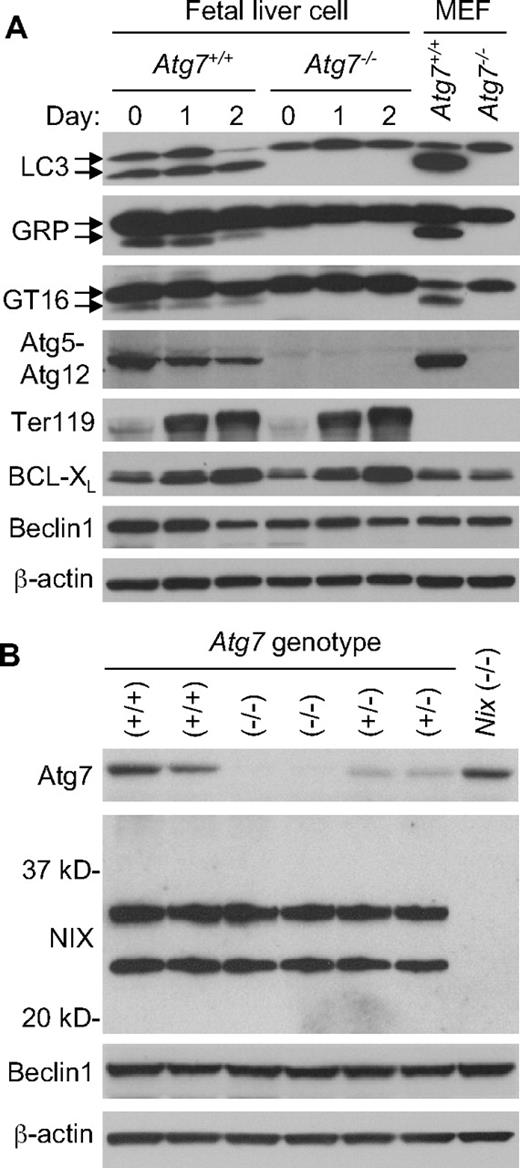
To confirm that Atg7 deficiency inactivates the Atg8 ubiquitin-like conjugation pathways in erythroid cells, we examined the mammalian Atg8 homologs LC3, GABARAP, and GATE-1629-31 for autophagy-dependent modification during erythroid maturation. E14.5 fetal liver cells were expanded in culture for 6 days, then differentiated for 2 days in the presence of erythropoietin. Erythroid maturation was monitored by cellular morphology and expression of the erythroid marker proteins Ter119 and BCL-XL. For all 3 Atg8 homologs, generation of the faster migrating modified form was strictly dependent on the presence of Atg7 (Figure 3A). Furthermore, conjugation of Atg12 to Atg5 required Atg7. Thus, both ubiquitin-like conjugation pathways are inactive in Atg7−/− erythroid cells. Given the similarities in the cellular phenotypes caused by deficiency of Atg7 or NIX, we looked for evidence of crosstalk in the expression of these proteins. However, deficiency of Atg7 had no effect on the expression of NIX, and likewise, deficiency of NIX had no effect on the expression of Atg7 (Figure 3B).
Deficient ubiquitin-like conjugation activity in Atg7−/− erythroid cells. (A) Western blot analyses of LC3, GABARAP (GRP), GATE-16 (GT16), Atg12, Ter119, BCL-XL, Beclin-1, and β-actin in expanded E14.5 fetal liver cells undergoing differentiation in culture for 2 days. The upper LC3 band corresponds to the unconjugated form of LC3, and the lower band corresponds to the lipid conjugated form of LC3. This same is true for the other Atg8 homologs, GABARAP and GATE-16. Wild-type murine embryonic fibroblasts (MEF) provide a positive control for the position of the unconjugated and conjugated proteins. Genotypes and days in culture are indicated at the top. (B) Western blot analyses of Atg7, NIX, Beclin-1, and β-actin in primary E14.5 fetal liver cells. NIX protein is expressed as 2 isoforms in erythroid cells, a full-length monomeric form (top band), and a shorter isoform, which has not been fully characterized (bottom band). Beclin-1 is provided as a loading control. Genotypes are indicated at the top.
Deficient ubiquitin-like conjugation activity in Atg7−/− erythroid cells. (A) Western blot analyses of LC3, GABARAP (GRP), GATE-16 (GT16), Atg12, Ter119, BCL-XL, Beclin-1, and β-actin in expanded E14.5 fetal liver cells undergoing differentiation in culture for 2 days. The upper LC3 band corresponds to the unconjugated form of LC3, and the lower band corresponds to the lipid conjugated form of LC3. This same is true for the other Atg8 homologs, GABARAP and GATE-16. Wild-type murine embryonic fibroblasts (MEF) provide a positive control for the position of the unconjugated and conjugated proteins. Genotypes and days in culture are indicated at the top. (B) Western blot analyses of Atg7, NIX, Beclin-1, and β-actin in primary E14.5 fetal liver cells. NIX protein is expressed as 2 isoforms in erythroid cells, a full-length monomeric form (top band), and a shorter isoform, which has not been fully characterized (bottom band). Beclin-1 is provided as a loading control. Genotypes are indicated at the top.
Ultrastructural appearance of Atg7-independent mitochondrial clearance
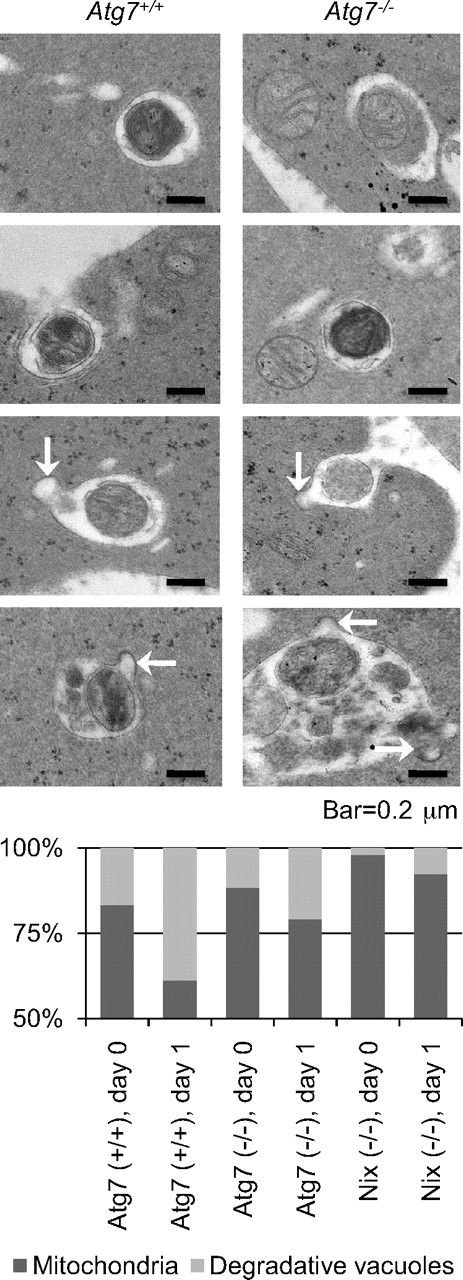
Our results suggest that mitochondrial clearance proceeds, at a reduced rate, in the absence of Atg7. To gain insight into this phenomenon, we examined the ultrastructure of Atg7−/− reticulocytes cultured in vitro. Atg7+/+ and Atg7−/− transplant recipients, and Nix−/− mice, were phlebotomized to induce reticulocytosis, and their blood was cultured in vitro for 1 day. Mitochondria and degradative vacuoles were assessed by transmission electron microscopy and quantified (Figure 4). The ratio of degradative vacuoles to mitochondria increased from day 0 to day 1 for reticulocytes of all 3 genotypes; however, on both days, it was highest for Atg7+/+, intermediate for Atg7−/−, and lowest for Nix−/− reticulocytes. Mitochondria were readily identified inside the vacuoles of both Atg7+/+ and Atg7−/− reticulocytes, as were vesicles that appeared to be fusing with the vacuoles (Figure 4 arrows). These results are consistent with the notion that Atg7 has a quantitative effect on mitochondrial clearance, but is not essential for the incorporation of mitochondria into vacuoles, vacuolar maturation, or exocytosis.
Atg7-independent mitochondrial clearance is mediated by degradative vacuoles. (Top) Ultrastructure of reticulocytes from Atg7+/+ and Atg7−/− transplant recipients cultured for 1 day. The scale is indicated at the bottom. (Bottom) Quantification of mitochondria and degradative vacuoles in cultured Atg7+/+, Atg7−/−, and Nix−/− reticulocytes expressed as a ratio. Fifty digital images containing 100 to 200 mitochondria and vacuoles per sample were quantified. Genotypes and days in culture are indicated at the bottom.
Atg7-independent mitochondrial clearance is mediated by degradative vacuoles. (Top) Ultrastructure of reticulocytes from Atg7+/+ and Atg7−/− transplant recipients cultured for 1 day. The scale is indicated at the bottom. (Bottom) Quantification of mitochondria and degradative vacuoles in cultured Atg7+/+, Atg7−/−, and Nix−/− reticulocytes expressed as a ratio. Fifty digital images containing 100 to 200 mitochondria and vacuoles per sample were quantified. Genotypes and days in culture are indicated at the bottom.
Role of mitochondrial depolarization in mitochondrial clearance
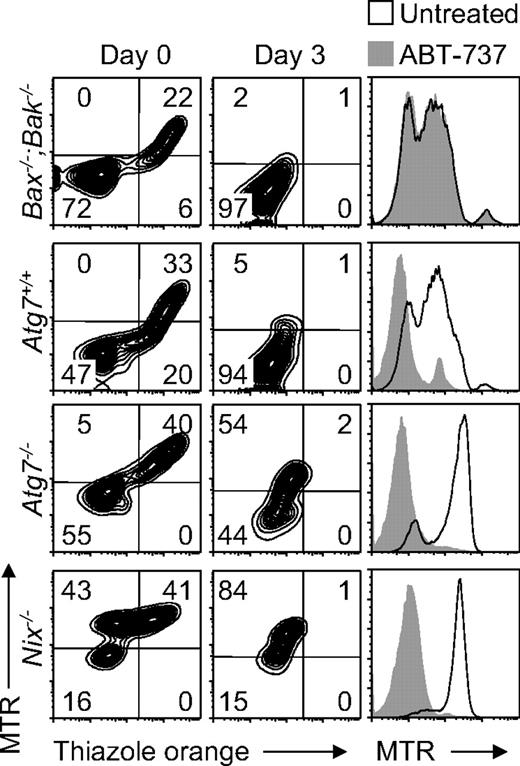
The role of mitochondrial depolarization is central to our understanding of mitochondrial clearance. Mitochondrial depolarization can induce mitophagy,9,32 and it has been suggested that NIX causes mitochondrial depolarization in reticulocytes.16 BAX and BAK regulate mitochondrial outer membrane permeability, and their activation by BH3-only proteins causes mitochondrial depolarization. Bax−/−;Bak−/− mice do not exhibit abnormal erythrocytes with retained mitochondria.15 However, by analogy to Atg7, we considered the possibility that Bax−/−;Bak−/− reticulocytes have a partial defect of mitochondrial clearance. To investigate this scenario, we obtained blood from phlebotomized Bax−/−;Bak−/−, Atg7+/+, Atg7−/−, and Nix−/− mice and monitored reticulocyte maturation in vitro over 3 days. Mitochondrial clearance from Bax−/−;Bak−/− reticulocytes was normal and indistinguishable from that of Atg7+/+ reticulocytes (Figure 5). By contrast, mitochondrial clearance from Nix−/− reticulocytes, and to a lesser extent Atg7−/− reticulocytes, was impaired. Therefore, if NIX causes mitochondrial depolarization, in reticulocytes, it does not function through BAX or BAK.
ABT-737 and NIX differ in their requirement for BAX or BAK. (Left panels) Flow cytometry of reticulocyte-enriched blood from phlebotomized Bax−/−;Bak−/−, Atg7+/+, Atg7−/−, and Nix−/− mice cultured for 3 days and doubly stained with MTR and TO. Genotypes are indicated on the left. (Right panels) Flow cytometry of the same blood samples, cultured for 1 day in the presence (shaded area) or absence (black line) of ABT-737, and stained with MTR.
ABT-737 and NIX differ in their requirement for BAX or BAK. (Left panels) Flow cytometry of reticulocyte-enriched blood from phlebotomized Bax−/−;Bak−/−, Atg7+/+, Atg7−/−, and Nix−/− mice cultured for 3 days and doubly stained with MTR and TO. Genotypes are indicated on the left. (Right panels) Flow cytometry of the same blood samples, cultured for 1 day in the presence (shaded area) or absence (black line) of ABT-737, and stained with MTR.
ABT-737 is a potent small molecule antagonist of BCL2 and BCL-XL.33 The ability of ABT-737 to rescue mitochondrial clearance in Nix−/− reticulocytes has been interpreted as evidence that NIX causes mitochondrial depolarization.16 Indeed, treatment of Atg7+/+, Atg7−/−, and Nix−/− reticulocytes with ABT-737 for 1 day caused mitochondrial depolarization (Figure 5). However, treatment of Bax−/−;Bak−/− reticulocytes with ABT-737 had no effect. Thus, consistent with its role as a BH3 mimetic, ABT-737 functions through a BAX- or BAK-dependent pathway. By contrast, NIX-dependent mitochondrial clearance in reticulocytes is BAX- and BAK-independent. Therefore, ABT-737 and NIX mediate mitochondrial clearance by distinct mechanisms.
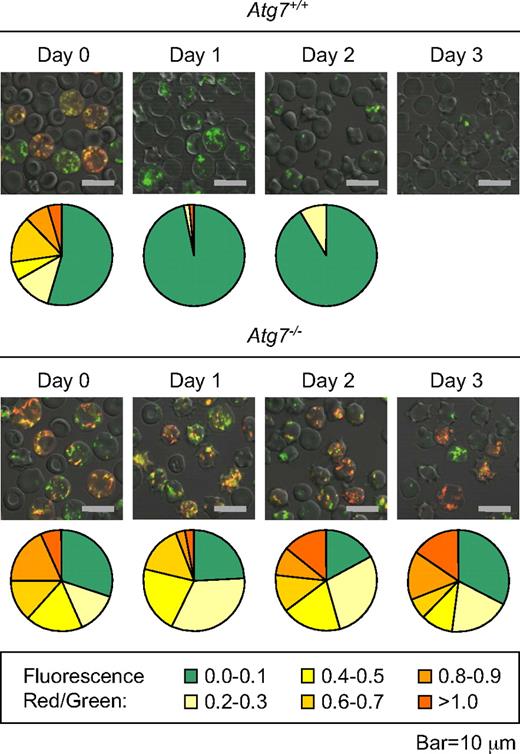
Our results indicate that mitochondria are cleared in reticulocytes independent of BAX, BAK, and the mitochondrial permeability transition pore (MPTP).15 However, we have not excluded the possibility that a NIX-dependent pathway, which does not use BAX, BAK, or the MPTP, could cause mitochondrial depolarization and clearance. To address this possibility, we examined the polarization state of mitochondria in Atg7+/+ and Atg7−/− reticulocytes cultured for 3 days. Reticulocyte-enriched blood was stained with MTG and TMRM. Polarized mitochondria, excited by a laser at a wavelength of 488 nm, emit red light due to fluorescence resonance energy transfer from MTG to TMRM. Depolarized mitochondria retain MTG but not TMRM, and emit green light. We previously showed that mitochondria in cultured wild-type reticulocytes depolarize within 1 day.34 In this experiment, we found that essentially all mitochondria in Atg7+/+ reticulocytes depolarize within 1 day, whereas most mitochondria in Atg7−/− reticulocytes, remain polarized after 3 days (Figure 6). Because Atg7 regulates autophagosome formation, this result suggests that mitochondrial depolarization in wild-type and Atg7+/+ reticulocytes is primarily a consequence rather than a cause of autophagosome formation.
Mitochondrial depolarization is a consequence of autophagosome formation in reticulocytes. Immunofluorescence of reticulocyte-enriched blood from phlebotomized Atg7+/+ and Atg7−/− transplant recipients, cultured for 3 days, and doubly stained with MTG and TMRM. The mean immunofluorescence intensity per cell of all cells with mitochondria in a representative field was quantified in the red and green channels, and the ratio of the signals was determined. The higher the ratio, the greater the average mitochondrial polarization per cell. The proportion of cells within each range is represented by a chart below each picture (legend at the bottom). Approximately 50 to 100 cells were quantified per sample (field). Note that mitochondria in the Atg7−/− reticulocytes remain polarized, whereas mitochondria in Atg7+/+ reticulocytes do not. No quantification is provided for Atg7+/+ reticulocytes on day 3 due to an insufficient number of cells with mitochondria for analysis. The scale is indicated at the bottom.
Mitochondrial depolarization is a consequence of autophagosome formation in reticulocytes. Immunofluorescence of reticulocyte-enriched blood from phlebotomized Atg7+/+ and Atg7−/− transplant recipients, cultured for 3 days, and doubly stained with MTG and TMRM. The mean immunofluorescence intensity per cell of all cells with mitochondria in a representative field was quantified in the red and green channels, and the ratio of the signals was determined. The higher the ratio, the greater the average mitochondrial polarization per cell. The proportion of cells within each range is represented by a chart below each picture (legend at the bottom). Approximately 50 to 100 cells were quantified per sample (field). Note that mitochondria in the Atg7−/− reticulocytes remain polarized, whereas mitochondria in Atg7+/+ reticulocytes do not. No quantification is provided for Atg7+/+ reticulocytes on day 3 due to an insufficient number of cells with mitochondria for analysis. The scale is indicated at the bottom.
Discussion
The replacement of senescent and defective mitochondria is thought to be critical for the maintenance of cellular homeostasis, but the mechanisms through which mitochondria are sequestered and eliminated are not well understood. Reticulocytes, which rapidly eliminate their entire cohort of mitochondria during development, provide a physiologic model for the elucidation of these mechanisms. Ultrastructurally, reticulocytes eliminate mitochondria through an autophagy-related process.11 In the present study, we show that mitochondrial clearance from reticulocytes is regulated by both autophagy-dependent and -independent mechanisms.
When autophagy is induced, dual ubiquitin-like conjugation pathways are activated. These pathways, which covalently link Atg12 to Atg5, and Atg8 to PE, are essential for the growth of autophagosomal membranes. Both pathways require the E1-like enzyme, Atg7. Therefore, to gain insight into the role of autophagy in mitochondrial clearance, we transplanted Atg7−/− fetal liver cells into lethally irradiated recipient mice. Atg7−/− transplant recipients exhibited lymphopenia, anemia, and reticulocytosis. The lymphopenia is consistent with peripheral lymphocyte depletion, and impaired T-cell survival, in Atg5−/− fetal liver transplant recipients.35 Interestingly, Atg5−/− and Atg7−/− T cells have increased mitochondria.36,37 The anemia and reticulocytosis we observed are suggestive of an erythroid maturation defect. Indeed, our studies show that Atg7−/− reticulocytes have a defect in mitochondrial clearance, and Atg7−/− erythrocytes have a shortened life span in vivo (unpublished results). In this regard, defective mitochondrial clearance has been previously linked to caspase activation and decreased erythrocyte life span in Nix−/− mice.16
Our studies show that mitochondrial clearance is regulated by Atg7-dependent, ubiquitin-like conjugation pathways in reticulocytes. Another study of Atg5−/− erythrocytes suggested that autophagy may not be necessary for mitochondrial clearance25 ; however, reticulocyte maturation was not examined, and it was not established that autophagy is impaired in Atg5−/− erythroid cells. More recently, it was demonstrated that reticulocytes deficient for the mammalian homolog of Atg1, ULK1, have a defect in mitochondrial clearance.38 ULK1 and ULK2 act upstream of Atg7 as initiators of autophagy. The similarity of the erythroid phenotypes caused by ULK1 and Atg7 deficiency reinforces the notion that autophagy has a role in this process.
Several lines of evidence suggest that mitochondrial clearance proceeds, at a diminished rate, in Atg7−/− reticulocytes. First, in contrast to Nix−/− mice, Atg7−/− transplant recipients do not have an abnormal population of circulating erythrocytes with retained mitochondria. This suggests, given sufficient time in vivo, that Atg7−/− reticulocytes are able to eliminate their mitochondria. Consistent with this interpretation, mitochondria are cleared, at a reduced rate, in phlebotomized Atg7−/− transplant recipients. Second, Atg7−/− reticulocytes contain degradative vacuoles, which are ultrastructurally indistinguishable from vacuoles in Atg7+/+ reticulocytes, and contain mitochondria. There are fewer vacuoles in Atg7−/− than in Atg7+/+ reticulocytes, but more than in Nix−/− reticulocytes. Thus, it appears that mitochondria are cleared through a degradative pathway in the absence of Atg7. Whether this pathway is authentic autophagy or a variant remains to be determined.
NIX is an atypical BH3-only protein that targets mitochondria to autophagosomal membranes in reticulocytes.15,16 Because selective mitochondrial clearance is not well understood, the mechanism whereby NIX accomplishes this feat is of interest. One possibility is that NIX targets mitochondria for clearance by triggering depolarization. Accordingly, the BH3-mimetic ABT-737 rescues mitochondrial clearance in Nix−/− reticulocytes.16 However, ABT-737 and NIX differ in their requirement for BAX and BAK, and therefore function through distinct mechanisms. Alternatively, NIX may cause depolarization by activating the MPTP. NIX activates the MPTP in cardiac myocytes, indirectly, by increasing calcium stores in the ER.39 However, compared with cardiac myocytes, reticulocytes have relatively little ER. Furthermore, we have shown that inhibitors of the MPTP fail to prevent mitochondrial clearance.15 Finally, NIX may cause mitochondrial depolarization through a BAX-, BAK-, and MPTP-independent pathway. We addressed this possibility in autophagy-defective Atg7−/− reticulocytes. If NIX causes mitochondrial depolarization, then depolarized mitochondria should accumulate in Atg7−/− reticulocytes in culture. Instead, we observed the persistence of polarized mitochondria. This result suggests that mitochondrial depolarization, which precedes elimination, is a consequence rather than a cause of autophagosome formation. Altogether, these results suggest that NIX does not promote mitochondrial clearance by causing mitochondrial depolarization. On the other hand, we cannot exclude the possibility that NIX causes subtle or transient mitochondrial depolarization and that this is sufficient to trigger mitochondrial clearance.
Recent studies demonstrating crosstalk between cell death and autophagy pathways suggest another mechanism whereby NIX may regulate mitophagy. These studies have shown that multidomain antiapoptotic proteins, such as BCL2 or BCL-XL, inhibit autophagy, whereas proapoptotic BH3-only proteins, such as BAD, activate autophagy.40,41 The mechanism involves competition between proapoptotic proteins and Beclin-1 for binding to BCL2 or BCL-XL. Beclin-1 binds to BCL2 and BCL-XL through its BH3 domain and can be displaced by another BH3 domain-containing protein, activating autophagy.42,43 NIX is up-regulated during terminal erythroid differentiation15,44 and could potentially participate in such an exchange. Autophagy is activated in both wild-type and Nix−/− erythroid cells during differentiation. Thus, NIX is not generally required for autophagy in erythroid cells; however, given its location in the mitochondrial outer membrane, NIX may be required for activating autophagy near mitochondria.
It is interesting that the defect in mitochondrial clearance in autophagy-defective strains of mice, such as Atg5−/−, Atg7−/−, and Ulk1−/− is less severe than that in Nix−/− mice. Despite inactivation of both ubiquitin-like conjugation pathways in Atg7−/− reticulocytes, mitochondrial clearance proceeds, albeit at a reduced rate. There are many possible explanations for this effect, one being that Atg8 homologs are recruited to mitochondria without ubiquitin-like modification. In this regard, it is intriguing that NIX directly interacts with LC3 (Ivan Dikic, oral communication, July 2008) and GABARAP.45 Potentially, NIX can function as an adaptor to recruit membrane trafficking or autophagy proteins directly to mitochondria.
There appears to be at least 2 mechanisms of mitochondrial clearance in mammalian cells. First, mitochondrial fission and depolarization trigger clearance,9,32 which is consistent with the observation that apoptotic signals cause mitochondrial clearance, when caspase activation is blocked.10 Although the biologic significance of the latter observation is not fully clear, it is reasonable to hypothesize that mitochondrial quality control involves the clearance of senescent, depolarized mitochondria. In this regard, it is interesting that Parkin is recruited to depolarized mitochondria and is required for their engulfment by autophagosomes.46 Second, studies of NIX and the related protein BNIP3 have shown that in some circumstances, mitochondrial clearance is programmed. This is important in developmental settings, such as reticulocyte maturation, and may also be important in the setting of cellular stress. BNIP3 is regulated by hypoxia and the hypoxia-inducible transcription factor-1α (HIF-1α)47 and has a role in mitochondrial clearance in hypoxic cells,48 which may be relevant for reports of deregulated BNIP3 expression in cancer (reviewed by Burton et al49 ). Our present studies suggest that programmed mitochondrial clearance can be mediated through both autophagy-dependent and -independent mechanisms. Additional studies of Atg7−/− and Nix−/− reticulocytes should help to elucidate these pathways.
The online version of this article contains a data supplement.
The publication costs of this article were defrayed in part by page charge payment. Therefore, and solely to indicate this fact, this article is hereby marked “advertisement” in accordance with 18 USC section 1734.
Acknowledgments
The authors acknowledge the support of the Animal Resource Center, Flow Cytometry, and Cellular Imaging facilities of St Jude Children's Research Hospital. The authors thank Masaaki Komatsu and Keiji Tanaka for providing the Atg7flox/flox mice and Abbott Laboratories for the gift of ABT-737.
This work is supported by National Institutes of Health (Bethesda, MD) grants R21 DK074519 (P.A.N.), RO1 CA076379 (J.L.C.), and KO8 HL084199 (M.K.); National Institutes of Health Cancer Center support grant P30 CA21765; and the American, Lebanese, and Syrian Associated Charities (Memphis, TN).
National Institutes of Health
Authorship
Contribution: J.Z. designed and performed research and analyzed data; M.S.R. and M.R.L. performed research; F.C.D., M.K., and J.L.C. designed research and analyzed data; and P.A.N. designed research, analyzed data, and wrote the paper.
Conflict-of-interest disclosure: The authors declare no competing financial interests.
Correspondence: Paul A. Ney, Department of Biochemistry, Rm 4064, Thomas Tower, St Jude Children's Research Hospital, 332 N Lauderdale, Memphis, TN 38105-2794; e-mail: paul.ney@stjude.org.
References
Author notes
*M.S.R. and M.R.L. contributed equally to this study.

