Abstract
Microenvironmental expansion of hematopoietic stem cells (HSCs) is induced by treatment with parathyroid hormone (PTH) or activation of the PTH receptor (PTH1R) in osteoblastic cells; however, the osteoblastic subset mediating this action of PTH is unknown. Osteocytes are terminally differentiated osteoblasts embedded in mineralized bone matrix but are connected with the BM. Activation of PTH1R in osteocytes increases osteoblastic number and bone mass. To establish whether osteocyte-mediated PTH1R signaling expands HSCs, we studied mice expressing a constitutively active PTH1R in osteocytes (TG mice). Osteoblasts, osteoclasts, and trabecular bone were increased in TG mice without changes in BM phenotypic HSCs or HSC function. TG mice had progressively increased trabecular bone but decreased HSC function. In severely affected TG mice, phenotypic HSCs were decreased in the BM but increased in the spleen. TG osteocytes had no increase in signals associated with microenvironmental HSC support, and the spindle-shaped osteoblastic cells that increased with PTH treatment were not present in TG bones. These findings demonstrate that activation of PTH1R signaling in osteocytes does not expand BM HSCs, which are instead decreased in TG mice. Therefore, osteocytes do not mediate the HSC expansion induced by PTH1R signaling. Further, osteoblastic expansion is not sufficient to increase HSCs.
Introduction
To survive throughout the life of an individual, hematopoietic stem cells (HSCs) must balance self-renewal and differentiation.1 This essential regulation of stem cells is thought to be determined at least in part by the environment, or niche, in which these cells reside.2 Hormonal stimulation by parathyroid hormone (PTH) results in HSC expansion through the niche,3 but the PTH receptor (PTH1R) is not expressed in HSCs.4 In the BM microenvironment, PTH1R is expressed in cells in the osteoblastic lineage, including Nestin+ cells, thought to represent mesenchymal stem cells (MSCs), which recent data suggest are regulatory components of the HSC niche.5 Because PTH treatment expands the Nestin+ cell pool and causes it to more rapidly differentiate into its progeny,5 it is not known which cells in the mesenchymal/osteoblastic lineage are responsible for the PTH-dependent signals that result in HSC expansion. We have demonstrated previously that expression of a constitutively active PTH receptor (caPTH1R) in immature and mature osteoblasts was sufficient to expand HSCs.3 Therefore, the cell population capable of initiating microenvironmental changes that expand HSCs must comprise osteoblastic cells targeted by the 2.3-kb fragment of the mouse collagen I gene promoter (hereafter referred to as 2.3Col1 osteoblastic cells) and their progeny, which includes osteocytic cells.
It was demonstrated recently that PTH stimulates osteocytes, in which activation of PTH1R signaling down-regulates the expression of the Wnt antagonist Sclerostin.6 This effect of PTH on Sclerostin has also been demonstrated in postmenopausal women treated with PTH,7 suggesting that Sclerostin down-regulation may be an important mediator of the bone anabolic action of PTH. Using an in vivo model in which a constitutively active PTH1R is targeted to osteocytes (dentin matrix protein-1 [DMP1]-caPTH1R mice, hereafter referred to as TG mice), we demonstrated that PTH-dependent signals in osteocytes control bone mass and bone remodeling.8 Osteocytes are former osteoblasts buried into bone matrix but connected to the endosteum via cytoplasmic processes,9 which sense mechanical stimuli and regulate both osteoblastic and osteoclastic numbers.10 It was unknown whether osteocytes affect hematopoiesis and/or HSCs. In the present study, we examined whether signaling downstream of the PTH1R in osteocytes supports the expansion of HSCs by analyzing in detail the hematopoietic phenotype of TG mice.
Methods
Generation of TG mice
DMP1-caPTH1R mice were generated using a DNA construct encoding the H223R mutant of the human PTH1R, as described previously.8
Gene-expression studies
Total RNA was purified from tissues using ULTRASPEC reagent (Biotecx Laboratories) according to the manufacturer's instructions. For quantitative RT-PCR, purified total RNA was reverse-transcribed using the High-Capacity cDNA Archive Kit (Applied Biosystems). Gene expression was analyzed in triplicate by quantitative PCR using the ΔCt method, as described previously.11,12 Primer probe sets were designed using the Assay Design Center of Roche Applied Science and were as follows: for CXCL-12: forward primer: ctgtgcccttcagattgttg, reverse primer: ctctgcgccccttgttta; Ang-1: forward primer: cggatttctcttcccagaaac, reverse primer: tccgacttcatattttccacaa; IL-7: forward primer: cgcagaccatgttccatgt, reverse primer: tctttaatgtggcactcagatgat; IL-6: forward primer gctaccaaactggatataatcagga, reverse primer ccaggtagctatggtactccagaa; V-CAM1: forward primer: tggtgaaatggaatctgaacc, reverse primer: cccagatggtggtttcctt; and ribosomal protein S2 (used as a housekeeping gene): forward primer: cagaatggtaggaaggtcacg, reverse primer: gatcctgctctggaaatcgt.
Histology and immunohistochemistry
Harvested hind limbs were fixed in 10% neutral-buffered formalin for 48 hours, decalcified in 14% EDTA, pH 7.2, for 14 days, and processed as described previously.8,13 Histological sections (4 μm thickness) were stained with H&E to visualize morphology. For immunohistochemistry, all slides were deparaffinized, rehydrated with PBS (pH 7.4), treated with aqueous 3% H2O2 for 20 minutes, and the antigen retrieved in 0.4 mg/mL of proteinase K (S3004; DAKO) for 10 minutes. Nestin Ab (AB5922; Millipore) was applied 1:4000 for 60 minutes. The slides were then incubated in rabbit Ab amplifier (PT03-D; MaxVision) for 15 minutes, washed in PBS, incubated for 15 minutes in Polymer HRP (PT03-D; MaxVision). Diaminobenzidine was applied for 10 minutes and then slides were counterstained with H&E, dehydrated, and mounted with Cytoseal mounting medium (Richard-Allan Scientific).
Light microscopy
Histology slides were viewed at room temperature with a CKX41 upright microscope (Olympus). The objectives used were UPlan Fl 20×/0.50, UPlan Fl 40×/0.65, and UPlan FLN 60×/0.90 (all Olympus). All images were obtained with a SPOT Insight digital microscope camera and Spot 4.7 software (SPOT Imaging Solutions).
micro-CT analysis
For microcomputed tomography (micro-CT), bones were dissected, cleaned of soft tissue, and stored in 70% ethanol until being scanned on a model mCT40 scanner (Scanco Medical), as described previously.8
Peripheral blood cell analysis
Before euthanasia, 20 μL of blood obtained by mandibular venous plexus sampling was run through a CBC-DIFF Veterinary Hematology System (HESKA) to obtain blood cell counts.
Flow cytometric analysis
Right hind limbs (1 femur and 1 tibia for each individual mouse) and spleens were harvested from TG mice and their wild-type (WT) littermates or WT mice treated with PTH. Spleens were collected whole. Whole BM was isolated either by crushing the tibia and femur with a mortar and pestle in 10 mL of PBS with 2% FBS and filtering through a 40-μ mesh or by cutting both ends of the tibia and femur and flushing the BM with a 25-gauge needle before filtering (WT and TG littermates were always processed at the same time and using the same method). RBCs were eliminated from samples by incubating them in RBC lysis buffer (156mM NH4Cl, 127μM EDTA, and 12mM NaHC3) for 5 minutes at room temperature. Hematopoietic stem and progenitor cells (HSPCs) were identified by the phenotypic markers Lin−Sca-1+c-kit+ (LSK). 4′,6-diamidino-2-phenylindole (DAPI; Invitrogen) was used to determine the viability of analyzed cells using control viable and dead cells. LSK cells were further subdivided into long-term HSCs (LT-HSCs) and short-term HSCs (ST-HSCs)/multipotent progenitors using the SLAM receptors CD48 and CD150 and Flt-3 expression. Stained samples were analyzed on an LSR II flow cytometer (BD Biosciences) and results were quantified using FlowJo Version 8.8.6 software (TreeStar). All Abs used are listed in supplemental Table 1 (available on the Blood Web site; see the Supplemental Materials link at the top of the online article).
Competitive repopulation assay
Whole BM from TG and WT sex-matched littermates was obtained simultaneously with the phenotypic data presented for the same cohort of mice, using the identical method (flushing or crushing 1 femur and 1 tibia) for WT and TG donor mice. Care was always taken to use littermate WT and TG in the same transplantation cohorts. BM cells from the donor animals were combined with competitor CD45.1 cells at a ratio of 1:2 and 750 000 total cells were transplanted into CD45.1 recipient mice by tail-vein injection. Before transplantation, the recipient mice received a split dose of radiation of 500 rads each separated by 24 hours using the Gamma Cell 40 Irradiator (Best Tetatronic). The second dose of radiation was given 2 hours before the transplantation. After transplantation, the peripheral blood of recipient mice was sampled by mandibular bleeds at the times indicated to monitor engraftment. Blood was separated in a 2% solution of 5 × 10⁵ molecular-weight dextran to precipitate the RBCs. The resulting supernatant containing WBCls was analyzed by flow cytometric analysis with the Abs listed in supplemental Table 1. 4′,6-diamidino-2-phenylindole (Invitrogen) was used to determine the viability of the collected cells. Cells expressing CD45.2 came from the original donor group.
Mice
All experiments on mice were approved by the Institutional Animal Care and Use Committee of the University of Rochester School of Medicine and the Indiana University School of Medicine.
PTH injections
Rat PTH (1-34) was purchased from Bachem and resuspended in water to 400 μg/mL. This solution was diluted 1:100 in sterile 0.9% NaCl solution and administered intraperitoneally to 8- to 10-week-old C57/BL6 male mice at 40 μg/kg 3 times daily for 10 days. Mice were killed 15 hours after the last injection. The left hind limb was harvested for histology.
Statistical analysis
For quantitative assays, treatment groups were reported as means ± SEM. For analysis, t tests or ANOVA with Bonferroni posttest were performed using Prism Version 4.01 software for Windows (GraphPad). P ≤ .05 was considered significant.
Results
Targeted expression of a constitutively active PTH1R in osteocytes increases trabecular bone and osteoblastic cells
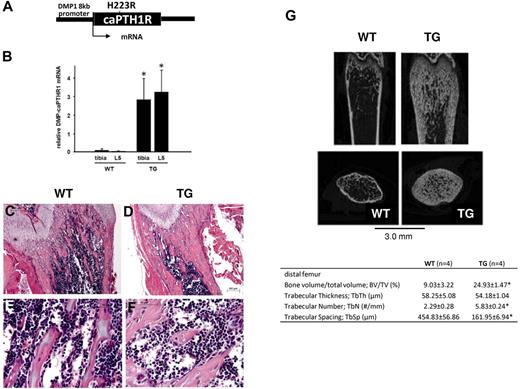
To establish whether activation of PTH signaling in osteocytes expands HSCs, we studied TG mice in which a constitutively active PTH1R is targeted to osteocytes by the 8-kb fragment of the DMP1 gene promoter (Figure 1A). Strong expression of the transgene in both long bones and vertebrae was confirmed in TG mice as early as 3.5 weeks of age (Figure 1B). At this time point, TG mice had a large increase in mineralized trabecular bone that could be seen easily both in histological sections of the long bones (Figure 1C-F) and by micro-CT analysis (Figure 1G). The net increase in bone in the TG mice is because of increased bone formation and osteoblastic cell numbers, not because of defective osteoclastogenesis or bone resorption, as shown previously.8 We chose this early time point for initial hematopoietic analysis of TG mice.
Targeted activation of PTH1R in osteocytes increases osteoblastic cells and trabecular bone. (A) Schematic representation of the transgene construct. (B) Expression of the transgene in tibia and lumbar spine of mice at 3.5 weeks of age. (C-D) H&E staining of longitudinal sections of representative distal femora from 3.5-week-old WT (C,E) and TG (D,F) littermate mice. Bars indicate 0.2 mm (C-D) and 0.05 mm (E-F). *P < .001. (C) Representative longitudinal and cross-sectional micro-CT images of distal femora from 4-week-old WT and TG littermate mice. Table insert includes quantification of micro-CT parameters (mean ± SD) from 3 female and 1 male mice in each group, age 3.5 weeks. *P ≤ .05
Targeted activation of PTH1R in osteocytes increases osteoblastic cells and trabecular bone. (A) Schematic representation of the transgene construct. (B) Expression of the transgene in tibia and lumbar spine of mice at 3.5 weeks of age. (C-D) H&E staining of longitudinal sections of representative distal femora from 3.5-week-old WT (C,E) and TG (D,F) littermate mice. Bars indicate 0.2 mm (C-D) and 0.05 mm (E-F). *P < .001. (C) Representative longitudinal and cross-sectional micro-CT images of distal femora from 4-week-old WT and TG littermate mice. Table insert includes quantification of micro-CT parameters (mean ± SD) from 3 female and 1 male mice in each group, age 3.5 weeks. *P ≤ .05
In vivo activation of PTH1R signaling in osteocytes does not increase BM phenotypic HSCs, spleen weight, or extramedullary hematopoiesis
The hematopoietic phenotype was studied in 3.5-week-old male and female mice. In TG mice, there were no changes in peripheral blood counts (supplemental Figure 1), BM cellularity (Figure 2D), or splenomegaly (Figure 2H) compared with WT, sex-matched littermates.
Activation of PTH signaling in osteocytes does not change BM cellularity, phenotypic HSCs, spleen weight, or extramedullary hematopoiesis. (A-C) Representative flow cytometric dot plot illustrating gating scheme for subsets of LSK cells from the BM from 3.5- to 4-week-old WT or TG male littermate mice. Parent population is obtained from the FSC and SSC population. The lineage-negative, DAPI-negative population (A) was further analyzed for Sca-1 and c-kit expression (B).The LSK cell subset was further analyzed for the expression of the SLAM receptors CD150 and CD48 (representative contour plot in panel C) and for Flt-3 (not shown). (D) Total BMMCs obtained from crushing 1 femur and 1 tibia from each mouse are depicted. LSK cells (E) and subsets for MPPs/ST-LSK (Flt3+CD48−CD150−, F) and LT-LSK (Flt3−CD48−CD150+, G) are represented as frequency of total. (H) Spleen weights in 4-week-old WT or TG male littermates. (I-K) Spleen LSK cells (I), ST-HSCs (J), and LT-HSCs (K). The analysis was performed in 2 separate experiments for the BM (WT, n = 7; TG, n = 9), 4 separate experiments for the spleen (WT, n = 17; TG, n = 18; spleen weights were obtained in 2 of 4 experiments). Each dot represents an individual mouse; each separate experiment is indicated by a different color; bar indicates the mean and SEM. None of the results demonstrated a statistically significant difference.
Activation of PTH signaling in osteocytes does not change BM cellularity, phenotypic HSCs, spleen weight, or extramedullary hematopoiesis. (A-C) Representative flow cytometric dot plot illustrating gating scheme for subsets of LSK cells from the BM from 3.5- to 4-week-old WT or TG male littermate mice. Parent population is obtained from the FSC and SSC population. The lineage-negative, DAPI-negative population (A) was further analyzed for Sca-1 and c-kit expression (B).The LSK cell subset was further analyzed for the expression of the SLAM receptors CD150 and CD48 (representative contour plot in panel C) and for Flt-3 (not shown). (D) Total BMMCs obtained from crushing 1 femur and 1 tibia from each mouse are depicted. LSK cells (E) and subsets for MPPs/ST-LSK (Flt3+CD48−CD150−, F) and LT-LSK (Flt3−CD48−CD150+, G) are represented as frequency of total. (H) Spleen weights in 4-week-old WT or TG male littermates. (I-K) Spleen LSK cells (I), ST-HSCs (J), and LT-HSCs (K). The analysis was performed in 2 separate experiments for the BM (WT, n = 7; TG, n = 9), 4 separate experiments for the spleen (WT, n = 17; TG, n = 18; spleen weights were obtained in 2 of 4 experiments). Each dot represents an individual mouse; each separate experiment is indicated by a different color; bar indicates the mean and SEM. None of the results demonstrated a statistically significant difference.
To assess whether activation of osteocytes was sufficient to expand the immature hematopoietic compartment, flow cytometric analysis using markers that prospectively identify HSPCs was performed (Figure 2A-C). BM mononuclear cells (BMMCs) from crushed WT and TG hind limbs demonstrated similar cellularity (Figure 2D), and in this cell population, there was no increase in HSC-enriched LSK cells from TG compared with WT BM (Figure 2E).
HSPC subsets can be discriminated with flow cytometry by their differential expression of the SLAM receptors CD150 and CD48 (Figure 2C),14,15 as well as by Flt3 expression.16 Flow cytometric analysis for HSPC subsets did not identify any differences in Flt3+CD150−CD48− phenotypic ST-HSCs (pST-HSCs; Figure 2F) or Flt3−CD48−CD150+ phenotypic LT-HSCs (pLT-HSCs; Figure 2G) between BMMCs from WT and TG mice. Even though spleen weight was not increased in TG mice (Figure 2H), to exclude even subtle extramedullary hematopoiesis, we tested total spleen cells for the presence of phenotypic HSPCs and found no difference in WT compared with TG mice (Figure 2I-K). These data demonstrate that neither osteocytic cell activation nor the osteoblastic cell expansion caused by such activation is sufficient to expand phenotypic HSPCs.
In vivo activation of PTH1R signaling in osteocytes does not increase BM HSC function
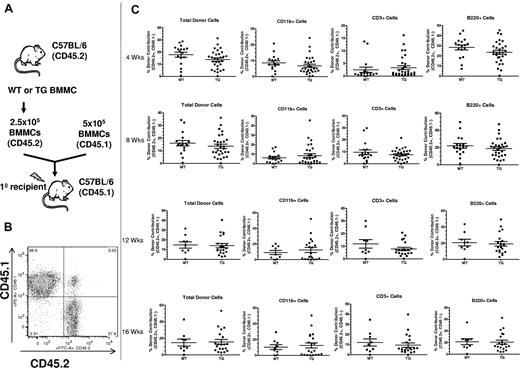
The lack of an increase in phenotypic HSPCs does not exclude a change in HSC function, as determined by the ability of HSCs to reconstitute the hematopoietic system. To determine whether activation of PTH receptor signaling in osteocytes could expand functional HSCs, we performed competitive repopulation assays using BMMCs obtained by crushing one hind limb (1 whole femur and 1 whole tibia) from WT or TG mice (Figure 3). The competitive repopulation assay showed that there was no increase in BM HSC function in TG compared with WT mice in either the short or the long term (Figure 3C). Analysis of recipients from individual donors was also performed and, again, no difference was noted between WT and TG mice (supplemental Figure 2). Therefore, activation of PTH signaling in osteocytes and subsequent osteoblastic expansion were not sufficient to increase HSC function.
Activation of PTH signaling in osteocytes does not change BM HSC function. (A) Schematic representation of the competitive reconstitution experiments. Donor BMMCs were collected by crushing the hind limbs (1 femur and 1 tibia per each donor mouse) from CD45.2 WT or TG mice, mixed with CD45.1 competitor cells at a ratio of 1:2, and transplanted into 4-5 irradiated CD45.1 recipient mice to quantify engraftment potential from individual donors. (B) Representative flow cytometric dot plot of total cells from peripheral blood of donor illustrates how engraftment was quantified. Donor cells are in the right lower quadrant (CD45.2+/CD45.1−). Individual recipients are represented as dots (to see this information segregated by donor, see supplemental Figure 2). (C) Results of the competitive repopulation assay. The percentage of CD45.2+/CD45.1−–expressing total cells, myeloid cells (CD11b+), T cells (CD3ϵ+), and B cells (B220+) in the blood of recipient mice was analyzed at 4, 8, 12, and 16 weeks after transplantation as indicated. Each dot represents an individual recipient mouse. Bars indicate the mean and SEM.
Activation of PTH signaling in osteocytes does not change BM HSC function. (A) Schematic representation of the competitive reconstitution experiments. Donor BMMCs were collected by crushing the hind limbs (1 femur and 1 tibia per each donor mouse) from CD45.2 WT or TG mice, mixed with CD45.1 competitor cells at a ratio of 1:2, and transplanted into 4-5 irradiated CD45.1 recipient mice to quantify engraftment potential from individual donors. (B) Representative flow cytometric dot plot of total cells from peripheral blood of donor illustrates how engraftment was quantified. Donor cells are in the right lower quadrant (CD45.2+/CD45.1−). Individual recipients are represented as dots (to see this information segregated by donor, see supplemental Figure 2). (C) Results of the competitive repopulation assay. The percentage of CD45.2+/CD45.1−–expressing total cells, myeloid cells (CD11b+), T cells (CD3ϵ+), and B cells (B220+) in the blood of recipient mice was analyzed at 4, 8, 12, and 16 weeks after transplantation as indicated. Each dot represents an individual recipient mouse. Bars indicate the mean and SEM.
Rapid progression of bone phenotype in mice with activation of PTH1R signaling in osteocytes decreases BM support for HSCs
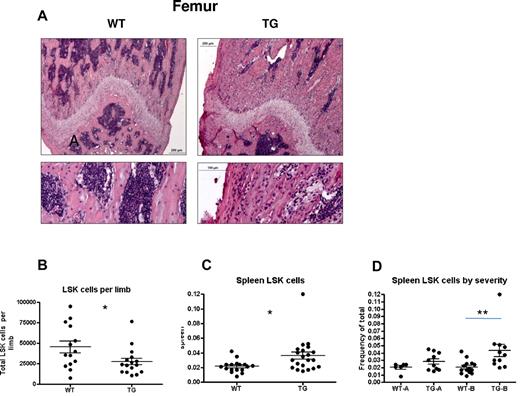
Skeletal changes continue in TG mice as they age, with a progressive increase in osteoblastic cells and trabecular bone.8 Therefore, the hematopoietic phenotype of TG mice was also analyzed at later time points. At 4-5 weeks of age, despite severe increases in trabecular bone in the TG mice, hematopoietic cells were clearly visualized within the trabeculae in both long bones (Figure 4A).
Mild versus severe hematopoietic phenotype in subsets of TG mice. (A-B) H&E staining of longitudinal sections of representative distal femora (A) from 4-week-old WT and TG littermates. Bars indicate 0.2 mm (low power) and 0.1 mm (high power). Quantification of LSK cells per limb (obtained by flushing 1 femur and 1 tibia per individual mouse limb, B) and frequency of spleen LSK cells (C). Spleen LSK-cell frequencies are also depicted by litter (D), demonstrating a mild (TG-A) and severe (TG-B) phenotype. Bars indicate mean and SEM. *P ≤ .05; **P ≤ .01.
Mild versus severe hematopoietic phenotype in subsets of TG mice. (A-B) H&E staining of longitudinal sections of representative distal femora (A) from 4-week-old WT and TG littermates. Bars indicate 0.2 mm (low power) and 0.1 mm (high power). Quantification of LSK cells per limb (obtained by flushing 1 femur and 1 tibia per individual mouse limb, B) and frequency of spleen LSK cells (C). Spleen LSK-cell frequencies are also depicted by litter (D), demonstrating a mild (TG-A) and severe (TG-B) phenotype. Bars indicate mean and SEM. *P ≤ .05; **P ≤ .01.
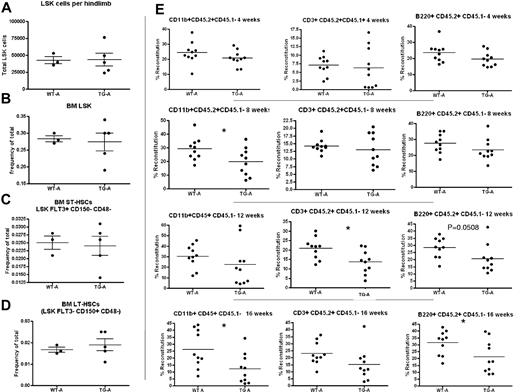
When BM and spleen LSK cells were evaluated for phenotypic HSPCs, we noted decreased LSK cells per limb in TG mice (Figure 4B) and increased LSK cells in the spleens of TG mice (Figure 4C), suggesting decreased BM microenvironmental support of HSCs in TG mice. However, we noted a significant change in variance in the latter measurement (P < .0001 by F test comparing variance of WT with TG spleen LSK cells), leading us to hypothesize that the rapid skeletal changes affecting the BM result in a complex hematopoietic phenotype. Therefore, WT and TG mice were strictly compared only with sex-matched littermate controls. Whereas spleen LSK cells were consistent in WT mice (Figure 4D), some litters of TG mice showed no change in spleen LSK cell frequency (mildly affected TG [TG-A]; Figure 4D). In contrast, severely affected TG (TG-B) had increased LSK cells in the spleen (Figure 4D). TG-A mice had no extramedullary hematopoiesis (Figure 4D), no changes in BM cellularity (data not shown), and no changes in LSK cell numbers per hind limb or frequency in the BM (Figure 5A-D). When BMMCs from these WT and TG-A mice were used as donors for competitive repopulation assays, TG HSPCs had a significant decrease in both short- and long-term reconstitution (Figure 5E), suggesting that the changes induced in the BM by osteocytic activation resulted in decreased BM microenvironmental support of LT-HSCs.
TG-A mice have decreased LT-HSC activity. Quantification of BM LSK cells per hind limb (1 femur and 1 tibia). Cells were obtained by both flushing and crushing, the same method used for TG and WT in the same cohort (A). (B-D) LSK cell frequency (B), BM pST-HSCs (C), and pLT-HSCs (D) in TG-A mice and their WT littermates from group A. (E) Donor BM from TG-A mice and their WT littermates was collected by flushing, mixed with competitor BM, and transplanted into 10 recipients per group. The percentage of CD45.2+/CD45.1−-expressing myeloid cells (CD11b+), T cells (CD3ϵ+), and B cells (B220+) in the blood of recipient mice was analyzed at 4, 8, 12, and 16 weeks after transplantation as indicated. Each dot represents an individual recipient mouse. Bar indicates the mean and SEM. *P ≤ .05.
TG-A mice have decreased LT-HSC activity. Quantification of BM LSK cells per hind limb (1 femur and 1 tibia). Cells were obtained by both flushing and crushing, the same method used for TG and WT in the same cohort (A). (B-D) LSK cell frequency (B), BM pST-HSCs (C), and pLT-HSCs (D) in TG-A mice and their WT littermates from group A. (E) Donor BM from TG-A mice and their WT littermates was collected by flushing, mixed with competitor BM, and transplanted into 10 recipients per group. The percentage of CD45.2+/CD45.1−-expressing myeloid cells (CD11b+), T cells (CD3ϵ+), and B cells (B220+) in the blood of recipient mice was analyzed at 4, 8, 12, and 16 weeks after transplantation as indicated. Each dot represents an individual recipient mouse. Bar indicates the mean and SEM. *P ≤ .05.
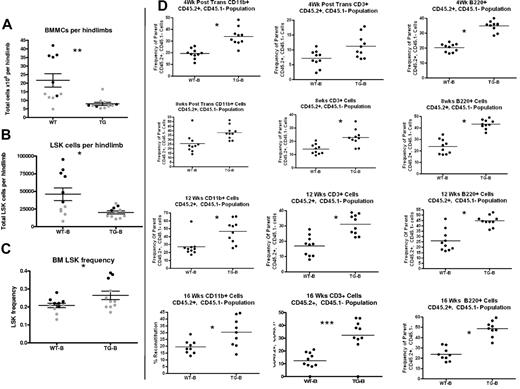
In TG-B mice, decreased HSC support by the activated osteocytes was demonstrated by displacement of LSK cells to the spleen (Figure 4D), decreased BM cellularity (Figure 6A), and decreased LSK cell number per limb (Figure 6B). Interestingly, in this group, there was increased LSK cell frequency in the BM (Figure 6C). Because the proportion of donor cells for the competitive transplantation assay are numerically based (Figure 3A), the increased LSK cell frequency in the BM would predict increased reconstitution from TG-B mice resulting from a concentration artifact. Indeed, there was increased donor cell engraftment in recipients receiving BMMCs from TG mice compared with WT from this group (Figure 6D). These results highlight the importance of measuring both the frequency and number per limb of pLT-HSCs in evaluating the BM and competitive repopulation assay results, particularly when LSK cell frequency and numbers are discordant and BM cellularity varies between experimental groups, as described previously by others.17
TG-B mice have decreased BM LSK cells and increased splenic LSK cells at 4-5 weeks of age. Total BMMCs per limb (A), LSK cells per limb (B), and BM LSK-cell frequency (C) were quantified from 4- to 5-week-old TG-B and WT male and female littermate mice (n = 11 TG-B mice and sex-matched littermate controls; each dot indicates an individual donor; 2 separate experiments are indicated with 2 colors). (D) BMMCs flushed from hind limbs of WT or TG mice, as indicated, were mixed in a 2:1 ratio with CD45.1+ competitor BM cells and transplanted into CD45.1+ recipients. The percentage of CD45.2+/CD45.1−-expressing myeloid cells (CD11b+), T cells (CD3ϵ+), and B cells (B220+) in the peripheral blood of recipient mice was analyzed at the times indicated after transplantation. Each dot represents an individual recipient mouse. Bars indicates the mean and SEM. *P ≤ .05; **P ≤ .01; ***P ≤ .001.
TG-B mice have decreased BM LSK cells and increased splenic LSK cells at 4-5 weeks of age. Total BMMCs per limb (A), LSK cells per limb (B), and BM LSK-cell frequency (C) were quantified from 4- to 5-week-old TG-B and WT male and female littermate mice (n = 11 TG-B mice and sex-matched littermate controls; each dot indicates an individual donor; 2 separate experiments are indicated with 2 colors). (D) BMMCs flushed from hind limbs of WT or TG mice, as indicated, were mixed in a 2:1 ratio with CD45.1+ competitor BM cells and transplanted into CD45.1+ recipients. The percentage of CD45.2+/CD45.1−-expressing myeloid cells (CD11b+), T cells (CD3ϵ+), and B cells (B220+) in the peripheral blood of recipient mice was analyzed at the times indicated after transplantation. Each dot represents an individual recipient mouse. Bars indicates the mean and SEM. *P ≤ .05; **P ≤ .01; ***P ≤ .001.
Neutropenia and extramedullary hematopoiesis in 8-week-old mice with activation of the PTH1R in osteocytes
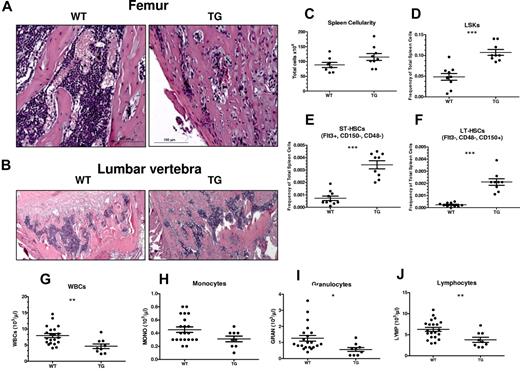
We next tested WT and TG mice at 8 weeks of age (Figure 7), when the skeletal phenotype is near maximal, as demonstrated by changes in histology and bone mineral density.8 Histological analysis highlighted the dramatic increase in trabecular bone in both long bones (Figure 7A) and vertebrae (Figure 7B) of TG compared with WT mice. Despite the trabecular bone increase, hematopoietic cells could be detected within the BM cavities of TG mice (Figure 7A-B).
Progression of bone phenotype in TG mice results in neutropenia and dramatically increased LSK cells, pST-HSCs, and pLT-HSCs in spleens. (A-B) H&E staining of longitudinal sections of representative distal femora (A) and lumbar vertebrae (B) from 8-week-old WT and TG littermate mice. Bars indicate 0.2 mm (low power) and 0.1 mm (high power). Quantification of spleen cellularity (C), frequency of spleen LSK cells (D), pST-HSCs (E), and pLT-HSCs (F) from 8-week-old WT and TG littermate mice. Quantification of blood WBC (G), monocyte (H), granulocyte (I), and lymphocyte (J) counts in male and female WT and TG littermate mice. Each dot represents an individual mouse. Bar indicates the mean and SEM. *P ≤ .05; **P ≤ .01; ***P ≤ .001.
Progression of bone phenotype in TG mice results in neutropenia and dramatically increased LSK cells, pST-HSCs, and pLT-HSCs in spleens. (A-B) H&E staining of longitudinal sections of representative distal femora (A) and lumbar vertebrae (B) from 8-week-old WT and TG littermate mice. Bars indicate 0.2 mm (low power) and 0.1 mm (high power). Quantification of spleen cellularity (C), frequency of spleen LSK cells (D), pST-HSCs (E), and pLT-HSCs (F) from 8-week-old WT and TG littermate mice. Quantification of blood WBC (G), monocyte (H), granulocyte (I), and lymphocyte (J) counts in male and female WT and TG littermate mice. Each dot represents an individual mouse. Bar indicates the mean and SEM. *P ≤ .05; **P ≤ .01; ***P ≤ .001.
In spleens from TG mice, there was evidence of extramedullary hematopoiesis, with increased spleen LSK cells (Figure 7C-D), pST-HSCs (Figure 7E), and pLT-HSCs (Figure 7F) that are otherwise undetectable in the spleens of mice of this age.
Blood analysis demonstrated normal RBC counts, hematocrit, and platelets (supplemental Figure 3) in TG mice, whereas WBC counts were significantly decreased (Figure 7G). This difference was confirmed with WBC differential counts in TG compared with WT mice at 8 weeks of age (Figure 7H-J), suggesting defective hematopoiesis.
Lack of osteocytic pro-HSC signals and absence of spindle-shaped cells in mice with activation of the PTH1R in osteocytes
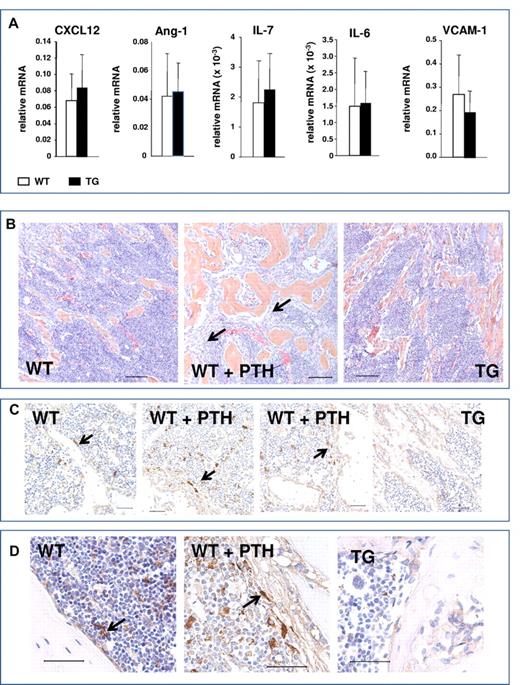
Activation of osteoblastic cells in response to PTH increases several osteoblastic signals, including CXCL-12 (also known as SDF-1) and IL-6.3 In addition, other signals have been implicated in HSC regulation by the niche, including angiopoietin 1 (Ang-1),18 IL-7, and VCAM-1, which were also recently found to be preferentially expressed in Nestin+ cells.5 Quantitative RT-PCR analysis comparing gene expression in bones from TG and WT mice demonstrated no significant changes in the expression of these pro-HSC signals (Figure 8A). Therefore, activation of the PTH1R in osteocytes, while sufficient to expand the osteoblastic population, did not increase osteocytic signals that have been reported to mediate microenvironmental expansion of HSCs.
Lack of osteocytic pro-HSC signals and absence of spindle-shaped cells in mice with activation of the PTH1R in osteocytes. (A) Quantitative RT-PCR analysis comparing gene expression in bones from TG and WT mice pro-HSC signals: CXCL12, Ang-1, IL-7, IL-6, and VCAM-1. (B) H&E staining of longitudinal sections of representative femora and tibiae of 4- to 6-week-old WT, PTH-treated WT, and TG mice, as indicated. Black arrows point to the immature spindle-shaped osteoblastic cells. Magnification is 20×. Bars indicate 0.1 mm. (C) Immunohistochemistry using Nestin Abs of femur from 4- to 6-week-old WT, PTH-treated WT, and TG mice, as indicated. Arrows point to Nestin+ spindle-shaped immature osteoblasts, blue hematoxylin. Magnification is 40×. Bars indicate 0.05 mm. (D) Immunohistochemistry using Nestin Abs of tibia from 6-week-old WT, PTH-treated WT, and TG mice, as indicated. Arrows point to Nestin+ spindle-shaped immature osteoblasts, blue hematoxylin. Magnification is 60×. Bars indicate 0.05 mm.
Lack of osteocytic pro-HSC signals and absence of spindle-shaped cells in mice with activation of the PTH1R in osteocytes. (A) Quantitative RT-PCR analysis comparing gene expression in bones from TG and WT mice pro-HSC signals: CXCL12, Ang-1, IL-7, IL-6, and VCAM-1. (B) H&E staining of longitudinal sections of representative femora and tibiae of 4- to 6-week-old WT, PTH-treated WT, and TG mice, as indicated. Black arrows point to the immature spindle-shaped osteoblastic cells. Magnification is 20×. Bars indicate 0.1 mm. (C) Immunohistochemistry using Nestin Abs of femur from 4- to 6-week-old WT, PTH-treated WT, and TG mice, as indicated. Arrows point to Nestin+ spindle-shaped immature osteoblasts, blue hematoxylin. Magnification is 40×. Bars indicate 0.05 mm. (D) Immunohistochemistry using Nestin Abs of tibia from 6-week-old WT, PTH-treated WT, and TG mice, as indicated. Arrows point to Nestin+ spindle-shaped immature osteoblasts, blue hematoxylin. Magnification is 60×. Bars indicate 0.05 mm.
We and others have demonstrated the expansion of an immature, spindle-shaped stromal population of osteoblastic cells within the BM cavity in response to activation of PTH signaling in 2.3Col1 osteoblastic cells.13 This population of cells is of particular interest because it has been suggested recently that PTH treatment expands Nestin+ MSCs, which are highly supportive of HSCs in the BM.5 Immature, spindle-shaped stromal cells, found in close contact with hematopoietic cells, are greatly expanded during intermittent PTH treatment, as demonstrated by representative sections from femora and tibiae (Figure 8B). Cells with these morphological features were not observed in the TG mice (Figure 8B-D). Immunohistochemistry for Nestin positively identified a population of rare spindle-shaped cells that were found in association with the endosteum and at central locations in the BM (Figure 8C-D), as reported previously,5 whereas osteocytes were Nestin−. Interestingly, a low level of Nestin positivity was detected in cuboidal osteoblasts lining the trabeculae, perhaps representing an immature osteoblastic population. In vivo PTH treatment expanded the Nestin+ population, although this represented only a subset of the spindle-shaped cells that were identified morphologically in both low- and high-power images (Figure 8B-D). However, Nestin+ spindle-shaped cells were not expanded in TG mice (Figure 8C-D).
Discussion
In the present study, we report that in vivo activation of PTH receptor signaling in osteocytes does not increase HSPC number or function, despite increases in the osteoblastic cell pool. In fact, in TG mice, there was a progressive loss of BM support for HSCs. In contrast, mice with constitutive activation of the PTH1R in immature and maturing osteoblasts (Col1-caPTH1R) had increased osteoblastic cells with a corresponding expansion of phenotypic and functional HSPCs.3 Because PTH binds and activates its receptor on all cells within the osteoblastic lineage, but not HSCs, these data shed light on the osteoblastic BM population responsible for mediating the action of PTH in the BM, establish for the first time that osteocytic activation of the PTH1R is not sufficient to augment BM HSCs, and exclude osteocytes as the osteoblastic population required to initiate PTH-dependent HSC expansion (summarized schematically in supplemental Figure 4).
Abundant genetic data demonstrate the critical role of osteocytes in bone anabolism. In the setting of activation of osteocytes by PTH signaling, a robust expansion of the osteoblastic population has been observed,8 leading to the hypothesis that osteocyte-dependent osteoblastic expansion may also increase BM HSCs. Instead, the results of the present study separate PTH-dependent osteoblastic expansion and its anabolic effect from its ability to expand HSCs. This disassociation has also been demonstrated in strontium ranelate treatment.19 Interestingly, recent data in human osteoblastic cells have suggested that stimulation of Wnt signaling mediates the osteogenic effects of strontium through decreased Sclerostin levels,20 which is strongly diminished in TG mice.8 Therefore, these results suggest that potential Sclerostin-targeted therapies21,22 would not achieve HSC expansion despite their osteogenic actions.
Interpretation of the present data relies heavily on specific osteocytic expression of the transgene. The fragment of the DMP1 gene promoter used in TG mice has been demonstrated to direct transgene expression specifically to newly embedding and embedded osteocytes.8,10,23,24 The mutated human PTH1R used herein, which was first described in the setting of Jansen metaphyseal chondrodysplasia,25,26 is the same mutated receptor used to target activation of PTH signaling in 2.3Col1 osteoblastic cells, which results in increased trabecular bone13 and expansion of HSCs.3 Therefore, the lack of HSC expansion in TG mice must be attributed to the differential effects of equal activation of PTH signaling in the distinct osteoblastic populations targeted by the unique promoters used.
The characteristics of the population of cells in the osteoblastic lineage that supports HSC remain controversial. Recent data strongly suggest that MSCs provide HSC support within the BM microenvironment.5 However, data have also supported a role for more mature osteoblastic cells in HSC regulation. Two studies have suggested that HSC-supporting cells are osteocalcin+ osteoblasts, based on immunofluorescence data demonstrating the proximity of HSCs to these cells.18,27 Several studies have recently isolated cells of the osteoblastic lineage28-30 and, whereas some results have suggested that hematopoietic progenitors are preferentially supported by immature osteoblastic cells,29,31 others found that multiple fractions within the osteoblastic lineage could support HSCs, at least in vitro.28,30 Data on the effects of osteoblastic deficiency induced in a transgenic mouse model expressing herpesvirus thymidine kinase gene under the control of a 2.3-kb fragment of the rat collagen-α1 type I gene promoter suggest that osteoblastic cells targeted by this promoter, as well as their osteoblastic and osteocytic progeny, comprise the pool of osteoblastic cells capable of HSC regulation and support.32 Ex vivo coculture systems designed to specifically identify HSC-supportive cell subsets28-31 have not been evaluated for osteocytic signals and, given the mode and duration of coculture, are not likely to include osteocytic-type cells. Because, in TG mice, the osteocyte population is greatly expanded8 and HSC support is decreased, the results of the current study also suggest that osteocytes are likely not a regulatory component of the HSC niche.
The lack of HSC expansion in TG mice provides strong evidence that immature cells in the osteoblastic lineage mediate the PTH-dependent HSC increase. Surprisingly, the data presented herein also suggest that osteocyte-specific activation of PTH signaling instead diminishes microenvironmental support for HSCs in the BM. This conclusion is supported by competitive repopulation assays demonstrating decreased function of HSCs from TG mice characterized by progressive displacement of phenotypic HSPCs to the spleen and ultimately by defective hematopoiesis resulting in neutropenia.
The mobilization of immature hematopoietic cells toward extramedullary sites in TG mice is in contrast to findings in Col1-caPTH1R mice, in which extramedullary hematopoiesis was not identified despite thorough analysis of spleen, liver, and thymus.3 Moreover, in another model of osteoblastic activation also targeting 2.3Col1 osteoblastic cells, in which there is near obliteration of the BM cavity, extramedullary hematopoiesis was not detected.33 Migration of LSK cells and pLT-HSC cells to the spleen was instead observed with selective deletion of Nestin+ cells, which was interpreted as evidence for reduced BM microenvironmental support of HSCs in that experimental setting.5 Data have suggested that murine spleen LSK cells retain their reconstitution capability.5,34 Therefore, lack of support of HSCs by a cellular population in the BM, rather than crowding of the BM cavity, may explain the migration of immature hematopoietic cells to the spleen, particularly at early time points.
In the present study, neutropenia was identified in adult TG mice. This finding may represent early evidence of progressive cytopenias as a result of displacement of phenotypic HSC due to a reduction of supportive niches in the BM. However, the current data cannot exclude a decrease in support of myelopoiesis and myeloid precursors alone or in addition to the effects on HSCs because of the microenvironmental changes initiated by osteocyte activation.
PTH-dependent expansion of a population of peritrabecular stromal cells has been described in PTH excess (hyperparathyroidism),35 with pharmacologic PTH treatment, and in 2.3Col1-caPTH1R mice.13,36,37 Despite robust osteoblastic expansion, this population was not increased in TG mice in the present study, a finding consistent with the activation and expansion of mature osteoblasts and osteocytes in this model. Definition of these spindle cells remains elusive, although much data suggest that they represent an immature osteoblastic population.13,35,36 Our immunohistochemistry results are consistent with previous data demonstrating that PTH expands Nestin+ MSCs, whereas this population was not detected in TG mice, resulting in reduced microenvironmental support for HSCs based on loss of a critical niche population in the BM. Our studies suggest that the peritrabecular cells, where were expanded after PTH treatment but not in TG mice, includes the Nestin+ MSCs identified by Mendez-Ferrer et al.5
The decreased microenvironmental support of HSCs in TG mice was unexpected, particularly at times when there was no reduction in BM cellularity. This unanticipated effect of osteocyte activation is of great clinical interest, because it suggests detrimental hematopoietic consequences to the use of therapies that increase osteoblastic cells and bone by modulating osteocytic products.21 Therefore, our data suggest that hematopoietic parameters should be monitored in patients receiving therapies that inhibit Sclerostin function.
In summary, this study demonstrates that, despite increased osteoblastic cells, activation of PTH signaling in osteocytes does not expand HSCs and instead leads to decreased BM microenvironmental support of HSCs. The progressive loss of BM HSC support in TG mice may be because of a gradual reduction in immature, peritrabecular cells. These data strongly suggest that osteocytes and mature osteoblasts do not support HSCs, and point to less-mature osteoblastic cells as the stimulatory compartment within the endosteal HSC niche. These results suggest that therapies aimed at modulating osteocytic products such as Sclerostin with the goal of expanding osteoblastic cells may negatively affect BM support of HSCs.
The online version of this article contains a data supplement.
The publication costs of this article were defrayed in part by page charge payment. Therefore, and solely to indicate this fact, this article is hereby marked “advertisement” in accordance with 18 USC section 1734.
Acknowledgments
The authors thank Racheal Lee, Jeffrey Benson, and Mary Georger for technical assistance, and Dr Marshall A. Lichtman for helpful discussion of this manuscript.
This work was supported by the National Institute of Diabetes, Digestive and Kidney Diseases, National Institutes of Health (R01 DK076876 and R01DK081843 to L.M.C., and R01 DK076007 and S10-RR023710 to T.B.) and by the Pew Foundation (L.M.C.).
National Institutes of Health
Authorship
Contribution: O.B., Y.R., J.M.W., J.N.P.S., M.B., and B.J.F. performed the experiments; L.M.C., O.B., J.M.W., B.J.F., and T.B. analyzed the data; and L.M.C. and T.B. designed the research and wrote the manuscript.
Conflict-of-interest disclosure: The authors declare no competing financial interests.
The current affiliation for Y.R. is Department of Internal Medicine, College of Medicine, Yonsei University, Seoul, Korea.
Correspondence: Laura M. Calvi, MD, Endocrine Division, Department of Medicine, University of Rochester School of Medicine, 601 Elmwood Ave, Box 693, Rochester, NY 14642; e-mail: laura_calvi@urmc.rochester.edu; or Teresita Bellido, PhD, Department of Anatomy and Cell Biology, and Department of Internal Medicine, Division of Endocrinology, Indiana University School of Medicine, 635 Barnhill Dr, MS5035, Indianapolis, IN 46202; e-mail: tbellido@iupui.edu.


This feature is available to Subscribers Only
Sign In or Create an Account Close Modal