Abstract
The ontogenic relationship between the common dendritic cell (DC) progenitor (CDP), the committed conventional DC precursor (pre-cDC), and cDC subpopulations in lymphoid and nonlymphoid tissues has been largely unraveled. In contrast, the sequential steps of plasmacytoid DC (pDC) development are less defined, and it is unknown at which developmental stage and location final commitment to the pDC lineage occurs. Here we show that CCR9− pDCs from murine BM which enter the circulation and peripheral tissues have a common DC precursor function in vivo in the steady state, in contrast to CCR9+ pDCs which are terminally differentiated. On adoptive transfer, the fate of CCR9− pDC-like precursors is governed by the tissues they enter. In the BM and liver, most transferred CCR9− pDC-like precursors differentiate into CCR9+ pDCs, whereas in peripheral lymphoid organs, lung, and intestine, they additionally give rise to cDCs. CCR9− pDC-like precursors which are distinct from pre-cDCs can be generated from the CDP. Thus, CCR9− pDC-like cells are novel CDP-derived circulating DC precursors with pDC and cDC potential. Their final differentiation into functionally distinct pDCs and cDCs depends on tissue-specific factors allowing adaptation to local requirements under homeostatic conditions.
Introduction
Dendritic cells (DCs) are essential initiators of immunity and link innate to adaptive antimicrobial immune responses. DCs are also critically involved in maintaining immune tolerance against self-Ags and harmless environmental Ags to prevent autoimmune and inflammatory reactions.1 Murine DCs found in lymphoid and nonlymphoid tissues in the steady state can be broadly classified into tissue-resident conventional or classic DCs (cDCs) and plasmacytoid DCs (pDCs). DCs residing in nonlymphoid tissues are also called migratory DCs because of their ability to migrate and carry Ags derived from the tissues to lymph nodes via lymphatics. CDC subpopulations residing in the spleen and lymph nodes comprise 2 major functionally distinct subpopulations, the CD8α+CD11b− cDCs (which are efficient in cross-presenting Ags to CD8+ T cells), and the CD8α−CD11b+ cDCs which are potent stimulators of Th-cell responses.1 Likewise, 2 major distinct subpopulations can be found in nonlymphoid tissues, namely CD103+ and CD11b+ cDCs.2,3 CD103+CD11b− cDCs in nonlymphoid tissues, such as skin, lung, and intestine are functional equivalents of CD8α+CD11b− splenic cDCs,4-7 while the relationship of nonlymphoid tissue CD11b+ DCs to CD8α−CD11b+ cDCs remains unclear.
PDCs are found in BM and blood as well as in peripheral lymphoid and nonlymphoid organs. Interestingly, the frequency of pDCs among all CD11c+ DCs is high in the BM and in the liver, but much lower in spleen, lymph nodes, and other organs. PDCs are functionally characterized by producing high amounts of type I IFNs in response to viruses, which they sense via TLRs 7 and 9.8 There is evidence that in addition to their role in secreting IFNs and inflammatory cytokines, pDCs can function as APCs.9 Depending on their localization, activation state, and mechanism of Ag internalization, pDCs can induce protective adaptive immunity or immune tolerance.10-12 PDCs in the liver, for example, play a central role for induction of tolerance to orally administered Ags.13
Recent studies have worked out distinct developmental stages of DCs during their development from hematopoietic progenitors to fully differentiated DCs. A common DC progenitor (CDP) has been found in murine BM, which is restricted to DC development and gives rise to cDCs as well as pDCs.14,15 The CDP was shown to generate a cDC-committed precursor (pre-cDC), which circulates in the blood and can migrate to peripheral lymphoid and nonlymphoid organs where it gives rise to cDC subpopulations.6,16-18 The current model for pDC development says that pDCs arise from CDPs and are fully differentiated in the BM before they enter the blood stream and then migrate to peripheral tissues. The existence of a pDC-biased or pDC-committed precursor which can exit the BM and differentiate locally in the steady state has so far not been demonstrated.
We have recently identified a potential candidate pDC precursor in murine BM. This cell type expresses CD11c and pDC-specific surface molecules BST2 and Siglec-H but lacks or expresses low levels of CCR9 and low levels of MHCII in contrast to differentiated pDCs, which are CCR9+ and express higher levels of MHCII.19 This population expresses transcription factor E2-2 which drives pDC lineage differentiation and produces large amounts of type I IFN in response to TLR9 stimulation, demonstrating affiliation to the pDC lineage. While these CCR9− BM pDCs spontaneously differentiate into CCR9+ pDCs, they also give rise to cDC-like cells after exposure to intestinal epithelial cell–derived factors or recombinant GM-CSF in vitro. This diversion form the pDC lineage is accompanied by down-regulation of E2-2 and up-regulation of transcription factors involved in cDC development, such as Id2.19
Here we show that these CCR9− pDC-like cells from murine BM are CDP-derived migratory common DC precursors with a bias to generate pDCs but with a significant potential to contribute to the cDC pool in vivo in the steady state. Final differentiation of these pDC-like precursors depends on the tissue microenvironment thus allowing adaptation of DC subset composition to the local requirements of different organs.
Methods
Mice
Specific pathogen-free (SPF), female 6- to 8-week-old C57BL/6 mice (CD45.2) were purchased from Harlan Winkelmann. Cx3cr1-eGFP reporter mice,20 Fucci transgenic mice,21 CSF2rβ−/− mice,22 and CD45.1 mice (C57BL/6 background) were bred under SPF conditions. Experiments were performed in accordance with German animal care and ethics legislation and have been approved by the local government authorities.
Expansion of DCs in vivo
DCs were expanded by implantation of 5 × 10⁶ cells of a B16 Flt3L-secreting melanoma cell line23 subcutaneously in the neck of 6- to 8-week-old mice for 7 days.
Cell culture
B16 Flt3L-secreting melanoma cells were cultured before implantation for 3 days in RPMI 1640, 10% FCS, 1% Glutamax, 1% nonessential amino acid, 1% sodium pyruvate, 1% penicillin/streptomycin (all Life Technologies) in a humidified incubator at 37°C and 5% CO2.
Primary cell isolation
Blood was collected by heart puncture, spun down, and RBCs were lysed before analysis. BM cells were flushed out of femura and tibiae of the mice, and a single-cell suspension was prepared by vigorous pipetting. Mice were carefully perfused with ice-cold PBS before excision of tissues. Spleen (Spl), Peyer patches (PP), mesenteric and inguinal lymph nodes (LN) and lung (Lg) were digested with collagenase D (500 μg/mL; Roche) and DNase I (100 μg/mL; Roche). Liver (Li) was digested with DNase I and collagenase IV (500 μg/mL; Roche); lymphocytes were enriched by Percoll gradient centrifugation (40% Percoll [Sigma-Aldrich], 800g, room temperature). Small intestinal (SI) and colonic leukocyte preparations (combined lamina propria and intraepithelial leukocytes) were prepared as described.24 RBC lysis was performed on spleen, BM, lung, and liver cells. Single-cell suspensions from these organs and from BM were stained with the indicated fluorescently labeled Abs and analyzed by flow cytometry or sorted.
Primary cell sorting
CCR9− pDC-like precursors or CCR9+ pDCs were sorted from the BM of Flt3L-expanded mice by gating on Siglec-HhighBST2highCD11cint cells and discriminating them by CCR9−/low and CCR9high expression. CDPs were sorted as Lin− (CD19, B220, CD3, NK1.1), MHC class II−, CD11c−, CD135+, CD115+, CD117−/low from BM cells of untreated mice which had been enriched for CD135+ cells using MACS technology (αCD135-bio [eBioscience]; αbio-beads [Miltenyi Biotec]). FACS sorting was performed on a MoFlow cell sorter (Beckman Coulter).
CDP in vitro culture
CDPs were sorted as described in the previous paragraph and 7 × 10⁴ CD45.2+ CDPs were cocultured together with 4.5 × 10⁶ CD45.1+ feeder BM cells in a 6-well plate for 4 days in DC medium (RPMI 1640 [Promocell], 10% FCS, 1% Glutamax, 1% nonessential amino acid, 1% sodium pyruvate, 1% penicillin/streptomycin [all Life Technologies], 50μM β-mercaptoethanol [Sigma-Aldrich]) supplemented with 20 ng/mL rhFlt3L (prepared in our laboratory).
Morphologic analysis
For morphologic analysis, CCR9− pDC-like precursors and CCR9+ pDCs were sorted as described and cytospins were prepared. Diff-Quick stain (Medion Diagnostics) was performed, microscopy slides were assessed, and images were captured using an Imager MR2 microscope and Axio cam Mrc 5 (both Zeiss) 100× magnification oil-immersion objective. Images were processed using AxioVision software (Zeiss) and Photoshop CS4 (Adobe Systems).
Determination of proliferation
Proliferation was assessed using the Fucci-transgenic mouse strain expressing the green fluorescent cell-cycle indicator dye mAG-hGeminin which allows assessment of proliferation in vivo.21
Adoptive transfer of pDCs and precursors
To track CCR9− pDC-like precursors or CCR9+ pDCs in vivo up to 48 hours, cells were labeled with 5μM Violet trace cell dye (Invitrogen) for 20 minutes at 37°C and washed twice with PBS supplemented with 5% FCS. A total of 5 × 10⁵ cells were injected intravenously into the tail vein of unirradiated steady-state mice. Detection of transferred cells was not affected at this time point because only a low percentage of cells diluted the dye and these cells underwent only 1-2 divisions within 48 hours. For analysis at later time points after transfer, 5 × 10⁵ CCR9− pDC-like cells were purified from CD45.2+ mice and injected into the tail veins of CD45.1+ congenic unirradiated mice and analyzed 7 days later. CD45.2+ CDPs were sorted as described in “Primary cell sorting” and 1 × 10⁵ CDPs were injected into the tail veins of CD45.1+ congenic unirradiated mice and analyzed 5 or 7 days later.
Flow cytometry
For FACS analysis, cells were stained using fluorescently labeled Abs directed against the indicated cell-surface Ags (CCR9-PE/allophycocyanin, CD11c-PeCy7, CD11b-PeCy5.5, MHCII-allophycocyanin-eFluor780/eFluor450, CD103-PE/allophycocyanin, CD8α-allophycocyanin-eFluor780/eFluor450; eBioscience) as described. Anti-BST2 (120G8, rat IgG1)25 and anti–Siglec-H Abs (440c, rat IgG2b)26 were conjugated with FITC or Alexa 647. Propidium iodide (PI) was added to exclude dead cells from analysis. Cells were acquired using a Gallios flow cytometer (Beckman Coulter).
Gene expression analysis
CCR9+ pDCs and CCR9− pDC-like precursors were isolated from BM of unmanipulated C57BL/6 mice (6- to 8-weeks old) as described in “Primary cell isolation.” RNA was extracted with the Ambion mirVana miRNA isolation kit (Life Technologies). For each sample, 50 ng of total RNA was labeled with the TargetAmp-Nano Labeling Kit for Illumina Expression BeadChip (Epicentre Biotechnologies) and hybridized onto Mouse WG-6 v2 Beadchips (Illumina Inc). Arrays were scanned with a BeadArray Scanner 500GX (Illumina Inc). Chip images were analyzed using GenomeStudio Gene Expression Version 1.8.0 (Illumina Inc). Data were Loess normalized; only probes with at least one significant detection value were included in the analysis. Multiple probes of genes were collapsed to the probe with the highest average expression value. Three independent microarray experiments were performed for each population (3 separate isolations of the 2 populations from 3 individual mice, 6 microarrays).
DC and DC progenitor gene sets
To build DC and DC progenitor gene sets, we used arrays from the ImmGen project (accessed at GEO, Series GSE15907. GSM791114-6 were used as CDP, GSM791105-7 as MDP, GSM538248-51/GSM538258-61/GSM538265-7/GSM605826-7/GSM605837-9 as cDC, GSM605840-5 as pDC). CEL files were RMA-normalized using Expression Console software (Version 1.1; Affymetrix Inc). Gene sets specific for each cell type were extracted using the GenePattern analysis platform (Broad Institute of Massachusetts Institute of Technology [MIT] and Harvard University). In brief, DC array data were preprocessed using the platform's default parameters (PreprocessDataset module). Then, the ComparativeMarkerSelection module and the ExtractComparativeMarkerResults modules were used. For each cell type, the 200 most specific genes were extracted. Of these, all up-regulated genes were used for comparison with our own gene expression data.
Statistical analysis
The unpaired, 2-tailed Student t test was used to determine statistically significant differences.
Results
CCR9− but not CCR9+ murine BM pDCs show a DC progenitor gene expression signature
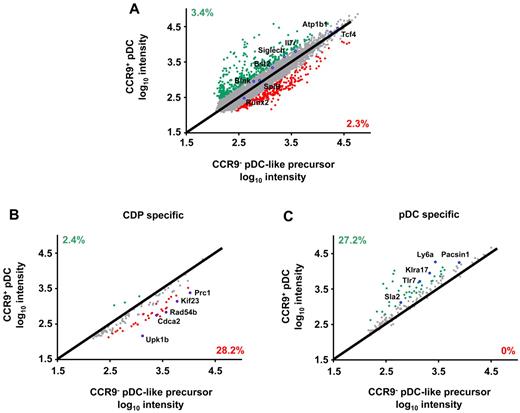
We have previously shown that although the phenotype and secretory function of CCR9− and CCR9+ pDCs are very similar, only the CCR9− population is flexible to divert from the pDC lineage and generate cDC-like cells in vitro.19 We therefore searched for differentially expressed genes between these 2 populations to explain this difference. The genome-wide expression profile of CCR9+ and CCR9− CD11c+BST2+Siglec-H+ cells freshly isolated from murine BM of unmanipulated C57BL/6 mice was compared. As shown in Figure 1A, 379 genes were expressed > 2-fold higher in CCR9+ than in CCR9− BM pDCs (3.4%) and 258 genes were expressed > 2-fold higher in CCR9− than in CCR9+ BM pDCs (2.3%). The genes encoding major transcription factors driving pDC lineage differentiation, such as Tcf4 (E2-2) and Spib27,28 as well as genes encoding pDC-specific cell-surface molecules Siglec-H29 and Bst2,30 showed < 2-fold differences in expression between the 2 populations. Pairwise comparison confirmed the higher expression of CD8α, Ly6a (Sca-1), CXCR3, CD86, and CIITA (class II MHC transactivator) in CCR9+ than CCR9− BM pDCs as expected from our previous phenotypic analysis.19 Annotation of the differentially expressed genes showed that genes involved in DC function were preferentially expressed in CCR9+ pDCs (supplemental Table 1, available on the Blood Web site; see the Supplemental Materials link at the top of the online article), while genes involved in cell-cycle events and indicated in cell development were overrepresented in the CCR9− population (supplemental Table 2).
Global gene expression analysis in primary CCR9− and CCR9+ pDCs isolated from murine BM. (A) Gene expression profiles of CCR9+ and CCR9− pDCs from murine BM were analyzed by microarray and compared with signature gene sets generated from the Immgen database. Pairwise comparison of mean signal intensities of all genes of the CCR9− and CCR9+ pDC subsets is shown. Expression of (B) CDP-specific genes and (C) pDC-specific genes was compared in CCR9− and CCR9+ pDC subsets. Genes overexpressed > 2-fold in CCR9− pDCs are shown in red; genes overexpressed > 2-fold in CCR9+ pDCs are indicated in green. Selected genes are highlighted by a blue circle. The percentage of differentially regulated genes among total genes is indicated.
Global gene expression analysis in primary CCR9− and CCR9+ pDCs isolated from murine BM. (A) Gene expression profiles of CCR9+ and CCR9− pDCs from murine BM were analyzed by microarray and compared with signature gene sets generated from the Immgen database. Pairwise comparison of mean signal intensities of all genes of the CCR9− and CCR9+ pDC subsets is shown. Expression of (B) CDP-specific genes and (C) pDC-specific genes was compared in CCR9− and CCR9+ pDC subsets. Genes overexpressed > 2-fold in CCR9− pDCs are shown in red; genes overexpressed > 2-fold in CCR9+ pDCs are indicated in green. Selected genes are highlighted by a blue circle. The percentage of differentially regulated genes among total genes is indicated.
Datasets from the ImmGen database31 were used to generate expression signatures of CDPs, MDPs, splenic cDCs, and splenic pDCs. Expression of these signature genes in CCR9+ and CCR9− BM pDCs was compared revealing that 35 DC progenitor signature genes are expressed at higher levels in the CCR9− than in the CCR9+ population (Figure 1B). MDP signature genes are similarly overrepresented in the CCR9− BM pDCs (supplemental Figure 1A). In contrast, 36 splenic pDC signature genes are expressed at higher levels in the CCR9+ than the CCR9− BM pDCs including, for example, Tlr7, Ly6a (Sca-1), Klra17 (Ly-49Q), Sla2, and Pacsin1 (Figure 1C) although many known splenic pDC signature genes27,32,33 are expressed at similar levels in the 2 populations, such as Tcf4, Spib, Siglec-H, Bst2, Il7r, Atp1b1, Blnk, and Runx2 (see Figure 1A). Comparison with the signature genes common to all cDC subpopulations showed that these were similarly expressed in both populations with few exceptions (see supplemental Figure 1B). Thus, global gene expression analysis revealed that CCR9− pDC-like cells share gene expression patterns of both DC progenitors and pDCs. However, pDCs and pDC-like precursors coexpressing CD11c, BST2, and Siglec-H are distinct from CDPs which lack CD11c expression15 and they are Lineage+ and MHCII+ in contrast to pre-cDCs as defined by Liu et al17 (supplemental Figure 2A). Hence, there is no relevant overlap of CCR9− pDC-like precursors with CDPs and pre-cDCs.
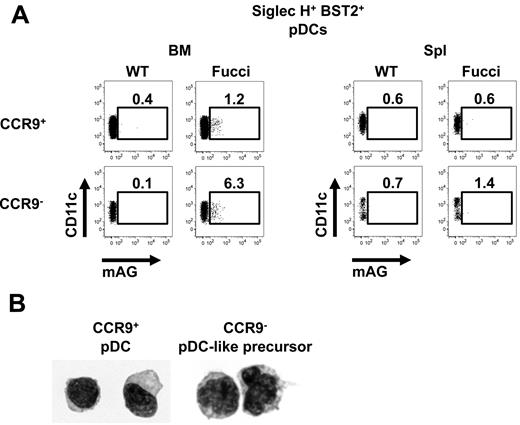
To validate the higher proliferative activity of CCR9− versus CCR9+ pDCs as indicated by our gene array data, the fluorescent, ubiquitination-based cell-cycle indicator (Fucci) transgenic mouse was used, which expresses a green-fluorescent cell-cycle indicator mAG-hGeminin accumulating in S/G2/M phases of the cell cycle.21 In the BM, the proliferative capacity of CCR9− pDC-like cells was higher than that of CCR9+ pDCs consistent with DC precursor function (Figure 2A left panels). In the spleen, the relative numbers of CCR9− pDC-like precursors in cell cycle was much lower than in the BM (Figure 2A right panels). Cytospin preparations of cells sorted from the BM showed that CCR9− pDC-like precursors are bigger cells with a more irregular indented nucleus resembling CDPs and pre-cDCs by morphology.15,18 In contrast, CCR9+ BM pDCs are smaller and have the classic plasmacytoid morphology with a round shape and an excentric nucleus (Figure 2B). Thus, although CCR9− pDC-like precursors phenotypically and functionally largely overlap with CCR9+ differentiated pDCs, they share the gene expression profile, proliferative capacity, and morphology of DC progenitor or precursor cells.
Proliferation and morphology of CCR9− pDC-like precursors in BM and spleen. (A) Expression of CD11c and the genetically encoded green-fluorescent cell-cycle indicator (mAG-hGeminin) was analyzed in primary Siglec-H+BST2+PI− cells from BM and spleen by flow cytometry. Fucci-transgenic mice expressing mAG-hGeminin were used and compared with WT control mice. (B) Morphology of CCR9− pDC-like precursors and CCR9+ pDCs isolated from BM was assessed on cytospin samples with a 100× magnification oil-immersion objective.
Proliferation and morphology of CCR9− pDC-like precursors in BM and spleen. (A) Expression of CD11c and the genetically encoded green-fluorescent cell-cycle indicator (mAG-hGeminin) was analyzed in primary Siglec-H+BST2+PI− cells from BM and spleen by flow cytometry. Fucci-transgenic mice expressing mAG-hGeminin were used and compared with WT control mice. (B) Morphology of CCR9− pDC-like precursors and CCR9+ pDCs isolated from BM was assessed on cytospin samples with a 100× magnification oil-immersion objective.
CCR9− pDC-like precursors migrate to peripheral organs
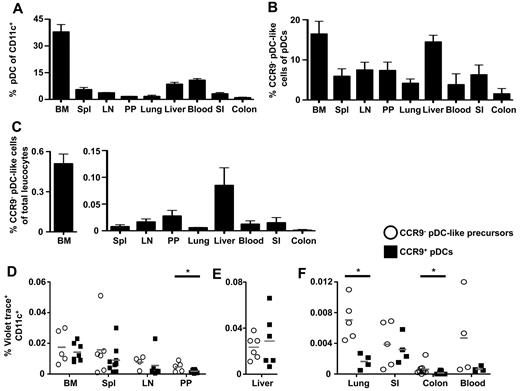
CDC committed precursors (pre-cDCs) were found to migrate from the BM to peripheral lymphoid and nonlymphoid organs, where they further develop into cDC subpopulations.6,17 We hypothesized that CCR9− pDC-like precursors might be present in the blood and in peripheral tissues. BM, liver, and blood contained the highest numbers of pDCs expressing CD11c, BST2, and Siglec-H, whereas pDCs were less frequent in peripheral organs (Figure 3A). The relative numbers of cells lacking or expressing low levels of CCR9 among the CD11c+BST2+Siglec-H+ pDCs was highest in BM and liver, where the frequency of total pDCs is also high (Figure 3B). Substantial numbers of CCR9− pDC-like cells can be found in BM (0.51%), blood (0.01%), spleen (0.007%), lymph nodes (0.01%), Peyer patches (0.02%), as well as in liver (0.09%), lung (0.005%), small intestine (0.02%), and colon (0.001%) among all leukocytes (Figure 3C). Thus, CCR9− pDC-like precursors circulate in the blood and reside at least temporarily in peripheral tissues comparable with previously identified tissues-resident cDC committed precursors.
CCR9− pDC-like precursors are found in lymphoid as well as nonlymphoid organs. (A) The percentage of Siglec-H+ BST2+PI− pDCs in the CD11c+ fraction, (B) the percentage of CCR9− pDC-like precursors in Siglec-H+ BST2+ CD11cint PI− pDC fraction, and (C) the frequency of CCR9− pDC-like precursors in total PI− lymphocytes in BM, spleen, lymph nodes, Peyer patches, lung, liver, and blood in steady-state mice was determined by flow cytometry (mean ± SD, n = 4). The recovery of Violet trace+CD11c+ cells after intravenous transfer of CCR9− pDC-like precursors or CCR9+ pDCs was assessed 48 hours after transfer in (D) BM, spleen, lymph nodes, and Peyer patches, in (E) liver, as well as in (F) lung, small intestine, colon, and blood. (D-F) Gray lines indicate mean values (n = 4; Peyer patches, *P = .02; lung, *P = .003; colon, *P = .03; Student t test).
CCR9− pDC-like precursors are found in lymphoid as well as nonlymphoid organs. (A) The percentage of Siglec-H+ BST2+PI− pDCs in the CD11c+ fraction, (B) the percentage of CCR9− pDC-like precursors in Siglec-H+ BST2+ CD11cint PI− pDC fraction, and (C) the frequency of CCR9− pDC-like precursors in total PI− lymphocytes in BM, spleen, lymph nodes, Peyer patches, lung, liver, and blood in steady-state mice was determined by flow cytometry (mean ± SD, n = 4). The recovery of Violet trace+CD11c+ cells after intravenous transfer of CCR9− pDC-like precursors or CCR9+ pDCs was assessed 48 hours after transfer in (D) BM, spleen, lymph nodes, and Peyer patches, in (E) liver, as well as in (F) lung, small intestine, colon, and blood. (D-F) Gray lines indicate mean values (n = 4; Peyer patches, *P = .02; lung, *P = .003; colon, *P = .03; Student t test).
To investigate the homing capacity and developmental fate of CCR9− pDC-like precursors in vivo in comparison to CCR9+ differentiated pDCs, adoptive transfer experiments were performed using cells sorted from BM of C57BL/6 mice which had been exposed to Flt3L for 7 days. Flt3L-mediated expansion increased the percentage of CD11c+BST2+Siglec-H+ pDCs in the BM from 3.2 ± 0.4 to 9.8% ± 2.5% (mean ± SD) of all leukocytes, but did not alter the frequency of the CCR9− subset within this population (14.7% ± 3.2% vs 12.1% ± 3.2%). The phenotype of CCR9+ and CCR9− pDCs sorted from the BM of Flt3L-exposed mice was comparable with that of cells analyzed directly from BM of unmanipulated mice (supplemental Figure 2B and Schlitzer et al19 ).
Sorted cells were labeled with a Violet dye for their in vivo tracking and adoptively transferred into unmanipulated hosts. Both populations were found in the BM and peripheral lymphoid organs already 12 hours after IV injection (data not shown). The percentage of transferred Violet trace+ cells further increased after 24 and 48 hours in peripheral lymphoid organs but remained stable in the BM (data not shown). Accumulation of transferred CCR9− pDC-like precursors was comparable with that of CCR9+ pDCs at the 48-hour time point in BM, spleen, lymph nodes, liver, and small intestine, although a trend toward higher numbers of CCR9− pDC-like cells was observed in these organs (Figure 3D-F). In lung, Peyer patches, and colon a significantly higher frequency of transferred CCR9− pDC-like cells than CCR9+ pDCs was found. These results show that both CCR9− pDC-like precursors and CCR9+ pDCs are recruited to peripheral lymphoid and nonlymphoid organs and accumulate there. Taken together, we provide evidence that CCR9− pDC-like precursors can migrate to peripheral organs opening the possibility for their final differentiation to occur locally in tissues.
Transferred CCR9− pDC-like cells rapidly acquire a cDC-like phenotype in secondary lymphoid and mucosal tissues
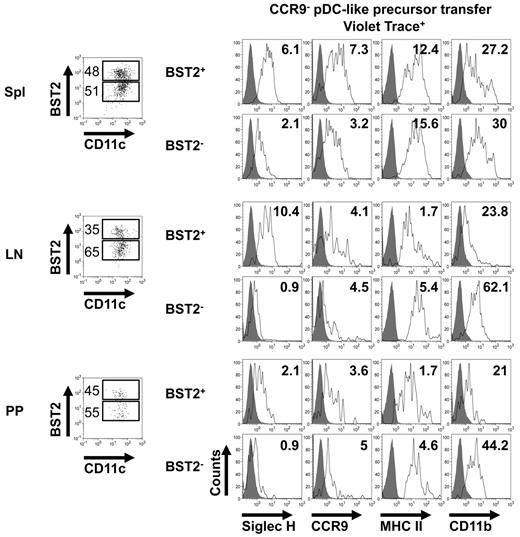
We had shown previously that in vitro CCR9−MHCIIlow pDC-like cells spontaneously differentiate into CCR9+MHCII+ pDCs, but can rapidly give rise to cDC-like cells in response to GM-CSF, which is produced mainly under inflammatory conditions.34 Our hypothesis was therefore that CCR9− pDC-like precursors would be committed to differentiate into pDCs in vivo in the steady state. Transferred CCR9− pDC-like precursors found in BM and liver after 48 hours largely maintained their pDC phenotype reflected in high-level expression of BST2 and Siglec-H (see Figures 4A-B and 5) similar to transferred CCR9+ pDCs. Further phenotypic analysis (Figure 5) showed that BST2high cells derived from CCR9− pDC-like precursors after 48 hours in spleen, lymph nodes, and Peyer patches maintained high Siglec-H and low CD11b expression, but up-regulated CCR9 and MHC class II consistent with the phenotype of fully differentiated pDCs.
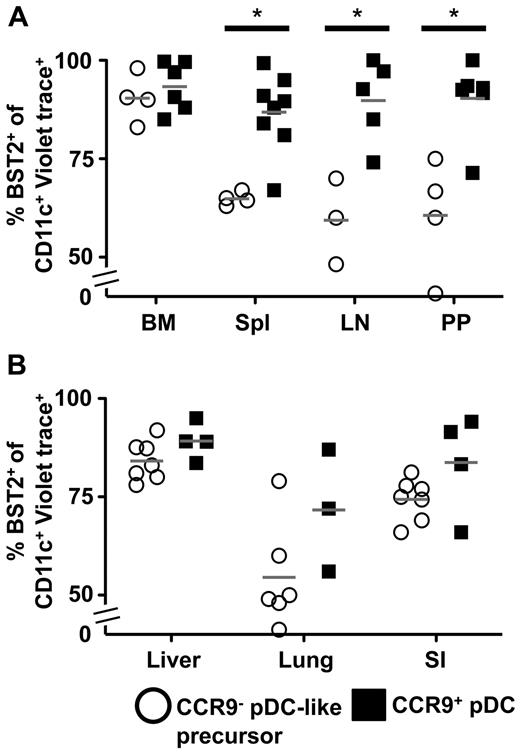
Transferred CCR9− pDC-like precursors rapidly down-regulate BST2 in a tissue-dependent manner. BST2 expression in Violet trace+CD11c+ transferred CCR9− pDC-like precursors or CCR9+ pDCs was analyzed by flow cytometry 48 hours after transfer in (A) BM, spleen, lymph nodes, and Peyer patches as well as (B) liver, lung, and small intestine. Gray lines indicate mean values (n = 4; spleen, *P = .02; lymph nodes, *P = .01; Peyer patches, *P = .02; Student t test).
Transferred CCR9− pDC-like precursors rapidly down-regulate BST2 in a tissue-dependent manner. BST2 expression in Violet trace+CD11c+ transferred CCR9− pDC-like precursors or CCR9+ pDCs was analyzed by flow cytometry 48 hours after transfer in (A) BM, spleen, lymph nodes, and Peyer patches as well as (B) liver, lung, and small intestine. Gray lines indicate mean values (n = 4; spleen, *P = .02; lymph nodes, *P = .01; Peyer patches, *P = .02; Student t test).
CCR9− pDC-like precursors acquire a cDC-like phenotype 48 hours after transfer. Analysis of BST2 and CD11c expression in Violet trace+ cells in spleen, lymph nodes, and Peyer patches 48 hours after transfer of CCR9− pDC-like precursors by flow cytometry (dot blots on the left, numbers indicate percentages of BST2high and BST2low cells). Analysis of Siglec-H, CCR9, MHCII, and CD11b expression (right panel, histograms) in the BST2high and BST2low fractions of Violet trace+CD11c+ cells 48 hours after transfer of CCR9− pDC-like precursors in spleen, lymph nodes, and Peyer patches (open histograms). Filled histograms indicate unstained control. Numbers in histograms indicate mean fluorescence intensity (MFI). Results of 1 representative of 3 experiments are shown.
CCR9− pDC-like precursors acquire a cDC-like phenotype 48 hours after transfer. Analysis of BST2 and CD11c expression in Violet trace+ cells in spleen, lymph nodes, and Peyer patches 48 hours after transfer of CCR9− pDC-like precursors by flow cytometry (dot blots on the left, numbers indicate percentages of BST2high and BST2low cells). Analysis of Siglec-H, CCR9, MHCII, and CD11b expression (right panel, histograms) in the BST2high and BST2low fractions of Violet trace+CD11c+ cells 48 hours after transfer of CCR9− pDC-like precursors in spleen, lymph nodes, and Peyer patches (open histograms). Filled histograms indicate unstained control. Numbers in histograms indicate mean fluorescence intensity (MFI). Results of 1 representative of 3 experiments are shown.
However, in contrast to CCR9+ pDCs, a significant percentage of transferred CCR9− pDC-like cells found in spleen, lymph nodes, and Peyer patches had already down-regulated BST2 at this time point and a similar trend was seen in lung and small intestine (Figure 4A-B). Cell numbers in the colon were too small for reliable analysis. Interestingly, BST2low cells derived from these CCR9− precursors had down-regulated Siglec-H while maintaining low CCR9 expression and had additionally up-regulated MHC class II and CD11b consistent with a cDC-like phenotype (Figure 5). Thus, CCR9− pDC-like precursors have the potential to rapidly generate both pDCs and cDC-like cells in the steady state depending on the tissue environment. In addition, the pDC and cDC developmental potential of CCR9− pDC-like precursors lacking expression of the GM-CSF receptor common β chain22 was comparable with that of WT cells in BM, spleen, lymph nodes, and Peyer patches (supplemental Figure 3). Thus, GM-CSF receptor signaling is not required for differentiation of these precursors into cDC-like cells in the steady state in vivo, suggesting the additional involvement of other tissue-specific factors.
pDC and cDC subtype differentiation potential of CCR9− pDC-like precursors in vivo is tissue-dependent
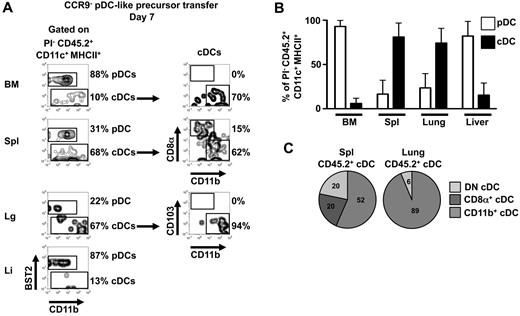
Phenotypic analysis 48 hours after adoptive transfer of CCR9− pDC-like precursors demonstrated that these precursors can not only rapidly generate pDCs, but also some cDC-like cells in lymphoid and nonlymphoid organs in the steady state. To investigate their potential to differentiate fully into cDC subpopulations at later time points, CCR9− pDC-like precursors (CD45.2) were transferred into CD45.1 recipients, and their phenotype was analyzed 7 days after transfer. In BM and liver, descendants of CCR9− pDC-like precursors were still predominantly pDCs, while in spleen and lung more cDCs than pDCs were derived from the transferred precursors at this time point (Figure 6A-B). Among the cDCs derived from transferred CCR9− pDC-like precursors, CD8α+CD11b− and CD8α−CD11b+ cDCs were found in the spleen, while only CD11b+CD103− cDCs were found in the lung (Figure 6C).
Tissue-specific generation of pDCs or cDC subpopulations on day 7 after transfer. (A) CD45.2+CCR9− pDC-like precursors were transferred into CD45.1+ steady-state mice intravenously and progeny were analyzed 7 days later by flow cytometry for the expression of BST2, CD11b, CD8α, and CD103 in BM, spleen, lung, and liver. Results of one representative of 3 experiments are shown. (B) The percentages of BST2+ pDCs and BST2− cDCs within CD45.2+CD11c+MHCII+PI− cells derived from transferred CCR9− pDC-like precursors after 7 days in BM, spleen, lung, and liver (mean ± SD, n = 3). (C) cDC subset compositions (CD8α+CD11b− cDCs, CD8α−CD11b+ cDCs, and double negative cDCs) in spleen and lung originating from CD45.2+CCR9− pDC-like precursors 7 days after transfer are depicted (mean, n = 3).
Tissue-specific generation of pDCs or cDC subpopulations on day 7 after transfer. (A) CD45.2+CCR9− pDC-like precursors were transferred into CD45.1+ steady-state mice intravenously and progeny were analyzed 7 days later by flow cytometry for the expression of BST2, CD11b, CD8α, and CD103 in BM, spleen, lung, and liver. Results of one representative of 3 experiments are shown. (B) The percentages of BST2+ pDCs and BST2− cDCs within CD45.2+CD11c+MHCII+PI− cells derived from transferred CCR9− pDC-like precursors after 7 days in BM, spleen, lung, and liver (mean ± SD, n = 3). (C) cDC subset compositions (CD8α+CD11b− cDCs, CD8α−CD11b+ cDCs, and double negative cDCs) in spleen and lung originating from CD45.2+CCR9− pDC-like precursors 7 days after transfer are depicted (mean, n = 3).
CDP give rise to CCR9− pDC-like precursors in vitro and in vivo
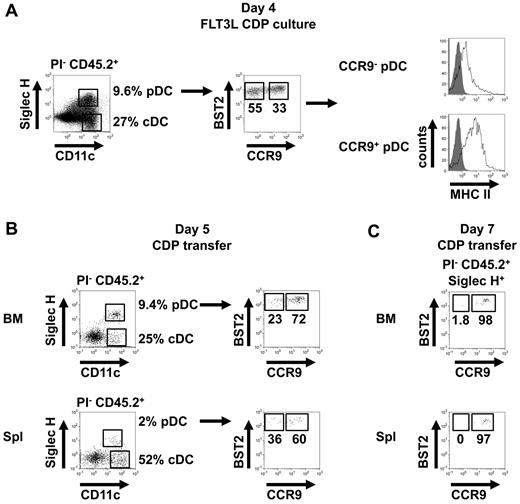
The CDP gives rise to both cDCs and pDCs. However, it is not proven that all pDCs are derived from CDPs. We therefore asked the question of whether CCR9− pDC-like precursors can be derived from CDPs. CDPs sorted as Lin−CD11c−MHCII−CD115+Flt3+CD117low cells from BM cells of unmanipulated C57BL/6 mice were cocultured with total BM feeder cells and Flt3L for 4 days, and the phenotype of their progeny was characterized. As expected, both pDCs and cDCs were generated from the CDPs. Within the CD11c+BST2+Siglec-H+ pDC population, ∼ 60% were CCR9−MHCIIlow, consistent with the described phenotype of CCR9− pDC-like precursors, whereas ∼ 30% were CCR9+MHCII+, consistent with a differentiated pDC phenotype (Figure 7A). Thus, CDPs are efficient in generating CCR9− pDC-like precursors.
CDPs give rise to CCR9− pDC-like precursors. (A) CD45.2+ CDPs were cultured for 4 days with total CD45.1+ BM cells in medium supplemented with Flt3L and analyzed for the expression of Siglec-H, CD11c, BST2, CCR9, and MHCII by flow cytometry (representative results of 4 replicates are shown). (B) CD45.2+ CDPs were transferred intravenously into CD45.1+ mice and the expression of Siglec-H, CD11c, BST2, and CCR9 on PI− CD45.2+ progeny was analyzed after 5 days in BM and spleen by flow cytometry (results of one representative of 3 transfers are shown). (C) CD45.2+ CDPs were transferred IV into CD45.1+ mice and the expression of BST2 and CCR9 on PI−CD45.2+Siglec-H+ progeny was analyzed 7 days later in BM and spleen by flow cytometry (results of one representative of 6 transfers are shown).
CDPs give rise to CCR9− pDC-like precursors. (A) CD45.2+ CDPs were cultured for 4 days with total CD45.1+ BM cells in medium supplemented with Flt3L and analyzed for the expression of Siglec-H, CD11c, BST2, CCR9, and MHCII by flow cytometry (representative results of 4 replicates are shown). (B) CD45.2+ CDPs were transferred intravenously into CD45.1+ mice and the expression of Siglec-H, CD11c, BST2, and CCR9 on PI− CD45.2+ progeny was analyzed after 5 days in BM and spleen by flow cytometry (results of one representative of 3 transfers are shown). (C) CD45.2+ CDPs were transferred IV into CD45.1+ mice and the expression of BST2 and CCR9 on PI−CD45.2+Siglec-H+ progeny was analyzed 7 days later in BM and spleen by flow cytometry (results of one representative of 6 transfers are shown).
The potential of CDPs to give rise to CCR9− pDC-like precursors was also tested in vivo by adoptive transfer into unirradiated C57BL/6 mice. Within the CD11c+BST2+Siglec-H+ pDC population derived from transferred CDPs after 5 days, CCR9− pDC-like precursors were detected in BM and spleen at a higher frequency within the pDC population than was usually found within endogenous pDCs in these organs (Figure 7B, compare with Figure 3B). In contrast, 7 days after transfer the frequency of CCR9− cells within the CDP-derived pDC population was very low in the BM and below detection in the spleen, suggesting further differentiation of CDP-derived CCR9− pDC-like precursors at later time points (Figure 7C). Thus, CDPs can generate CCR9− pDC-like precursors in vitro and in vivo. These newly identified precursors have already partially activated the genetic program of the pDC lineage and are therefore biased to differentiate into pDCs, especially in BM and liver, but can still contribute to the cDC pool in peripheral lymphoid and nonlymphoid tissues in the steady state.
Discussion
In this study, we demonstrate the existence of a novel DC precursor population positioned between the common DC progenitor and peripheral DC subpopulations which is distinct from pre-cDCs. This novel pDC-like DC precursor is efficient in generating pDCs but also makes a significant contribution to the cDC pool in the steady state. CCR9− pDC-like DC precursors are found at similar frequencies as pre-cDCs not only in BM but also in peripheral lymphoid and nonlymphoid organs where differentiation into pDCs and cDCs is completed. These results demonstrate that final differentiation of pDCs is not restricted to the BM but can occur in peripheral tissues. We provide evidence that the local tissue microenvironment determines the developmental fate of these novel precursors with a preference of BM and liver to promote differentiation into pDCs while other lymphoid and nonlymphoid organs favor the generation of cDC subsets from these precursors. This explains how composition of the DC compartment of functionally distinct pDC and cDC subpopulations can be regulated in different organs and adapted to site-specific requirements.
Gene expression profiling revealed that CCR9− pDC-like cells in murine BM bear a progenitor/precursor-type signature, which is not found in the CCR9+ pDCs. This newly identified precursor population expresses simultaneously pDC-specific genes and genes involved in progenitor/precursor function which are also found in CDPs. The low expression of genes involved in Ag presentation and interaction with adaptive immunity further reveals that these cells are not fully differentiated pDCs but rather precursors. Many of the genes specific for the pDC lineage, including transcription factors E2-2 and SpiB, are expressed at similar levels in both populations demonstrating affiliation with the pDC lineage. CCR9+ BM pDCs are, however, more closely related to differentiated pDCs in secondary lymphoid organs and express many genes involved in DC function at higher levels than CCR9− pDC-like cells.
Because the newly identifed precursor population is CD11c+MHCIIlow and is for the most part Lineage-positive because of expression of B220 and Ly-6C,19 it does not contain previously described CDPs14,15,17 and does not significantly overlap with pre-cDCs which are Lin−CD11c+MHCII−CD135+.17 In previous seminal studies defining DC progenitors and precursors,6,14,15,17 the common DC precursor population described here was excluded by restricting the analysis and isolation to Lin−MHCII− cells. CCR9− pDC-like precursors are also functionally distinct from pre-cDCs in that they are biased to give rise to pDCs while pre-cDCs are mostly restricted to cDC generation.17 CCR9+ pDCs were the prevailing population among early descendants of CCR9− pDC-like precursors in all organs examined. In BM and liver, CCR9+ pDCs were generated almost exclusively and maintained for at least 7 days. In addition, in other organs, a sizable population of pDC progeny larger than that reported for pre-cDC descendants was found although cDCs dominated on day 7 after transfer in spleen and lung.
The majority of cDC progeny derived from CCR9− pDC-like precursors in the spleen were CD8α−CD11b+, but a smaller population of CD8α+CD11b− cDCs was also found. In the lung, however, only CD103−CD11b+ cDCs but not the CD103+CD11b− equivalents of splenic CD8α+ cDCs were found. It is possible therefore that the CD8α+ cDC progeny found in spleen after 7 days are similar to a recently identified subpopulation of CD8α+CX3CR1+ DCs which is more closely related to the pDC lineage than the classic cross-presenting CD8α+ cDC population.32
In comparison to CCR9− pDC-like precursors, CCR9+ pDCs are mostly stable in their phenotype after transfer into mice in the steady state. The transcription factor E2-2 which is critical for pDC development27 actively maintains pDCs by inducing the transcriptional repressor Bcl11a and repressing the E2-2 inhibitor Id2.35 Deletion of E2-2 in differentiated pDCs leads to acquisition of a cDC-like phenotype similar but not identical to that of BST2low cells derived from CCR9− pDC-like precursors 48 hours after transfer in our study.35 We have previously shown that diversion of CCR9− pDC-like cells from the pDC developmental pathway in response to intestinal epithelial cell–derived factors in vitro is accompanied by down-regulation of E2-2 and E2-2 target gene expression and up-regulation of Id2, whereas E2-2 expression in CCR9+ pDCs remains stable under these conditions.19 Our results obtained from the adoptive transfer studies confirm the assumption that CCR9+ pDCs have only low potential to give rise to cDCs in the steady state, while CCR9− pDC-like cells are still highly flexible. Thus, stable high-level expression of E2-2 and a high E2-2/Id2 ratio appear to be required for stability of the pDC phenotype and function in CCR9+ pDCs in the steady state. It is currently unknown how expression, stability, and activity of E2-2 and Id2 are regulated during development of pDCs. Expression of E2-2 above a certain threshold may activate an autoregulatory loop which maintains E2-2 expression and pDC cell fate as was shown for other transcription factors.36 In addition, E2-2 expression may be stabilized by epigenetic modification.
It is striking that the frequency of pDCs within the DC compartment greatly differs between various tissues with high numbers in BM and liver but lower numbers in secondary lymphoid organs and even lower frequency in mucosal tissues. This could be not only because of differential recruitment or maintenance of pDCs at these sites, but also differentiation from a local progenitor with plasticity for pDC or cDC generation in response to cues from the microenvironment. In our study, we show that CCR9− pDC-like precursors are present in blood as well as peripheral lymphoid and nonlymphoid tissues. On adoptive transfer, CCR9− pDC-like precursors home to peripheral organs. The observation that CCR9− pDC-like precursors are derived from CDPs which are only found in BM in the steady state17 further supports the interpretation that these cells are migratory DC precursors which can differentiate in the tissues. In addition, CCR9− pDC-like precursors preferentially give rise to CCR9+ pDCs in BM, making it unlikely that cDCs first differentiate in the BM and then migrate to the tissues. It is possible, however, that pDCs differentiated from transferred CCR9− pDC-like precursors in the BM contribute to the pDC progeny found in the tissues at later time points.
Our study demonstrates that the tissue microenvironment determines the developmental fate of CCR9− pDC-like precursors. Apparently, these precursors find a specific niche in BM and liver which is conducive to pDC development and differentiation. It is currently unclear which factors within this niche support pDC differentiation or prevent cDC differentiation in these organs. Flt3L and M-CSF have been shown to promote pDC generation from precursors in vitro and in vivo,37-40 and specific local concentrations of these factors might favor pDC over cDC differentiation. Furthermore, IFN-α was shown to promote pDC generation via STAT1-mediated IRF8 induction.41 On the other hand, secondary lymphoid organs and mucosal tissues provide the microenvironment necessary for cDC differentiation. We have previously shown that GM-CSF can induce differentiation of CCR9− pDC-like precursors into cDC-like cells in vitro, and it was shown that GM-CSF prevents development of pDC from early progenitors by STAT5-mediated inhibition of IRF8 expression.42 However, GM-CSF receptor signaling did not prove to be the essential factor for driving cDC differentiation in vivo in the steady state. It is likely that a combination of soluble and cell-bound factors within a hypothetical “DC niche” in these organs regulates the expression and activity of transcription factors which make the final cell-fate decision for differentiation into pDC or cDC subpopulations.
Our study defines successive developmental steps from the CDP to CCR9− pDC-like precursors and further on to differentiated pDC and cDC subpopulations. The data presented here are consistent with a model in which CDPs give rise to several types of precursors which are already partially committed to specific DC subpopulations. These migrate via the blood to different organs and their final differentiation is governed by microenvironmental factors in the individual “DC niches” of these tissues. High flexibility during the final stages of DC development allows adaptation to tissue-specific and situational requirements.
The online version of this article contains a data supplement.
The publication costs of this article were defrayed in part by page charge payment. Therefore, and solely to indicate this fact, this article is hereby marked “advertisement” in accordance with 18 USC section 1734.
Acknowledgments
The authors thank Marco Colonna and Giorgio Trinchieri for providing reagents. They thank Lynette Henkel for cell sorting, and Pavandip Singh Wasan for help with microarray analysis. This work benefitted from data assembled by the ImmGen consortium.
A.B.K., A.S., and W.R. are supported by German Research Foundation grants KR2199/1-3, SFB 571, KR2199/3-1, KR2199/6-1. A.S. and A.F.H. are supported by GRK1482 and the Technical University Munich (TUM) Graduate School. F.G. is supported by core grants of the Singapore Immunology Network.
This work is part of A.S.'s thesis.
Authorship
Contribution: A.S. and A.B.K. designed the experiments, analyzed and interpreted the data, and prepared the manuscript; A.S., A.F.H., W.R., C.-P.M., P.S., and F.G. performed experiments; H.E. performed microarray analysis; M.S. performed cell sorting; J.H.N. and T.S. provided transgenic and knockout mice; and F.G. analyzed and interpreted data.
Conflict-of-interest disclosure: The authors declare no competing financial interests.
Correspondence: Anne B. Krug, MD, II Medical Department, Klinikum Rechts der Isar, Technical University Munich, Ismaninger Strasse 22, D-81675 Munich, Germany; e-mail: anne.krug@lrz.tum.de.

This feature is available to Subscribers Only
Sign In or Create an Account Close Modal