Key Points
Erythro-/thrombopoiesis is driven by the differentiation of bipotent thrombocytic-erythroid progenitors (TEPs) in vertebrates.
Clonogenic and proliferative capacity of TEPs, thrombocytic and erythroid progenitors, is conserved from nonmammalian vertebrates to man.
Abstract
In nonmammalian vertebrates, the functional units of hemostasis are thrombocytes. Thrombocytes are thought to arise from bipotent thrombocytic/erythroid progenitors (TEPs). TEPs have been experimentally demonstrated in avian models of hematopoiesis, and mammals possess functional equivalents known as megakaryocyte/erythroid progenitors (MEPs). However, the presence of TEPs in teleosts has only been speculated. To identify and prospectively isolate TEPs, we identified, cloned, and generated recombinant zebrafish thrombopoietin (Tpo). Tpo mRNA expanded itga2b:GFP+ (cd41:GFP+) thrombocytes as well as hematopoietic stem and progenitor cells (HSPCs) in the zebrafish embryo. Utilizing Tpo in clonal methylcellulose assays, we describe for the first time the prospective isolation and characterization of TEPs from transgenic zebrafish. Combinatorial use of zebrafish Tpo, erythropoietin, and granulocyte colony stimulating factor (Gcsf) allowed the investigation of HSPCs responsible for erythro-, myelo-, and thrombo-poietic differentiation. Utilizing these assays allowed the visualization and differentiation of hematopoietic progenitors ex vivo in real-time with time-lapse and high-throughput microscopy, allowing analyses of their clonogenic and proliferative capacity. These studies indicate that the functional role of Tpo in the differentiation of thrombocytes from HSPCs is well conserved among vertebrate organisms, positing the zebrafish as an excellent model to investigate diseases caused by dysregulated erythro- and thrombo-poietic differentiation.
Introduction
Hematopoiesis is driven by the self-renewal and differentiation of hematopoietic stem cells (HSCs). HSCs generate multipotent, oligo-potent, bipotent, and unipotent progenitors that further differentiate to generate the full repertoire of mature blood cells.1 These processes are tightly controlled through the activity of growth factors and cytokines, and their dysregulation can give rise to hematopoietic disorders including anemia, thrombocytopenia, neutropenia, and leukemia.
The direct downstream progeny of HSCs are multipotent progenitor cells (MPPs), which have significantly reduced self-renewal capabilities. MPPs further differentiate into either common lymphoid progenitors or common myeloid progenitors (CMPs). CMPs give rise to granulocyte-monocyte restricted progenitors, which generate the myelo-monocytic lineages, and bipotent megakaryocyte-erythrocyte progenitors (MEPs) that generate platelets and red blood cells (RBCs).
In nonmammalian vertebrates, mature RBCs are nucleated and the functional units of hemostasis are thrombocytes. In the chicken, each lineage has been demonstrated to arise through bipotent progenitors, termed thrombocytic/erythroid progenitors (TEPs), cells equivalent to mammalian MEPs.2 However, the presence of TEPs has only been speculated in teleosts.
The major cytokine that regulates erythropoiesis in vertebrates is erythropoietin (EPO),3 of which the zebrafish homolog has been identified4 and recombinantly generated.5,6 EPO’s primary effect is the stimulation of erythroid progenitor survival and differentiation, which is exerted by EPO binding to its cognate receptor and mediated through Janus kinase-signal transducer and activator of transcription (JAK/STAT) signaling.7 Erythrocytes develop through several serial stages of development, with each successive cell type progressively losing proliferative capacity.8 In mammals, the first wave of erythroid progenitors are known as burst-forming unit erythroid (BFU-E) due to their ability to form large colonies in vitro in semi-solid media. These progenitors are capable of 8 to 20 cell divisions, depending on the presence of cooperative factors in addition to EPO, such as insuline-like growth factor-1, SCF, and corticosteroids.9-12 As BFU-Es differentiate, they become more mature colony-forming unit erythroid cells (CFU-Es). CFU-E progenitors are generally capable of only 3 to 6 cell divisions, forming small, compact colonies highly responsive to EPO.9,10,12
Another key regulatory cytokine important for myelo-erythroid differentiation is thrombopoietin (TPO),13 responsible for the production of platelets/thrombocytes. Platelets are generated from polyploid megakaryocyte disintegration in mammals,14 and studies indicate that TPO stimulates 5 to 6 megakaryocyte endoreduplications.15,16 TPO interacts with its cognate receptor, C-MPL, which activates JAK/STAT signaling.17-19 TPO is a 4-helix bundle class I cytokine, and its amino-terminal domain has significant homology to EPO.20 In mammals, TPO’s C-terminal portion encodes a highly glycosylated regulatory domain.21,22 In addition to its key role in platelet/thrombocyte differentiation,2,23 TPO is important in the self-renewal of multi-potent progenitors24-26 and the expansion of erythroid progenitors when added combinatorially with EPO.27,28
To examine thrombopoiesis in zebrafish, we performed extensive genomic searches for Tpo homologs. We identified and cloned zebrafish tpo and found that its overexpression expanded thrombocytes and thrombocytic progenitors in developing zebrafish embryos. Additionally, recombinant zebrafish Tpo encouraged the in vitro generation of thrombocytes from hematopoietic stem and progenitor cells (HSPCs). Our data also indicate that putative bipotent TEPs can be isolated and generate zebrafish thrombocytes and erythrocytes. These studies set the stage for the further dissection of the branch points of the zebrafish hematopoietic hierarchy to enable comparative studies of how hematopoietic fate determination has been conserved during vertebrate evolution.
Materials and methods
Cell preparation and flow cytometry
Cells from embryos and whole kidney marrow (WKM) were prepared as previously described.5,29 In some experiments, mature erythrocytes were removed by Ficoll-Hypaque density centrifugation (termed “fractionated cells”). Otherwise, WKM was subjected to fluorescence-activated cell sorting (FACS) with an Influx cytometer (BD Biosciences). SYTOXRed (Sigma-Aldrich) was used to exclude dead cells. Data were analyzed with FlowJo software (Tree Star), and cells were counted with a CASY cell counter (Roche).
Methylcellulose clonal assays
Two to 20 × 103 cells/mL were mixed with methylcellulose in round-bottom, 14-mL tubes. Then 1.6 or 0.9 mL media with cells and cytokines was plated in triplicate in 12- or 24-well plates, respectively. Media contained 2% carp serum, 100 ng/mL Epo and granulocyte colony stimulating factor (Gcsf), and 30 ng/mL Tpo. Cultures were grown in humidified incubators at 32°C, 5% CO2. After 4 to 8 days (depending on the experiment; see figure legends for growth duration), colonies were examined, isolated, and enumerated. CFUs and time lapse sequences were quantitated with the Operetta High-Content Imaging System (PerkinElmer) and evaluated with Harmony software (PerkinElmer). Colony pictures were acquired using an Olympus IX70 microscope and DP72 camera.
Proliferation assays
Ten colonies were isolated and pooled based on size and morphology. Colonies were disrupted with Liberase (Roche), and cells were enumerated with a hemocytometer or a CASY cell counter. The number of colony-forming cells was calculated by dividing the total number of pooled cells by the number of pooled colonies and logged (base 2) to determine the number of cell divisions that occurred.
To assess proliferation of sorted WKM, cells were labeled with PKH26 (Sigma-Aldrich) and cultured in zebrafish CFU-E medium with cytokines.5 Cell proliferation was measured by flow cytometry (LSRII, BD Biosciences) and FlowJo software proliferation tools.
Other methods
Detailed methods describing in silico data mining and cloning of full-length zebrafish Tpo, generation of recombinant cytokines, in vitro transcription, translation, and western blotting, quantitative reverse transcriptase PCR (qRT-PCR), whole mount in situ hybridization (WISH), zebrafish care and transgenics, embryo injections, culture media, and cytology are available online in supplemental Materials and methods. Zebrafish were mated, staged, and raised in accordance with IACUC guidelines.
Results
Cloning and expression of zebrafish tpo
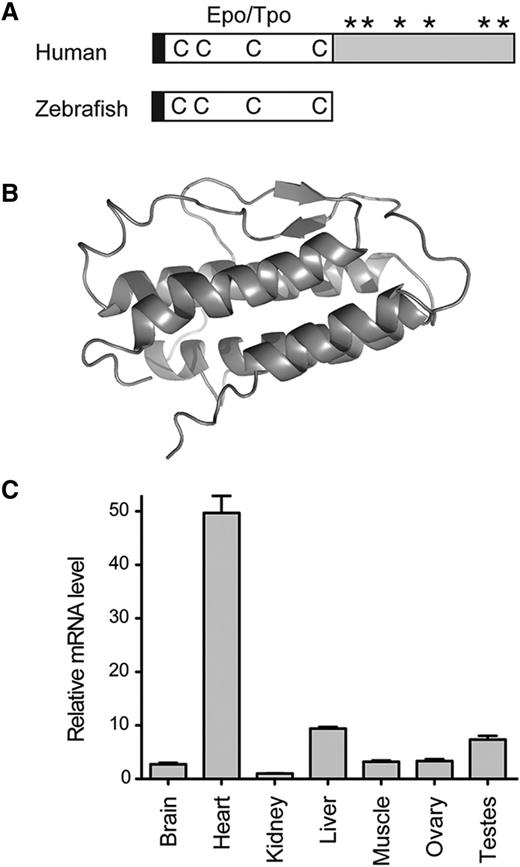
cDNA containing full-length tpo was cloned from zebrafish hearts by RT-PCR and 5′ RACE, and its sequence was deposited into GenBank (EU267076). Zebrafish Tpo contains the conserved N-terminal Epo/Tpo domain (pfam00758), whereas the mammalian C-terminal domain is lacking (Figure 1A). The mature form of zebrafish Tpo (38-191 amino acids) shares 40% sequence homology (23% identity) with human TPO as well as Tpo from other species (supplemental Figure 1A). The structural prediction30,31 revealed a classical 4-helix bundle structure (Figure 1B) similar to other class I cytokines, and zebrafish Tpo shares similar topology to human Tpo32 (supplemental Figure 1B). To assess what organs in the adult zebrafish expressed tpo, transcripts were assayed by qRT-PCR. We detected high levels of tpo in heart, liver, and testes (Figure 1C). Expression of tpo during embryogenesis was low when assessed by qRT-PCR and WISH analyses, with transcript levels continuously increasing over time (data not shown).
Structure and expression of zebrafish Tpo. (A) Protein structure diagram of human (top) and zebrafish (bottom) Tpo. Black boxes represent the leader sequence, open boxes represent the conserved Epo/Tpo domain, Cs represent conserved Cys residues, *s represent glycosylation sites, and the gray box represents the C-terminal TPO domain found only in mammals. Modified from Bartunek et al.2 (B) Overall structure and secondary-structure elements of zebrafish Tpo, protein is represented as a ribbon diagram. (C) qRT-PCR analysis of tpo levels in adult organs. Tissues are listed along x-axis. The fold change in the expression is relative to kidney marrow, defined as “1.” Bars represent the mean values of 3 biological samples, with error bars representing standard deviation.
Structure and expression of zebrafish Tpo. (A) Protein structure diagram of human (top) and zebrafish (bottom) Tpo. Black boxes represent the leader sequence, open boxes represent the conserved Epo/Tpo domain, Cs represent conserved Cys residues, *s represent glycosylation sites, and the gray box represents the C-terminal TPO domain found only in mammals. Modified from Bartunek et al.2 (B) Overall structure and secondary-structure elements of zebrafish Tpo, protein is represented as a ribbon diagram. (C) qRT-PCR analysis of tpo levels in adult organs. Tissues are listed along x-axis. The fold change in the expression is relative to kidney marrow, defined as “1.” Bars represent the mean values of 3 biological samples, with error bars representing standard deviation.
tpo expands HSPCs and thrombocytes in zebrafish embryos
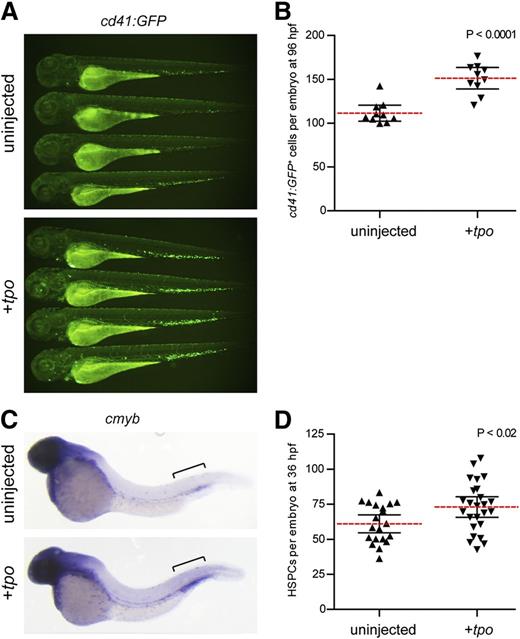
To investigate the role of Tpo in embryonic hematopoiesis, we performed gain-of-function experiments by injecting tpo mRNA into zebrafish embryos. Injection of tpo into itga2b:GFP (also referred to as cd41:GFP)33 transgenics significantly increased the number of GFP+ cells present at 72 and 96 hours postfertilization (hpf) (Figure 2A-B), which represent HSPCs and thrombocytes.34-36 Similarly, WISH analyses indicated that cmyb, a marker of embryonic HSPCs,34 was significantly increased in the caudal hematopoietic tissue (CHT) of injected embryos at 36 hpf (Figure 2C-D).
tpo expands the number of thrombocytes and HSPCs in the developing zebrafish embryo. (A) cd41:GFP+ cells in 72 hpf zebrafish embryos uninjected (top) or injected with tpo mRNA (bottom). (B) Numbers of cd41:GFP+ cells quantitated from 96 hpf embryos. Embryos were analyzed using flow cytometry, and the number of cd41:GFP+ cells was calculated based on the frequency of these cells multiplied by the total cell number per embryo. Each data point represents 5 embryos pooled together before digestion and flow cytometry. (C) cmyb+ HSPCs present in the caudal hematopoietic tissue (brackets) at 36 hpf in embryos that were uninjected (top) or injected with tpo mRNA (bottom). (D) Numbers of cmyb+ cells along the dorsal aorta and caudal hematopoietic tissue (brackets) region at 36 hpf quantitated from 2 independent experiments. Dashed red lines in B and D represent the mean with 95% confidence interval (black error bars).
tpo expands the number of thrombocytes and HSPCs in the developing zebrafish embryo. (A) cd41:GFP+ cells in 72 hpf zebrafish embryos uninjected (top) or injected with tpo mRNA (bottom). (B) Numbers of cd41:GFP+ cells quantitated from 96 hpf embryos. Embryos were analyzed using flow cytometry, and the number of cd41:GFP+ cells was calculated based on the frequency of these cells multiplied by the total cell number per embryo. Each data point represents 5 embryos pooled together before digestion and flow cytometry. (C) cmyb+ HSPCs present in the caudal hematopoietic tissue (brackets) at 36 hpf in embryos that were uninjected (top) or injected with tpo mRNA (bottom). (D) Numbers of cmyb+ cells along the dorsal aorta and caudal hematopoietic tissue (brackets) region at 36 hpf quantitated from 2 independent experiments. Dashed red lines in B and D represent the mean with 95% confidence interval (black error bars).
Tpo expands HSPCs in vitro and encourages thrombocytic differentiation
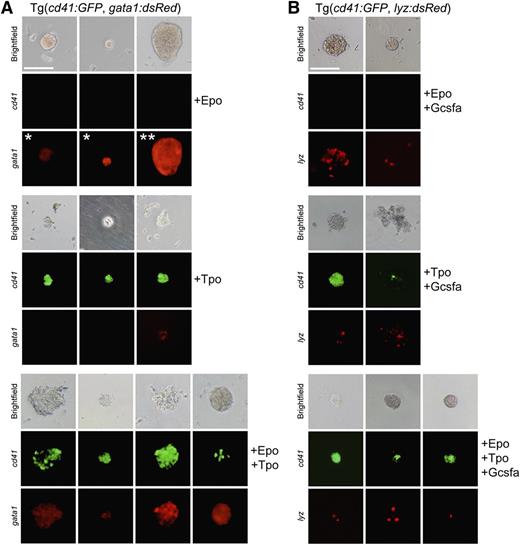
To determine if Tpo stimulated thrombocytic differentiation, we performed in vitro clonal assays6,37 with recombinant zebrafish Tpo (supplemental Figure 1). We ficoll-purified zebrafish WKM to obtain hematopoietic cells and cultivated them in methylcellulose with different recombinant cytokines to stimulate CFU activity. To determine the effect of Tpo on TEPs, WKM was harvested from double transgenic cd41:GFP; gata1:dsRed fish. These fish have the thrombocytic-specific promoter cd41 driving GFP expression and the erythroid-specific gata1 promoter driving dsRed fluorescence, allowing examination of thrombocytic/erythroid differentiation. Plating WKM cells from these fish with no growth factors resulted in limited numbers of small, cd41:GFP−gata1:dsRed− colonies (data not shown). The addition of Epo encouraged the growth and differentiation of small, hemoglobinized, erythroid gata1:dsRed+ colonies that were uniformly cd41:GFP− (Figure 3A, top), which resembled zebrafish CFU-Es.6 In addition, we also observed large (>256 cells) gata1:dsRed+ erythroid colonies (Figure 3A, top), which we refer to as BFU-Es due to their appearance and similarity to avian BFU-Es.38,39
Tpo differentiates thrombocytes and enhances the proliferation of erythro-myeloid progenitors. Methylcellulose assays using progenitor cells isolated from fractionated WKM of adult transgenic fish (as indicated) grown for 4 days in the presence of recombinant Epo, Tpo, and/or Gcsf. Brightfield (top row), cd41:GFP (middle row), and gata1:dsRed or lyz:dsRed (bottom row) images are shown to illustrate representatives colonies. (A) Epo stimulates growth and differentiation of small CFU-E (*) and large BFU-E (**) colonies that are hemoglobinized and express gata1:dsRed (top). Tpo stimulates growth and differentiation of relatively small CFU-T colonies that express high levels of cd41:GFP and low levels of gata1:dsRed (middle). Combinatorial addition of Epo and Tpo also stimulates mixed CFU-TE colonies, consisting of clusters of erythrocytes and thrombocytes that express high levels of both cd41:GFP and gata1:dsRed (bottom). (B) Epo and Gcsf encourage differentiation of hemoglobinized lyz:dsRed+ colonies (top). Tpo and Gcsf induce differentiation of nonhemoglobinized colonies that express cd41:GFP and lyz:dsRed (middle). Combinatorial addition of Epo, Tpo, and Gcsf expand hemoglobinized colonies that express both cd41:GFP and lyz:dsRed (bottom). All photomicrographs were taken at original magnification ×200. Scale bar (top left) represents 100 µm.
Tpo differentiates thrombocytes and enhances the proliferation of erythro-myeloid progenitors. Methylcellulose assays using progenitor cells isolated from fractionated WKM of adult transgenic fish (as indicated) grown for 4 days in the presence of recombinant Epo, Tpo, and/or Gcsf. Brightfield (top row), cd41:GFP (middle row), and gata1:dsRed or lyz:dsRed (bottom row) images are shown to illustrate representatives colonies. (A) Epo stimulates growth and differentiation of small CFU-E (*) and large BFU-E (**) colonies that are hemoglobinized and express gata1:dsRed (top). Tpo stimulates growth and differentiation of relatively small CFU-T colonies that express high levels of cd41:GFP and low levels of gata1:dsRed (middle). Combinatorial addition of Epo and Tpo also stimulates mixed CFU-TE colonies, consisting of clusters of erythrocytes and thrombocytes that express high levels of both cd41:GFP and gata1:dsRed (bottom). (B) Epo and Gcsf encourage differentiation of hemoglobinized lyz:dsRed+ colonies (top). Tpo and Gcsf induce differentiation of nonhemoglobinized colonies that express cd41:GFP and lyz:dsRed (middle). Combinatorial addition of Epo, Tpo, and Gcsf expand hemoglobinized colonies that express both cd41:GFP and lyz:dsRed (bottom). All photomicrographs were taken at original magnification ×200. Scale bar (top left) represents 100 µm.
In contrast, Tpo stimulated small, nonhemoglobinized colonies that were mainly comprised of cd41:GFP+ cells (Figure 3A, middle), indicating that Tpo encouraged thrombocytic differentiation, which we refer to as CFU-thrombocytes (CFU-Ts). A few of these colonies also possessed weak gata1:dsRed+ signal, in agreement with previous studies that Gata1 is involved in the differentiation of platelets from MEPs.40,41
Adding Epo or Tpo individually or combinatorially to WKM from lyz:dsRed transgenic animals did not stimulate the formation of dsRed+ myeloid colonies (supplemental Figure 2), indicating the specificity of these cytokines to the thrombocytic/erythroid lineages.
Visualization of zebrafish HSPCs
To assess if we could visualize colonies with mature thrombocytes and erythrocytes arising from multi-potent HSPCs, we added Epo and Tpo combinatorially to fractionated WKM, culturing these cells in methylcellulose. In addition to small CFU-Es, large BFU-Es, and small CFU-Ts, we observed relatively rare, large colonies that were partially hemoglobinized containing both gata1:dsRed+ and cd41:GFP+ cells (Figure 3A, bottom). We refer to these colonies as CFU-thrombocytic/erythroid colonies (CFU-TEs), derived predominantly from presumptive TEPs (supplemental Movies 1-2).
To examine hematopoietic progenitors upstream of TEPs also capable of myeloid differentiation, we isolated and plated WKM from double transgenic cd41:GFP; lyz:dsRed animals (Figure 3B). Cultivation of WKM with Epo and granulocyte colony stimulating factor (Gcsfa)6 encouraged the differentiation of hemoglobinized lyz:dsRed+ colonies comprised of erythroid and myeloid cells (macrophages and neutrophils; supplemental Figure 7). Adding Tpo and Gcsfa to WKM encouraged the formation of nonhemoglobinized lyz:dsRed+; cd41:GFP+ mixed myeloid and thrombocytic colonies. Importantly, the combinatorial addition of Epo, Tpo, and Gcsfa allowed the observation of extremely rare hemoglobinized colonies with cd41:GFP+ thrombocytes and lyz:dsRed+ myeloid cells, which we refer to as CFU-granulocyte, erythroid, macrophage, thrombocyte (supplemental Figure 8C) colonies that likely derive from progenitors upstream of TEPs, as they have the ability to also generate myeloid cells when stimulated with Gcsfa. The incidence rate of these colonies was rare; on average only ∼40 GEMT colonies were generated for every 100 000 fractionated WKM cells plated (supplemental Figure 8A; Table 1). Importantly, we were still able to observe CFU-TEs within these multipotent conditions (supplemental Figure 8C), suggesting the ability to putatively isolate TEPs from upstream progenitors.
Percentage of different CFU types generated by HSPCs grown in Epo, Tpo, and Gcsfa
| Colony type . | Incidence of CFUs formed when plating cell fractions below in Epo, Tpo, and Gcsfa, % . | |
|---|---|---|
| Fractionated WKM . | Cd41:GFPmedium L+P cells . | |
| BFU-E | 0.19 | 1.71 |
| CFU-E | 1.15 | 12.22 |
| CFU-T | 0.08 | 0.75 |
| CFU-TE | 0.006 | 0.13 |
| CFU-GM | 6.47 | 6.75 |
| CFU-GMT | 0.04 | 0.28 |
| CFU-GEMT | 0.004 | 0.08 |
Summary of CFU incidence when 100 000 cells (fractionated WKM or cd41:GFPmedium L+P cells) were plated in the presence of Epo, Tpo, and Gcsfa. These data are a summary of supplemental Figure 8. CFU-GEMT, CFU-granulocyte, erythroid, macrophage, thrombocyte.
Detailed examination of thrombocytic and erythroid differentiation
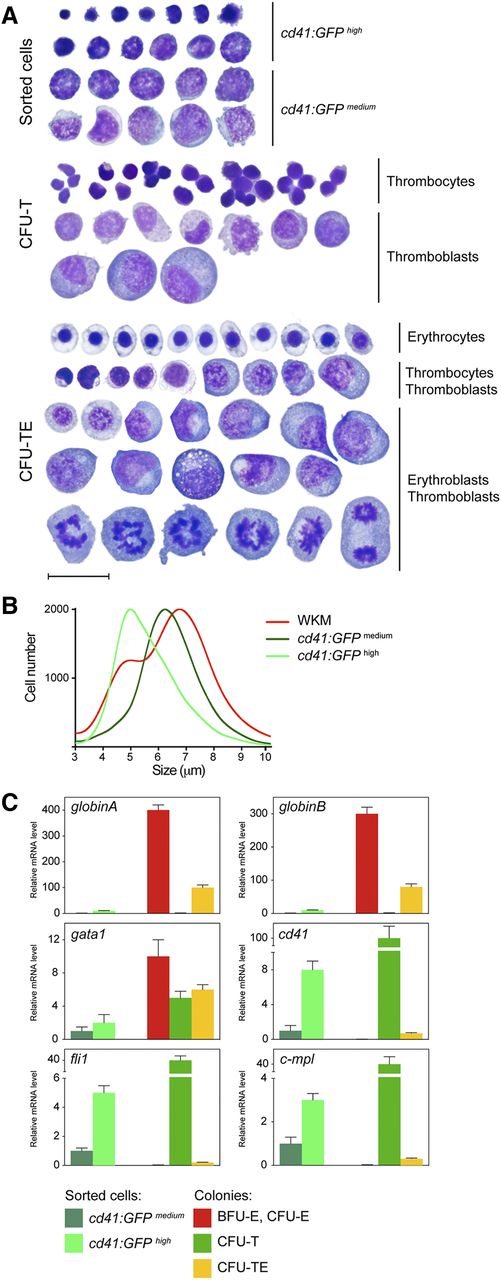
To determine the cellular constituents of these cultured colonies, we isolated them to assess their cellular constituents (Figure 4A). As a control, we compared colony smears to FACS-isolated cd41:GFP+ WKM cells. Morphological examination revealed that cd41:GFPhigh cells were small nucleated cells with dense cytoplasm, in agreement with previous descriptions of zebrafish thrombocytes.42 cd41:GFPmedium cells, likely thrombocytic/erythroid precursors, were larger and had lacy nuclear chromatin. As expected, CFU-T colonies generated by the addition of Tpo were comprised of morphologically similar cells to those marked by cd41:GFP expression; colonies contained small, dense thrombocytes and larger precursors that were likely thromboblasts (Figure 4A, middle). To examine mixed colonies obtained from combinatorial addition of Epo and Tpo, we isolated CFU-TEs and observed thrombocytes and mature, nucleated erythroid cells with eosinophilic cytoplasm and ovoid nuclei. Additionally, large immature precursor cells, likely TEPs, and downstream immature erythroid and thrombocytic progenitors were present (Figure 4A, bottom).
Morphology and gene expression analysis of isolated colonies. (A) Smeared sorted cells or colonies isolated from methylcellulose cultures after 6 days in culture were stained with May-Grünwald Giemsa. cd41:GFPhigh and cd41:GFPmedium cells isolated from adult zebrafish WKM (top). Smeared CFU-T colonies isolated from cells cultured in Tpo (middle). CFU-TEs, isolated from cultures grown in the presence of both Epo and Tpo (bottom). Photomicrographs were taken at original magnification ×1000. Scale bar represents 20 µm. (B) CASY profile of sorted cd41:GFPmedium (dark green), cd41:GFPhigh (light green), and WKM (red) cells. Peaks represent the average size distribution of cells in µm. (C) qRT-PCR analysis of sorted cd41:GFP cells and colonies grown for 6 days using their appearance in combination with lineage specific genes. The cd41:GFPmedium population was used as the reference standard (fold 1), and bars represent mean values of 3 samples, with error bars representing SD.
Morphology and gene expression analysis of isolated colonies. (A) Smeared sorted cells or colonies isolated from methylcellulose cultures after 6 days in culture were stained with May-Grünwald Giemsa. cd41:GFPhigh and cd41:GFPmedium cells isolated from adult zebrafish WKM (top). Smeared CFU-T colonies isolated from cells cultured in Tpo (middle). CFU-TEs, isolated from cultures grown in the presence of both Epo and Tpo (bottom). Photomicrographs were taken at original magnification ×1000. Scale bar represents 20 µm. (B) CASY profile of sorted cd41:GFPmedium (dark green), cd41:GFPhigh (light green), and WKM (red) cells. Peaks represent the average size distribution of cells in µm. (C) qRT-PCR analysis of sorted cd41:GFP cells and colonies grown for 6 days using their appearance in combination with lineage specific genes. The cd41:GFPmedium population was used as the reference standard (fold 1), and bars represent mean values of 3 samples, with error bars representing SD.
To examine the size of zebrafish thrombocytes and their precursors, we compared the sizes of unfractionated WKM cells to FACS-sorted cd41:GFPmedium and cd41:GFPhigh cells with CASY technology (Figure 4B). The profile of unfractionated WKM cells displayed 2 distinct peaks, where erythrocytes and other cell types were measured as 5 and 7 µm, respectively. The profile of cd41:GFPmedium and cd41:GFPhigh populations displayed only one peak each, with a size of either 5 or 6 µm in thrombocytes and progenitors, respectively.
To examine the gene expression of cultured colonies (Figure 3), we compared their transcript expression to FACS-isolated cd41:GFP+ cells (Figure 4C). BFU-E and CFU-E colonies cultured in Epo predominantly expressed the erythroid markers gata1, globinA, and globinB. In contrast, CFU-Ts cultured in Tpo showed little expression of mature myeloid and erythroid genes but showed increased levels of the thrombocytic integrin cd41 and the Tpo receptor cmpl (Figure 4C; supplemental Figure 8B). CFU-Ts also expressed intermediate levels of gata1, likely due to this transcription factor’s shared role in thrombocytic and erythroid differentiation. fli1 was also expressed, likely due to its important role during thrombopoiesis. Furthermore, the analysis of CFU-TEs cultured in Epo and Tpo indicated the presence of erythroid and thrombocytic transcripts, confirming the presence of erythroid and thrombocytic cells within these colonies.
Enrichment and characterization of TEPs from WKM
Having confirmed the presence of multi-potent cells that generated erythroid, thrombocytic, and myeloid cells, we attempted to enrich the population of these HSPCs within adult WKM. HSPCs reside within 2 populations resolved by light scatter characteristics within WKM. Whereas HSCs reside within the “lymphoid” fraction,43 various downstream progenitors reside within the “precursor” fraction.5,6,37 Additionally, studies indicate that the CD41 antigen is strongly expressed on thrombocytes/platelets44,45 as well as HSPCs at lower levels, although its functional role in HSPC biology is unclear.2,34-36 For these reasons, we hypothesized that TEPs might be marked by cd41:GFP in adult WKM. To test this hypothesis, we FACS-isolated WKM cells from double transgenic cd41:GFP+; gata1:dsRed+ fish based on their light scatter characteristics and cd41:GFP expression. We were able to distinguish at least 3 cd41+ populations within the lymphoid and precursor (L+P) scatter fractions that were cd41:GFPlow, cd41:GFPmedium, and cd41:GFPhigh (supplemental Figure 3). To characterize these populations, we sorted each and performed clonal assays (Figure 5; supplemental Figures 4-5). First, we sorted the cd41:GFPlow, cd41:GFPmedium, and cd41:GFPhigh cells within the combined L+P scatter fractions (supplemental Figure 3). We also sorted cd41:GFPlow lymphoid cells and cd41:GFPlow precursor cells (supplemental Figure 3). Additionally, we isolated double-positive L+P cd41:GFPlow & medium; gata1:dsRed+ cells, which did not enrich for any progenitors when compared with cd41:GFPlow & medium cells (data not shown).
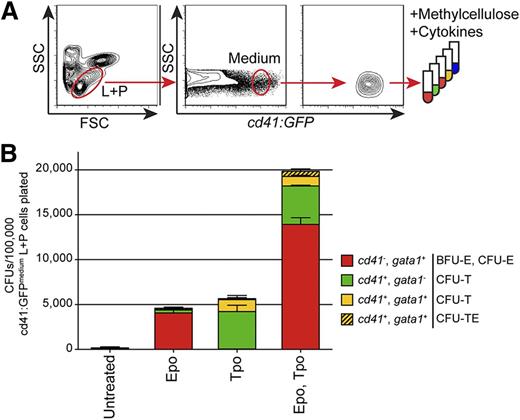
TEPs are enriched within the cd41:GFPmedium combined lymphoid and precursor (L+P) scatter population within the WKM. (A) Experimental schematic for the isolation and cultivation of cd41:GFPmedium cells from the combined L+P scatter fractions of adult WKM. (B) CFUs per 100 000 cd41:GFPmedium cells plated in methylcellulose only (unstimulated) or methylcellulose plus recombinant Epo, Tpo, or Epo and Tpo grown for 4 days. Red bars represent BFU-E and CFU-E gata1:dsRed+ colonies, green bars represent CFU-T cd41:GFP+ colonies, yellow bars represent small, mixed CFU-T cd41:GFP+; gata1:dsRed+ colonies, and hatched yellow bars represent large mixed CFU-TE cd41:GFP+; gata1:dsRed+ colonies. Bars represent an average of at least 3 samples, with error bars representing SD. Please see supplemental Figures 3-5 and 8 for additional data pertaining to these culture experiments.
TEPs are enriched within the cd41:GFPmedium combined lymphoid and precursor (L+P) scatter population within the WKM. (A) Experimental schematic for the isolation and cultivation of cd41:GFPmedium cells from the combined L+P scatter fractions of adult WKM. (B) CFUs per 100 000 cd41:GFPmedium cells plated in methylcellulose only (unstimulated) or methylcellulose plus recombinant Epo, Tpo, or Epo and Tpo grown for 4 days. Red bars represent BFU-E and CFU-E gata1:dsRed+ colonies, green bars represent CFU-T cd41:GFP+ colonies, yellow bars represent small, mixed CFU-T cd41:GFP+; gata1:dsRed+ colonies, and hatched yellow bars represent large mixed CFU-TE cd41:GFP+; gata1:dsRed+ colonies. Bars represent an average of at least 3 samples, with error bars representing SD. Please see supplemental Figures 3-5 and 8 for additional data pertaining to these culture experiments.
In summary, we observed 3- to 6-fold enrichment of erythroid progenitors in the cd41:GFPlow and cd41:GFPmedium L+P cells compared with fractionated WKM cultured in Epo (Figure 5B; supplemental Figure 4A). This enrichment was even more pronounced when the cells were cultured in Epo and Tpo (Figure 5B; supplemental Figure 4A).
Importantly, we observed enrichment of thrombocytic progenitor cells in all cd41:GFP+ fractions. Thrombocytic progenitors were mainly present in the cd41:GFPmedium combined L+P populations, as indicated by 50-fold enrichment of cd41:GFP+; gata1:dsRed− CFU-T colonies compared with fractionated WKM (Figure 5B; supplemental Figure 4B). Additionally, cd41:GFP+; gata1:dsRed+ double-positive small CFU-T and large CFU-TE colonies were enriched over 30-fold in combined L+P cd41:GFPmedium L+P cells compared with fractionated WKM when grown with Epo and Tpo (Figure 5B; supplemental Figure 4C). In addition to thrombocytic progenitors, the combined cd41:GFPlow L+P cells also generated myeloid colonies, indicating that there are likely upstream multi-potent progenitors present in this population (supplemental Figure 5). In contrast to the cd41:GFPlow/medium cells, culturing cd41:GFPhigh cells generated few CFUs, likely because these cells are mature, postmitotic thrombocytes (supplemental Figure 4).
In summary, cd41:GFPlow cells in the combined L+P populations are mainly erythro-myeloid progenitors (supplemental Figure 4), although they also have thrombocytic (supplemental Figure 4) and myeloid differentiation capability when grown in the presence of Gcsfa (supplemental Figure 5). Additionally, cd41:GFPmedium L+P cells generate more CFU-TE and CFU-T colonies than other cell fractions investigated (supplemental Figure 4), even though they also generate CFU-E and BFU-E colonies (supplemental Figure 4) and small numbers of myeloid colonies when cultured in the presence of Gcsfa (supplemental Figure 6). The total numbers of cells within individual populations are shown in supplemental Figure 6.
Characterization of HSPC proliferation
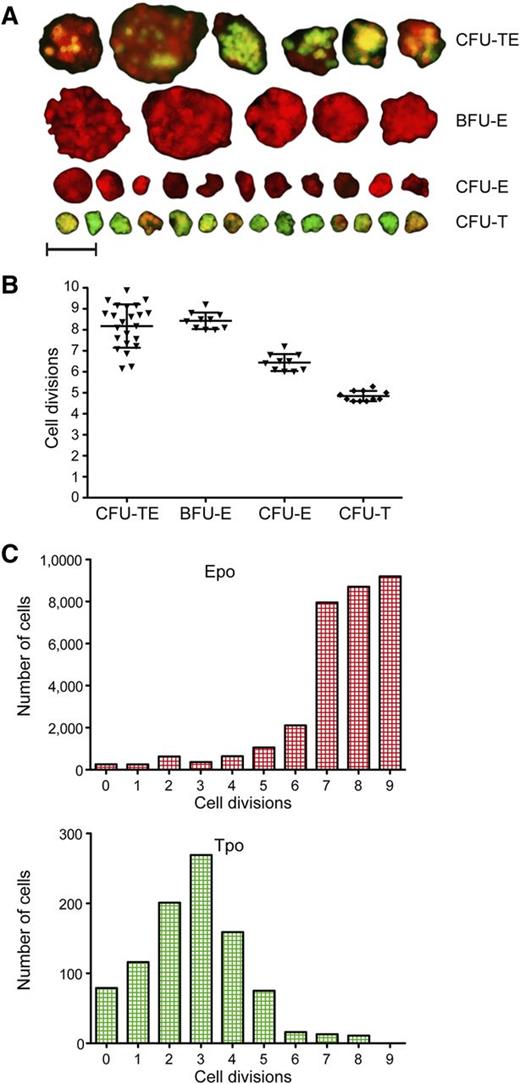
The growth and kinetics of HSPCs have been well studied in mammals.9,10,12,15,16 However, very little is known about the proliferative capacity of nonmammalian HSPCs. To study the proliferative capacity of zebrafish thrombocytic progenitors, we first determined how many cells comprised CFU-T colonies (Figure 6A). We enumerated an average of 32 individual cells, indicating that the proliferative capacity of the colony initiating progenitors was ∼5 cell divisions (Figure 6B). Using the same approach, we examined small CFU-Es and large BFU-Es (Figure 6A-B). We determined that zebrafish BFU-E colonies were generated by 8 to 9 cell divisions, and CFU-Es were generated from up to 6 cell divisions, similar to mammalian erythroid progenitors.9,10,12 Finally, we analyzed the proliferation capacity of CFU-TEs, which was in the range of 6 to 10 cell divisions. The size and proliferation capacity of these colonies is more variable and dependent on the cellular composition of the mixed colonies, likely due to the asymmetric proliferation capacity between the thrombocytic and erythroid lineages.
Proliferative capacity of CFU-TEs, BFU-Es, CFU-Es, and CFU-Ts. (A) Fluorescent photomicrographs of colonies grown in methylcellulose for 4 days and their categorization according to their proliferation capacity (size) and expression of cd41:GFP and gata1:dsRed. Photomicrographs were taken at original magnification ×200; scale bar represents 50 µm. (B) Proliferation capacity of BFU-Es, CFU-Es, and CFU-Ts assessed by cell counts of isolated colonies. (C) Proliferation capacity of WKM cells, grown in suspension with combination of recombinant Epo or Tpo protein added assessed by the division-mediated dilution of membrane dye PKH26.
Proliferative capacity of CFU-TEs, BFU-Es, CFU-Es, and CFU-Ts. (A) Fluorescent photomicrographs of colonies grown in methylcellulose for 4 days and their categorization according to their proliferation capacity (size) and expression of cd41:GFP and gata1:dsRed. Photomicrographs were taken at original magnification ×200; scale bar represents 50 µm. (B) Proliferation capacity of BFU-Es, CFU-Es, and CFU-Ts assessed by cell counts of isolated colonies. (C) Proliferation capacity of WKM cells, grown in suspension with combination of recombinant Epo or Tpo protein added assessed by the division-mediated dilution of membrane dye PKH26.
As manually counting the cellular constituents of disaggregated colonies likely underestimated the number of actively dividing cells in the culture, the proliferative capacity of erythroid and thrombocytic cells was also measured with the membrane dye PKH26. We analyzed WKM cells grown in liquid culture5,46 with Epo or Tpo added and monitored division-mediated dye dilution during erythroid and thrombocytic differentiation (Figure 6B). Proliferative capacity indexes obtained were in agreement with results obtained using clonal assays. Taken together, these data indicated that our in vitro assays afford the ability to precisely determine the differentiation and proliferative capacity of CFU-TEs, BFU-Es, CFU-Es, and CFU-Ts.
Model of TEP proliferation and differentiation
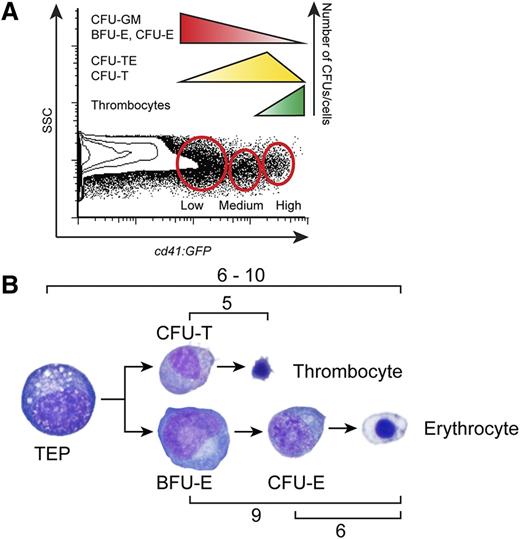
Utilizing our sensitive in vitro clonal techniques, we prospectively isolated thrombocytic and erythropoietic progenitor cells based on cd41:GFP expression in the combined L+P scatter fractions. cd41:GFPlow cells formed CFU-GM, BFU-E, and CFU-E colonies (supplemental Figures 4, 5, and 8), while increasing levels of cd41:GFP marked progenitors already committed down the thrombocytic pathway, indicated by their increasing ability to generate CFU-TEs and CFU-Ts (supplemental Figures 4 and 8). High levels of cd41:GFP marked mature postmitotic thrombocytes, which generated very few colonies (supplemental Figures 4 and 8). These data are summarized in Figure 7A.
Levels of cd41:GFP mark differential populations of progenitor cells with varied proliferative capacity. (A) Schematic representation of CFU frequencies within the cd41:GFP+ combined L+P scatter fractions. (B) Schematic representation of the proliferation capacity of erythroid (BFU-E, CFU-E) and thrombocytic (CFU-T) progenitors assessed by counting of colony forming cells.
Levels of cd41:GFP mark differential populations of progenitor cells with varied proliferative capacity. (A) Schematic representation of CFU frequencies within the cd41:GFP+ combined L+P scatter fractions. (B) Schematic representation of the proliferation capacity of erythroid (BFU-E, CFU-E) and thrombocytic (CFU-T) progenitors assessed by counting of colony forming cells.
Furthermore, our analysis of these colonies yielded important information about the amount of cell divisions of TEPs (Figure 7B). Combining our assays measuring the size and proliferative capacity of erythroid, thrombocytic, and mixed colonies indicated that TEPs divided 6 to 10 times, generating downstream CFU-Ts that proliferated 5 times on average and BFU-Es that proliferated up to 9 times. CFU-Es had a more limited proliferative capacity, only dividing an average of 6 times before they generated mature RBCs.
Discussion
Zebrafish represent a unique model system for understanding the evolutionarily conserved molecular mechanisms involved during hematopoiesis, especially in the production of mature erythroid and thrombocytic cells.
It is important to note that during the hundreds of million years of evolution that separate teleosts and mammals, certain aspects of erythroid and thrombocytic differentiation have changed; adult mammalian RBCs have the unique feature of being enucleated, and mammalian thrombocytes are not individual cells but fragments of megakaryocytes. These adaptations in mammals have likely evolved, because they enhance the biological performance of these cells; enucleated erythrocytes are more flexible and have more surface area for efficient hemoglobin access, while megakaryocytes allow the generation of thousands of platelets per precursor. However, even though evolutionary enhancements to these processes have occurred, erythroid and thrombocytic differentiation likely derived from conserved biological processes related in all vertebrates.
As zebrafish have become an increasingly popular model of hematopoiesis, we developed in vitro assays to identify and assess the complete cellular components of the hematopoietic system as well as their proliferation, lineage decisions, and function.5,6,37 These assays are essential to investigate the evolutionary relationships between teleosts and mammals. A more thorough understanding of the similarities and differences in vertebrate hematopoiesis could be manipulated to expand HSPCs in vitro, modulate lineage decisions, and develop targeted treatments for human hematopoietic diseases.
In this study, we focused on the link between zebrafish and mammalian erythroid and thrombopoietic development. To perform these studies, we first identified zebrafish Tpo. Even though multiple copies of class I cytokines have been identified in teleosts,37,47,48 our extensive genomic searches did not identify an additional Tpo paralogue. Similar to other nonmammalian vertebrates,2 zebrafish Tpo contains only an Epo/Tpo domain and lacks the entire C-terminal portion of the mammalian cytokine. We and others have hypothesized that this highly glycosylated C-terminal domain is not essential for the biological activity of Tpo, but only for its half-life.2,21,22 Although TPO has been described in mammals as an important regulator of megakaryopoiesis13 and HSC homeostasis,24-26 there is only limited knowledge of its role in these processes in nonmammalian vertebrates.2,49
In this study, we determined that exogenous Tpo expanded cd41:GFP+ thrombocytes as well as cd41:GFP+ and cmyb+ HSPCs, indicating that teleostean Tpo is an important cytokine involved in the homeostasis of HSCs and HSPCs. Although previous studies indicated the essential role of Tpo signaling in the development of zebrafish thrombocytes,33 these data are the first experimental evidence that Tpo also plays an in vivo role in the homeostasis of early hematopoietic progenitors, as it does in mammalian vertebrates.
To further examine the role of Tpo in zebrafish hematopoiesis, we used clonal in vitro assays. We generated recombinant zebrafish Tpo, which efficiently generated CFU-T colonies from WKM HSPCs. Because mammalian megakaryocytes and erythroid cells are generated from bi-potential MEPs,1 we asked if similar progenitor cells existed in zebrafish. To identify TEPs, we cultured putative HSPCs in the presence of Epo and Tpo. Indeed, under these conditions, we observed the generation of mixed CFU-TE colonies that consisted of erythrocytes and thrombocytes based on cellular morphology, hemoglobinization, and fluorescent readouts. The combinatorial addition of Gscfa to these cultures enabled us to also visualize colonies derived from progenitors upstream of TEPs, such as CMPs, MPPs, or HSCs. The presence of all 3 cytokines in our cultures generated hemoglobinized cd41:GFP+, lyz:dsRed− CFU-TE colonies and also CFU-granulocyte, erythroid, macrophage, thrombocyte colonies that were hemoglobinized and cd41:GFP+, lyz:dsRed+. Importantly, these studies are the first to show the existence of prospectively isolatable TEPs in teleosts.
In addition, we found that Tpo synergistically enhanced erythroid colony formation when added combinatorially with Epo. When added with Gcsfa, we also observed an expansion of lyz:dsRed+ myeloid colonies. Tpo’s role in supporting erythro-myeloid differentiation is likely based on the indirect induction of self-renewal and proliferation of multi-potent progenitors.27,28
When culturing progenitors in methylcellulose with Epo, we noticed the generation of 2 distinct types of erythroid colonies: small CFU-Es6 and larger, hemoglobinized cd41:GFP−, gata1:dsRed+ colonies. These larger colonies, which we named BFU-Es due to their resemblance to avian BFU-Es,38,39 likely originate from upstream progenitor cells with much higher proliferative capacity. However, we did not observe the “bursts” of proliferation typical of mammalian BFU-Es, probably due to a lack of additional cytokines such as SCF. Therefore, our nomenclature is based solely on the differential proliferation capacity of these erythroid progenitors.
To further study putative HSPCs, we isolated WKM progenitors based on different light scatter characteristics coupled with lineage-specific transgene expression for enrichment. Although CD41 is present on the surface of mature platelets, it is also expressed in low levels on the surface of multi-potent HSPCs and bi-potent TEPs.2,34-36 Therefore, we hypothesized that we could enrich TEPs, CFU-Ts, BFU-Es, and CFU-E colonies by sorting based on cd41:GFP levels in combination with light scatter characteristics. This combined L+P fraction of WKM cells contained 3 cd41+ populations: cd41low, cd41medium, and cd41high. Our in vitro assays showed that cd41low progenitors predominantly formed CFU-GM, BFU-E, and CFU-E colonies. Interestingly, we found that cd41medium cells predominantly contained CFU-TE and CFU-T progenitors, suggesting that cells committed to the thrombocytic pathway express increasing amounts of CD41. In agreement with this finding, cd41high cells were mainly postmitotic thrombocytes that had limited proliferative potential.
Erythroid enucleation and megakaryocytic endoreduplication represent key evolutionary developments of mammalian erythroid and thrombocytic development. Although the evolutionary connection between nonmammalian and mammalian RBCs is clear, the appearance of megakaryocytes during vertebrate evolution is less so. Mammalian megakaryocytes could have evolved de novo, functioning as analogs to thrombocytes. Conversely, they may have evolved as an evolutionary improvement from an ancestral thrombocytic precursor, indicating that thrombocytes and megakaryocytes are homologs. We hypothesized that carefully dissecting the kinetics of thrombocyte development in teleosts would further aid in deciphering the commonalities and differences between thrombopoiesis in nonmammalian and mammalian species. In support of the hypothesis that megakaryocytes and thrombocytes are homologs, we found that the number of cell divisions during teleostean thrombocytic differentiation matched the number of endoreduplication events during mammalian megakaryopoiesis. We also observed that the number of cell divisions that occurred during terminal erythroid differentiation is conserved between mammals and teleosts. These data fit well with our integrated model of vertebrate hematopoiesis; despite evolutionary improvements employed by mammals to increase the biological functions and numbers of erythroid and thrombocytic cells, there is a clear link between the number of cell divisions and likely the molecular control of bi-potent erythro/thrombocytic progenitors in species separated by millions of years of vertebrate evolution.
In conclusion, we show that zebrafish Tpo acts similarly to mammalian TPO. This functional characterization of Tpo in teleosts allowed us to identify HSPCs in the WKM that can be enriched by cd41:GFP expression and light scatter characteristics. Importantly, we provide for the first time direct evidence for the existence of TEPs in nonmammalian vertebrates. Furthermore, we determined the number of cell divisions during the differentiation of bipotent TEPs in zebrafish, which directly corresponds to the biology of their mammalian counterparts.
Taken together, despite striking phenotypic differences between fish and mammalian thrombocytic differentiation, there appears to be evolutionary conservation of the basic processes and molecular mechanisms underlying the differentiation of these cells throughout vertebrate phylogeny. Our findings strongly suggest that mammalian megakaryocytes are homologs of nonmammalian thrombocytes and evolved from them during the course of vertebrate evolution.
The online version of this article contains a data supplement.
The publication costs of this article were defrayed in part by page charge payment. Therefore, and solely to indicate this fact, this article is hereby marked “advertisement” in accordance with 18 USC section 1734.
Acknowledgments
The authors thank Roger Rainville and Lisa Phelps for animal care and Karen Ong for laboratory management.
Supported by National Institutes of Health, National Institute of Diabetes and Digestive and Kidney Diseases K01-DK087814-01A1 (D.L.S.) and R01-DK074482 (D.T.), Grand Agency of the Charles University 151-43-253108 (O.S.), Genetic Alliance Resource Partnership 305/10/0953 projects, and Fulbright Scholars award (P.B.).
Authorship
Contribution: O.S., D.L.S., O.M., P.P., J.B., and P.B. performed research; O.S. and P.B. designed the research; O.S., D.L.S., and P.B. wrote the manuscript; and L.I.Z. and D.T. provided critical reagents for the work, as well as suggestions on experimental design.
Conflict-of-interest disclosure: L.I.Z. is a founder and stockholder of Fate, Inc., a founder and stockholder of Scholar Rock, and a scientific advisor for Stemgent. The remaining authors declare no competing financial interests.
Correspondence: Petr Bartůněk, Department of Cell Differentiation, Institute of Molecular Genetics AS CR v.v.i., 142 20 Prague 4, Czech Republic; e-mail: bartunek@img.cas.cz.
References
Author notes
O.S. and D.L.S. contributed equally to the study.

This feature is available to Subscribers Only
Sign In or Create an Account Close Modal