Abstract
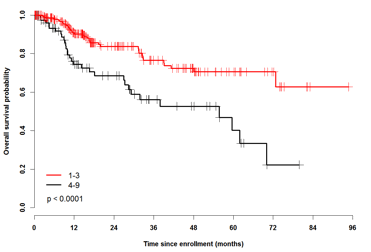
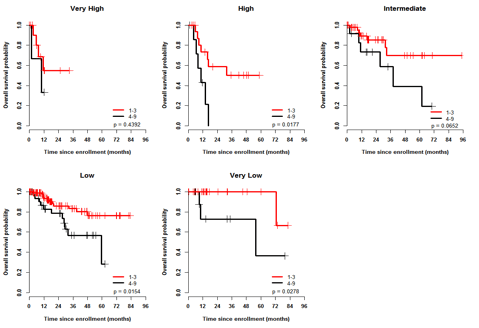
Introduction: MDS is a disease of the elderly; yet, the impact of clinical frailty (an age-related vulnerability state created by a multidimensional loss of reserves) and patient-reported outcomes on overall survival (OS) are unknown. Rockwood et al. have developed a simple 9-point clinical frailty scale (CFS) that correlated highly with the risk of death, institutionalization, worsening health and hospital use (Rockwood K., CMAJ 2005). In a prospective, national MDS registry, participants have undergone annual evaluations with the following: (a) 3 geriatric physical performance tests, (b) Charlson (CCI) and Della Porta comorbidity index (DP-CCI) scores, (c) graded frailty using the Rockwood CFS, (d) disability assessments with the Lawton Brody SIADL, and (e) QOL using the EORTC QLQ C-30 and the EQ-5D. The results of these frailty assessments and the effects of these patient-related factors and reported outcomes on OS, in addition to the IPSS/revised IPSS, will be presented. Methods: Overall survival was measured from time to enrollment. Results from physical performance tests were divided into quintiles with higher scores indicating better performance. We used univariate and multivariable Cox proportional hazard model to determine significant predictive factors of overall survival (OS). The variables considered included age, IPSS, R-IPSS, ferritin, LDH, transfusion dependence, hemoglobin (hgb), ECOG, frailty, CCI and DP-CCI, grip strength, 4 M walk test, stand-sit test, modified short physical performance battery (SPPB), Lawton Brody SIADL, time from diagnosis and selected QOL domains including the EQ-5D summary score, EORTC physical functioning, dyspnea and fatigue scores. Results: 453 MDS patients (pts) have been consented and enrolled locally since January 2008 (n=231) and nationally since January 2012 (n=222). Median time from diagnosis was 5.8 mos (IQR 1.4-21). Median age was 73 y (range, 26-95 y), 65% were male and the R-IPSS scores were very low (14%), low (46%), intermediate (24%), high (10%) and very high (6%). Thirty-three % of pts were transfusion dependent at enrollment. Median CCI and DP-CCI scores were 1 (0-12) and 0 (0-6) respectively with 18% and 24% falling into the highest category scores. Median frailty scale score (n=346) was 3 (1-9) with 25% having scores indicating moderate (4-5) or severe (6-9) frailty. The CCI and DP-CCI strongly correlated (r=0.6; p< .0001) with each other, while frailty significantly but modestly correlated with them (r=0.3-0.35, p<.0001). With a median follow up (from enrollment) of 15 mos (95% CI: 13-16), 159 (35%) pts have died and 28 pts lost to follow up. Actuarial survival was 41.0 mos (range, 33.6 - 48.5 mos). When considering patient related factors - age, frailty, comorbidity (both indices), sex, ECOG, the 10 x stand sit test, the SPPB, Lawton Brody SIADL, and all QOL domains considered above were significantly predictive of OS. The multivariable model with the highest R2 included R-IPSS (p=.0004), frailty (1-3 vs 4-9, p= .004), CCI (0-1 vs >2, p=.03) and EORTC fatigue (p=.01) as summarized in Table 1 below. A frailty score > 3 predicted for worse survival (figure 1: 2 year OS 68.5% vs. 83.8%) and further refined survival within the R-IPSS categories (Figure 2). Frailty was also the single most predictive factor for OS from the start of azacitidine therapy (not shown). Conclusions: Patient-related factors such as frailty and comorbidity (that evaluate physiologic reserve and global fitness) should be considered in addition to traditional MDS prognostic indices.
| . | Independent Covariate . | . | . | . | . | ||
|---|---|---|---|---|---|---|---|
| Predictive factors at baseline . | Coefficient . | SE . | p-value . | HR . | 95% CI of HR . | R2 (%) . | |
| Time from diagnosis (months) * | 0.0335 | 0.1076 | 0.7557 | 1.034 | 0.837 | 1.277 | 17.29% |
| R-IPSS (5 categories) | <.0001 | ||||||
| Very high vs. very low | 2.5701 | 0.7289 | 0.0004 | 13.066 | 3.131 | 54.524 | |
| High vs. very low | 2.1156 | 0.6437 | 0.0010 | 8.294 | 2.349 | 29.285 | |
| Intermediate vs. very low | 1.0466 | 0.6430 | 0.1036 | 2.848 | 0.808 | 10.043 | |
| Low vs. very low | 0.6346 | 0.6181 | 0.3045 | 1.886 | 0.562 | 6.334 | |
| Frailty (1-3 vs. 4-9) | -0.8323 | 0.2905 | 0.0042 | 0.435 | 0.246 | 0.769 | |
| Comorbidity Charlson (0-1 vs. ³2) | -0.5915 | 0.2749 | 0.0314 | 0.553 | 0.323 | 0.949 | |
| EORTC fatigue * | 0.3671 | 0.1546 | 0.0176 | 1.443 | 1.066 | 1.954 | |
natural log-transformation was applied for normalizing distribution
Buckstein:Celgene Canada: Research Funding. Wells:Celgene: Honoraria, Other, Research Funding; Novartis: Honoraria, Research Funding; Alexion: Honoraria, Research Funding. Leitch:Alexion: Honoraria, Research Funding; Novartis: Honoraria, Research Funding, Speakers Bureau; Celgene: Educational Grant Other, Honoraria, Research Funding. Shamy:Celgene: Honoraria, Other.
Author notes
Asterisk with author names denotes non-ASH members.


This feature is available to Subscribers Only
Sign In or Create an Account Close Modal