Abstract
Background: The myelodysplastic syndromes (MDS) are a heterogeneous group of malignancies characterized by multiple genomic abnormalities. Precise characterization of MDS molecular abnormalities in individual patients and treatment with drugs that target the specific constellation of molecular abnormalities may provide a practical approach in this complex disease.
Methods: Therefore, bone marrow cells from 90 MDS patients were molecularly profiled by testing for mutations in the following 14 MDS-specific genes: ASXL1, ETV6, EZH2, IDH1, IDH2, NRAS, CBL, RUNX1, SF3B1, SRSF2, TET2, TP53, U2AF1 and ZRSR2. We used these profiles in a novel predictive simulation software program to create MDS patient avatars. The avatar technology has three layers: the first layer is a proprietary mathematics solver engine architected to handle millions of differential equations representing biological cross-talk reactions needed for modeling MDS physiology; the middle layer is the comprehensive functional proteomics representation of disease physiology network; and the topmost layer is a semiconductor engineering-based automaton engine which allows high-throughput simulation of multi-million interventions through assembly code language. Bone marrow conventional cytogenetics, FISH and molecular profiling data from 90 patients were used in the simulation. A library of over 80 FDA-approved agents was simulated against the predicted dysregulated pathways. A list of predicted drugs where then prospectively validated using in vitro culture of MDS-L cells.
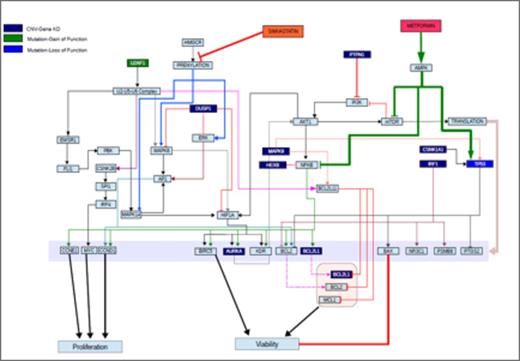
Results: Of the 90 MDS patients, the IPSS-R distribution was 25% Very Low, 58% Low, 9% Intermediate, 7% High, and 1% Very High. Median BM blast was 2% (range 0-16%). All 90 patients had detectable genomic abnormalities. 86/90 (96%) of patients had detectable genetic mutations. The 4 patients with undetectable genetic mutations all had structural chromosome abnormalities (e.g., del(11q), +8, del(20q)). Among the 90 patients, recurrent constellations of genomic mutations were identified, which permitted clustering into 63 unique MDS genomic profiles. Using these unique MDS genomic profiles, simulation avatars of dysregulated pathways were created for each MDS patient (Figure 1 as example). Next, we used the MDS avatars to simulate FDA-approved drugs individually and in combinations to predict impact on these dysregulated pathways. Iterative simulations identified 12 new drug regimens depending on the MDS patient's constellation of genomic abnormalities: (1) nelfinavir, (2) bortezomib, (3) metformin + simvastatin, (4) metformin + seliciclib, (5) nelfinavir + bortezomib, (6) nelfinavir + ruxolitinib, (7) nelfinavir + simvastatin, (8) nelfinavir + sorafenib, (9) nelfinavir + trametinib, (10) ponatinib + bortezomib, (11) nelfinavir + ponatinib, and (12) trametinib + simvastatin. In vitro validation experiments of drug regimens with MDS-L cells showed significant, dose-dependent reductions of MDS-L cell viability.
Conclusions: This study shows how molecular profiling using 14 genes and a novel simulation method can be used to map dysregulated pathways and predict potentially therapeutic agents for patients with MDS. Results from this study serve as the basis for an MDS clinical study that assigns treatment based on genomic abnormalities.
MDS Dysregulated Pathways and Predicted Therapies. MDS patient-specific avatars illustrating predicted dysregulated pathways were created using next generation sequencing and a novel simulation software method. Depicted here is one pathway map from a patient with U2AF1 gain-of-function mutation, TP53 loss-of-function mutation, and various chromosome copy number mutations affecting DUSP1, PTPN1, MAPK9, AURKA, BCL2, and other pathways. The downstream pathways effects are mapped and the totality of mutations is predicted to cause increased MDS cell proliferation and viability. FDA-approved drugs predicted to impact dysregulated pathways (in this case, simvastatin (orange) and metformin (red)) are also shown in the map at critical impact points.
MDS Dysregulated Pathways and Predicted Therapies. MDS patient-specific avatars illustrating predicted dysregulated pathways were created using next generation sequencing and a novel simulation software method. Depicted here is one pathway map from a patient with U2AF1 gain-of-function mutation, TP53 loss-of-function mutation, and various chromosome copy number mutations affecting DUSP1, PTPN1, MAPK9, AURKA, BCL2, and other pathways. The downstream pathways effects are mapped and the totality of mutations is predicted to cause increased MDS cell proliferation and viability. FDA-approved drugs predicted to impact dysregulated pathways (in this case, simvastatin (orange) and metformin (red)) are also shown in the map at critical impact points.
Cogle:Leukemia & Lymphoma Society: Research Funding. Off Label Use: Treating MDS with one of these regimens: (1) nelfinavir, (2) bortezomib, (3) metformin + simvastatin, (4) metformin + seliciclib, (5) nelfinavir + bortezomib, (6) nelfinavir + ruxolitinib, (7) nelfinavir + simvastatin, (8) nelfinavir + sorafenib, (9) nelfinavir + trametinib, (10) ponatinib + bortezomib, (11) nelfinavir + ponatinib, and (12) trametinib + simvastatin.. Vali:Cellworks: Employment. Kumar:Cellworks: Employment. Singh:Cellworks: Employment. Nair:Cellworks: Employment. Lala:Cellworks: Employment. Basu:Cellworks: Employment. Abbasi:Cellworks: Employment. Albitar:Neogenomics: Employment.
Author notes
Asterisk with author names denotes non-ASH members.


This feature is available to Subscribers Only
Sign In or Create an Account Close Modal