Abstract
Background: Acute myeloid leukemia (AML) is a heterogeneous disease with high genomic and phenotypic complexity. Although a relationship between phenotype and t(15;17) is recognized, the effect of other genotypic abnormalities on phenotype remains to be elucidated.
Objective: To explore the relationships between genotypic and phenotypic abnormalities in diagnostic specimens in pediatric AML.
Methods: Of 1022 newly diagnosed pediatric patients with de novo AML enrolled on protocol AAML0531, 769 satisfied three criteria for this study: (1) submission of a blood or bone marrow sample for multidimensional flow cytometry (MDF) at diagnosis, (2) consent to blood bank specimen testing and (3) leukemia comprising >10% of non-erythroid cells by MDF. The diagnostic AML tumor population was identified by gating on CD45 vs log-SSC. A fifteen-dimensional immunophenotypic expression profile (IEP) was defined by computing mean fluorescent intensities, antigen intensity coefficient of variations, and light scatter characteristics of each leukemia without analyst imposed cut-offs.
Unsupervised hierarchical clustering was performed to mathematically cluster patients with similar IEPs. The underlying karyotypic and mutational profile of each patient was compared to the IEPs to identify clusters of patients with relationships between phenotype and identifiable genetic abnormalities. Supervised bagged tree-based models were used to quantify the importance of each cell-surface antigen in identifying these clusters. Levene's test was used to assess the homogeneity of mean cell-surface antigen expression for important markers.
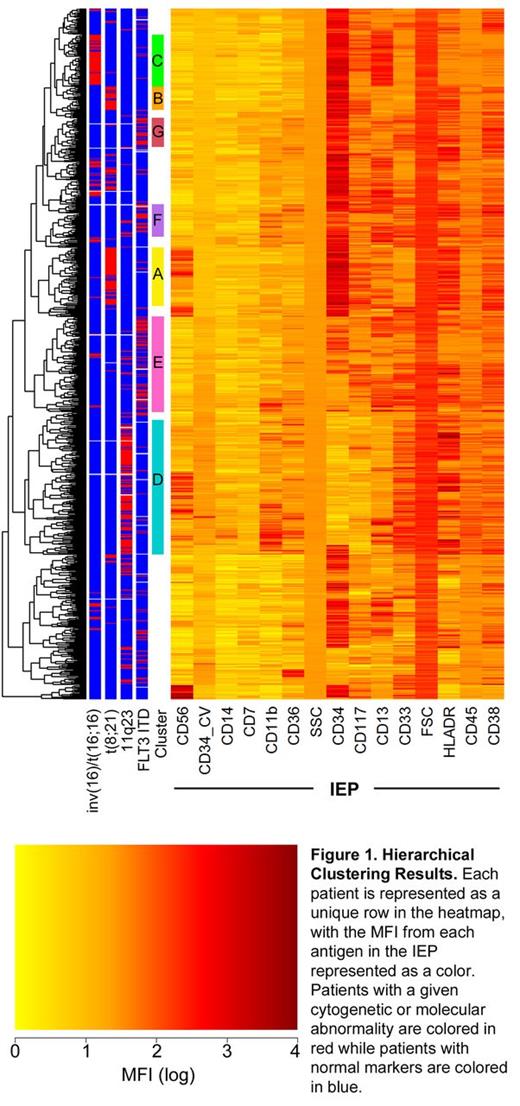
Results: Analysis of hierarchical clustering results revealed 7 immunophenotypic clusters (A-G) of patients with relationships between IEP and 4 common genetic abnormalities (Figure 1).
Cluster A and Cluster B were both strongly associated with the t(8;21) karyotype (Figure 1). 54/62 patients in Cluster A (87%) and 24/26 patients in Cluster B (92%) were positive for t(8;21). The most important cell-surface antigens in identifying patients with the Cluster A associated phenotype were dim CD33, expression of CD56, expression of CD34 and expression of HLA-DR. The mean antigen expression of these markers was significantly more homogenous for patients in Cluster A compared to all other patients for CD33 (p = 0.02), CD34 (p < 0.01) and HLA-DR (p<0.01). Mean expression of CD56 was notably more heterogeneous (p = 0.40) but positive in 91% of patients in this cluster. The most important cell-surface antigens in identifying the Cluster B associated phenotype were dim CD13, expression of CD34, expression of HLA-DR and dim CD33. The mean expression of these markers was significantly more homogeneous for patients in Cluster B compared to all other patients (all p values <0.01). In contrast to Cluster A, CD56 MFIs were negative for patients in Cluster B. Collectively, 72% of all patients with t(8;21) segregated into Cluster A (50%) or Cluster B (22%).
Cluster C was strongly associated with chromosome 16 abnormalities (Figure 1). Of patients in this cluster, 50/55 (91%) were positive for inv(16)/t(16;16). The mean high-expression of CD13 was the most important antigen in identifying patients with this phenotype, and patients in Cluster C had more consistent mean CD13 expression compared to all other patients (p<0.01). 53% of all patients with chromosome 16 abnormalities comprised this cluster.
Cluster D was strongly associated with 11q23 abnormalities (Figure 1). Of patients in this cluster, 105/135 (78%) were positive for 11q23 translocations. The most discriminating markers in identifying these patients were dim-to-negative CD34 and dim-to-negative CD117. 69% of all patients with 11q23 abnormalities comprised this cluster.
Clusters E, F and G were associated with FLT3 ITD mutations (Figure 1). Of patients in these clusters, 44%, 49% and 53% were positive for FLT3 ITD mutations. Cumulatively, 63% of all patients with FLT3 ITD mutations were grouped into one of these three clusters.
Conclusion: Hierarchical clustering algorithms identify IEPs associated with common genetic abnormalities in pediatric AML, providing insight into the consistent dysregulation of cell-surface gene product expression in patients with common genetic abnormalities. Further analysis may reveal that IEPs can identify patients otherwise classified as good or standard risk that will have a poor outcome.
Voigt:Hematologics Inc.: Employment. Brodersen:Hematologics Inc.: Employment. Menssen:Hematologics Inc.: Employment. Loken:Hematologics Inc.: Equity Ownership.
Author notes
Asterisk with author names denotes non-ASH members.


This feature is available to Subscribers Only
Sign In or Create an Account Close Modal