Abstract
Introduction: Hydroxyurea (HU) reduces vaso-occlusive complications, hospitalizations and transfusion requirements in children with sickle cell anemia (SCA; HbSS and HbSβ0thalassemia). Despite linear pharmacokinetics (PK) and apparent dose dependency for HU effect, there remains unexplained large inter-individual variability in drug response. To better understand this variability, we conducted a PK study of HU to assess: 1) effect of multiple dosing on PK of HU, and 2) explore the utility of using a single post-dose HU plasma concentration as a basis for therapeutic drug monitoring.
Methods: Data from two prospective trials, "Pharmacokinetics of Liquid Hydroxyurea in Pediatric Patients with Sickle Cell Anemia" (NCT01506544) and "Single-Dose (SD) and Steady-State (SS) Pharmacokinetics of Hydroxyurea in Children and Adolescents with Sickle Cell Disease", were utilized for this analysis. Participants were children (≤18 years) with HgbSS and HbSβ0 thalassemia from 8 medical centers in the U.S. One cohort of patients had never been treated with HU and the second cohort had been treated with HU for at least ≥3 months at a stable dose. All participants received a single oral dose of HU and plasma PK samples were collected pre-dose, then at 15, 30, 45, and 60 minutes, and 1.5, 2, 4, 6, and 8 hours after study drug was administered under direct supervision. HU was quantitated from plasma and urine using a validated HPLC method. PK parameters for HU were determined from each patient using a standard model-independent approach (apparent Cmax observed from plasma concentration vs time data; AUC determined via a log-linear approach). PK parameters were compared using parametric (two-sample t-test) or nonparametric (Wilcoxon Rank Sum test) as appropriate based on normality of distribution. The coefficient of determination was used to determine the most predictive relationship between post-peak HU plasma concentrations and systemic exposure (AUC). The significance limit accepted for all statistical analyses was a = 0.05.
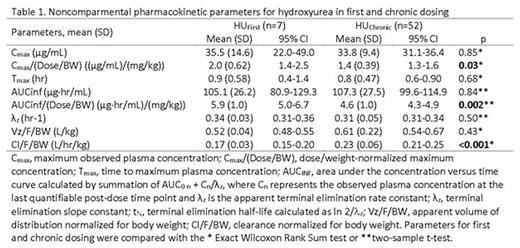
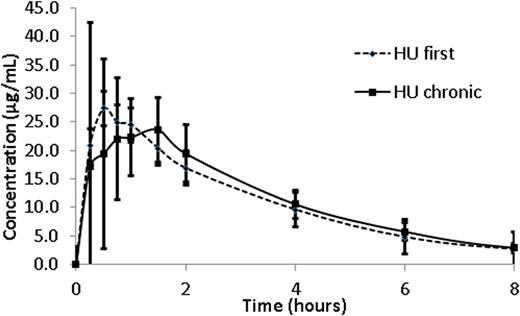
Results: A complete plasma HU PK profile was obtained for 59 children. Participants with PK after the first dose (n=7, HUfirst) group received an average dose of 17.9 ±2.6 mg/Kg of HU whereas those with PK after multiple doses (n=52, HUchronic group) received an average dose of 23.8 ±5.1 mg/Kg (p < 0.01). Absorption of HU was rapid in both groups with a time to maximal plasma concentration (Tmax) of 0.9 ±0.58 hours in the HUfirst group and 0.8 ±0.47 hours in the HUchronic group (p=0.68). The mean dose/weight- normalized Cmax in the HUfirst group (2.0 mg/L per 1 mg/kg dose) was 1.4 fold higher than in the HUchronic (1.4 mg/L per 1 mg/kg) (p=0.03). A similar relationship was observed in mean dose/weight-normalized AUCinf, where the HUfirst group was 1.3 fold higher than in the HUchronic group (5.9 vs 4.6 mg/L*hr per 1 mg/kg; p=0.002). Weight-normalized mean apparent oral clearance (Cl/F) was significantly lower in the HUfirst cohort (0.17 L/hr/kg) as compared to the HUchronic (0.23 L/hr/kg) (p<0.001). The mean apparent volume of distribution (Vz/F) for the HUfirst cohort (0.52 L/kg) was not significantly different than that in the HUchronic cohort (0.61 L/kg) (Table 1). As suggested by data in Figure 1a, the apparent mean elimination half-life did not vary between the groups (e.g., 2.1 hr in HUfirst vs. 2.3 hr in HUchronic). Finally, between 45 minutes post-dose and through the last blood sampling point, the 4 hour post-dose concentration most accurately predicted the AUC of HU (r2= 0.78) (Figure 1b).
Conclusion: Weight and dose-normalized PK parameters for HU suggest potential differences in the bioavailability of the drug with multiple dosing. This finding may contribute to the known wide variability in HU response. Finally, a single 4 hour post-dose HU plasma concentration adequately predicts systemic exposure (AUC) to HU and thus, could provide an approach to facilitate dose individualization / optimization.
Mean hydroxyurea (HU) concentration (μg/mL) per time (hour) profiles in children on chronic HU therapy (HUchronic) and children who are receiving the first dose of drug (HUfirst). Error bars represent standard deviation of the mean.Figure 1A. The coefficient of determination (R2) of the linear correlation between plasma concentration (DV) and observed AUCinf at 4.0 hours in all children (HUtreated and HUfirst) to therapy.
Mean hydroxyurea (HU) concentration (μg/mL) per time (hour) profiles in children on chronic HU therapy (HUchronic) and children who are receiving the first dose of drug (HUfirst). Error bars represent standard deviation of the mean.Figure 1A. The coefficient of determination (R2) of the linear correlation between plasma concentration (DV) and observed AUCinf at 4.0 hours in all children (HUtreated and HUfirst) to therapy.
Liem:National Institute of Health: Research Funding; Ann & Robert H. Lurie Children's Hospital of Chicago: Research Funding; Ann & Robert H. Lurie Children's Hospital of Chicago: Employment. Estepp:Daiichi Sankyo: Membership on an entity's Board of Directors or advisory committees, Research Funding; Global Blood Therapeutics: Membership on an entity's Board of Directors or advisory committees, Research Funding; Pfizer: Research Funding; National Institute of Health: Research Funding.
Author notes
Asterisk with author names denotes non-ASH members.


This feature is available to Subscribers Only
Sign In or Create an Account Close Modal