Key points
Cost-effectiveness of first- and second-line use of daratumumab for transplant-eligible NDMM patients was compared using a Markov model.
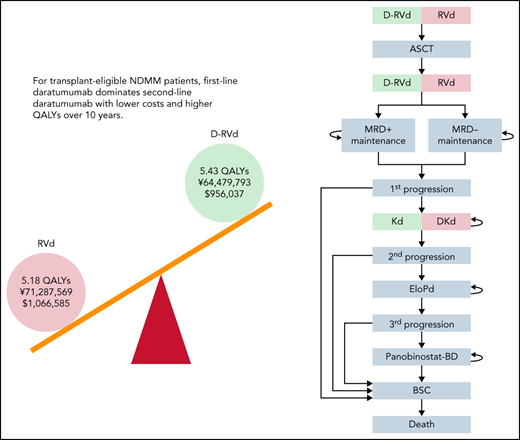
First-line use dominated second-line use of daratumumab with higher QALY and lower cost over 10-year time horizon.
Abstract
Triplet regimens, such as lenalidomide, bortezomib, and dexamethasone (RVd) or thalidomide, bortezomib, and dexamethasone (VTd), are standard induction therapies for transplant-eligible patients with newly diagnosed multiple myeloma (NDMM). The addition of daratumumab to RVd and VTd has been investigated in the GRIFFIN and CASSIOPEIA trials, respectively, resulting in improvement in the rate of minimal residual disease (MRD) negativity. In this study, we conducted a cost-effectiveness analysis with a 10-year time horizon to compare first-line and second-line use of daratumumab for transplant-eligible patients with NDMM. Because long-term follow-up data for these clinical trials are not yet available, we developed a Markov model that uses MRD status to predict progression-free survival. Daratumumab was used either in the first-line setting in combination with RVd or VTd or in the second-line setting with carfilzomib plus dexamethasone (Kd). Quality-adjusted life-years (QALYs) and incremental cost-effectiveness ratios were calculated from a Japanese and US payer perspective. In the Japanese analysis, D-RVd showed higher QALYs (5.43 vs 5.18) and lower costs (¥64 479,793 vs ¥71 287 569) compared with RVd, and D-VTd showed higher QALYs (5.67 vs 5.42) and lower costs (¥43 600 310 vs ¥49 471,941) compared with VTd. Similarly, the US analysis demonstrated dominance of a strategy incorporating daratumumab in first-line treatment regimens. Given that overall costs are reduced and outcomes are improved when daratumumab is used as part of a first-line regimen, the economic analysis indicates that addition of daratumumab to first-line RVd and VTd regimens is a dominant strategy compared with reserving its use for the second-line setting.
Introduction
Multiple myeloma (MM) is a malignant plasma cell disorder that affects older adults with a median age of ∼70 years. Survival of patients with MM has improved significantly with the availability of new therapeutic options, such as immunomodulatory drugs, proteasome inhibitors, and CD38-targeting monoclonal antibodies. Induction therapy with a triplet regimen, such as lenalidomide, bortezomib, and dexamethasone (RVd) or thalidomide, bortezomib, and dexamethasone (VTd), followed by autologous stem cell transplantation (ASCT) with or without maintenance therapy is currently the standard of care for transplant-eligible patients with newly diagnosed multiple myeloma (NDMM). Recently, 2 randomized controlled trials were conducted to evaluate the incorporation of daratumumab (D), a fully human anti-CD38 monoclonal antibody, in triplet regimens for transplant-eligible patients with NDMM. Both the GRIFFIN and the CASSIOPEIA trials, which compared D-RVd vs RVd and D-VTd vs VTd, respectively, have shown promising results with the addition of daratumumab.1-5
As progression-free survival (PFS) and overall survival (OS) in the first-line management of patients with MM have improved such that long follow-up is required to assess these outcomes in comparative trials, minimal residual disease (MRD) status has emerged as a relevant surrogate marker for survival.6 Methods to evaluate MRD include next-generation sequencing (NGS) and next-generation flow cytometry.7 A recent large meta-analysis on the role of MRD in MM survival reported that MRD negativity has strong prognostic value in various risk-group and treatment settings.8,9 In the IFM 2009 trial, which compared early and late ASCT for patients with NDMM treated with RVd, MRD negativity as assessed by NGS with a 10−6 threshold was associated with prolonged PFS regardless of the treatment group.10,11 In the GRIFFIN trial, the D-RVd vs RVd arm showed MRD negativity with a 10−5 threshold by NGS in 50.0% vs 20.4%,5 respectively. In the CASSIOPEIA trial, the D-VTd vs VTd arm showed MRD negativity with a 10−5 threshold in 64% vs 44% by next-generation flow cytometry, and 57% vs 37% by NGS, respectively.3 Although the long-term outcomes of these trials are not available, these results suggest that improved survival can be expected with the addition of daratumumab.
Since the survival of patients with MM has lengthened significantly and most novel agents are continued until progression, the total cost of MM treatment has become substantial. Median OS of transplant-eligible patients with NDMM is reported to be 110 months for the 2005-2009 period and not reached for the 2010-2014 period,12 suggesting a longer time horizon is needed to evaluate the cost-effectiveness of MM treatment compared with the treatment of other hematological malignancies. For transplant-ineligible patients with NDMM, Patel et al recently conducted a cost-effectiveness analysis of daratumumab,13 based on the MAIA trial, which compared daratumumab, lenalidomide, plus dexamethasone (DRd) with lenalidomide plus dexamethasone (Rd) alone.14 They concluded that incorporation of daratumumab as a first-line treatment improved quality-adjusted life-years (QALY) but not cost-effectiveness under current pricing, and therefore, it should be reserved for the second-line from the point of view of cost-effectiveness. Other studies on the cost-effectiveness of daratumumab have been in a relapsed or refractory setting, and few studies have shown improved cost-effectiveness with daratumumab.15-19 The cost-effectiveness of daratumumab in transplant-eligible NDMM is an important issue but has not yet been investigated.
In this study, we conducted a cost-effectiveness analysis with a 10-year time horizon to assess the incorporation of daratumumab in induction, consolidation, and maintenance for ASCT. Because long-time survival data for the daratumumab-containing regimen in transplant-eligible patients are not available, with the median follow-up of 38.6 months for the GRIFFIN and 44.5 months for the CASSIOPEIA trial, we developed a Markov model to estimate long-term survival by using MRD status after ASCT to predict PFS, and predicting survival after first relapse by sequentially attributing results of major clinical trials for relapsed or refractory multiple myeloma (RRMM).
Methods
Construction of the model
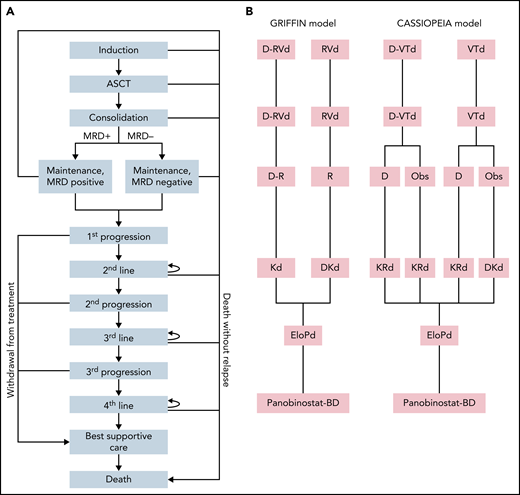
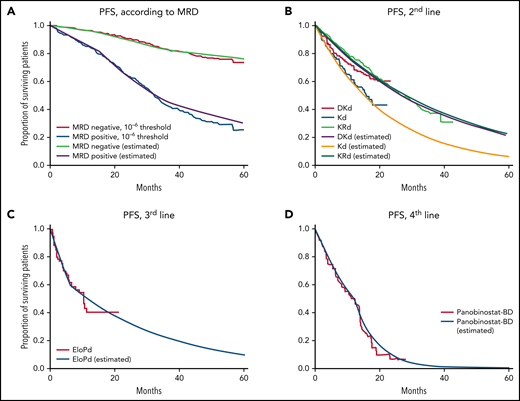
The model is conducted for patients with NDMM with a median age of 60 years without comorbidities that preclude them from receiving ASCT. A Markov model was constructed to simulate the 10-year clinical course of NDMM. A simplified Markov diagram of the model is illustrated in Figure 1. The length of each Markov cycle was defined as 3 months. First, we constructed a model to compare D-RVd and RVd (GRIFFIN model). In accordance with the study protocol for the GRIFFIN trial, patients were assumed to receive 4 courses of induction therapy with either D-RVd or RVd before ASCT. After ASCT, patients received 2 courses of consolidation therapy with either D-RVd or RVd before ASCT, followed by maintenance with lenalidomide and daratumumab for the D-RVd arm and lenalidomide monotherapy for the RVd arm, for up to 2 years or until progression if patients progressed prior to 2 years. Early death was assumed to occur in 1% of patients in each arm per the Markov cycle during induction, ASCT, and consolidation. We hypothesized that MRD status after consolidation can predict PFS after first-line treatment. In the model, patients who completed consolidation proceeded to “maintenance, MRD negative” or “maintenance, MRD positive,” according to MRD negativity at 10−5 threshold assessed by NGS reported in the trial (50.0% for D-RVd and 20.4% for RVd). The transition probability from “maintenance” to “first progression” or “death” was defined according to PFS by MRD status of the transplant arm in the IFM 2009 trial (Table 1, Figure 2A).10,11 Second-line treatment was defined as Kd (carfilzomib plus dexamethasone) for the D-RVd arm and DKd (daratumumab, carfilzomib, and dexamethasone) for the RVd arm. Third- and fourth-line treatments were defined as EloPd, and panobinostat-Bd, respectively, for both arms.
Construction of the Markov model. (A) Markov diagram. (B) Regimens used in each line of treatment. Bd, bortezomib and dexamethasone; EloPd, elotuzumab, pomalidomide, and dexamethasone; KRd, carfilzomib, lenalidomide, and dexamethasone; Obs, observation; R, lenalidomide.
Construction of the Markov model. (A) Markov diagram. (B) Regimens used in each line of treatment. Bd, bortezomib and dexamethasone; EloPd, elotuzumab, pomalidomide, and dexamethasone; KRd, carfilzomib, lenalidomide, and dexamethasone; Obs, observation; R, lenalidomide.
Parameters used in the model
| . | . | Base case . | Range for DSA . | Distribution for PSA . | |
|---|---|---|---|---|---|
| Low . | High . | ||||
| Japanese cost (in JPY) | |||||
| Bortezomib | 1.7 mg/m2 | 138 704 | 69 352 | 208 056 | γ |
| Lenalidomide | 25 mg | 40 427 | 20 213 | 60 640 | γ |
| Thalidomide | 100 mg per body | 6 883 | 3 442 | 10 325 | |
| Daratumumab | 16 mg/kg | 480 464 | 240 232 | 720 696 | γ |
| Carfilzomib | 20 mg/m2 | 87 852 | 43 926 | 131 778 | γ |
| 27 mg/m2 | 112 278 | 56 139 | 168 417 | γ | |
| 56 mg/m2 | 263 556 | 131 778 | 395 334 | γ | |
| Pomalidomide | 4 mg | 61 669 | 30 835 | 92 504 | γ |
| Panobinostat | 20 mg | 74 523 | 37 261 | 111 784 | γ |
| Dexamethasone | 20 mg | 861 | 430 | 1 291 | γ |
| Autologous transplantation | 3 mo | 4 515 479 | 2 257 740 | 6 773 219 | γ |
| Elotuzumab | 10 mg/kg | 326 690 | 163 345 | 490 035 | γ |
| Outpatient supportive care (on treatment) | 3 mo | 76 620 | 38 310 | 114 930 | γ |
| Outpatient supportive care (off treatment) | 3 mo | 30 710 | 15 355 | 46 065 | γ |
| Palliative care (including hospice care) | 3 mo | 1 753 014 | 876 507 | 2 629 521 | γ |
| US cost (in USD) | |||||
| Bortezomib | 1.7 mg/m2 | 1 503 | 752 | 2 255 | γ |
| Lenalidomide | 25 mg | 736 | 368 | 1 104 | γ |
| Thalidomide | 100 mg per body | 214 | 107 | 321 | |
| Daratumumab | 16 mg/kg | 6 497 | 3 249 | 9 746 | γ |
| Carfilzomib | 20 mg/m2 | 1 971 | 986 | 2 957 | γ |
| 27 mg/m2 | 1 971 | 986 | 2 957 | γ | |
| 56 mg/m2 | 3 943 | 1 972 | 5 915 | γ | |
| Pomalidomide | 4 mg | 842 | 421 | 1 262 | γ |
| Panobinostat | 20 mg | 1 222 | 611 | 1 833 | γ |
| Dexamethasone | 20 mg | 861 | 430 | 1 291 | γ |
| Autologous transplantation | 3 mo | 60 000 | 30 000 | 90 000 | γ |
| Elotuzumab | 10 mg/kg | 4 736 | 2 368 | 7 104 | γ |
| Outpatient supportive care (on treatment) | 3 mo | 1 656 | 828 | 2 483 | γ |
| Outpatient supportive care (off treatment) | 3 mo | 341 | 171 | 512 | γ |
| Palliative care (including hospice care) | 3 mo | 47 610 | 23 805 | 71 415 | γ |
| Utilities | |||||
| First line | 0.659 | 0.494 | 0.824 | β | |
| Maintenance | 0.833 | 0.625 | 1.000 | β | |
| Second line | 0.62 | 0.465 | 0.775 | β | |
| Third line | 0.606 | 0.455 | 0.758 | β | |
| Fourth line or BSC | 0.494 | 0.371 | 0.618 | β | |
| Probabilities | |||||
| MRD-negative (RVd) | 0.204 | 0.153 | 0.255 | β | |
| MRD-negative (D-RVd) | 0.5 | 0.375 | 0.625 | β | |
| MRD-negative (VTd) | 0.37 | 0.278 | 0.463 | β | |
| MRD-negative (D-VTd) | 0.57 | 0.428 | 0.713 | β | |
| PFS, second line, Dkd | 0.925 | 0.897 | 0.953 | β | |
| PFS, second line, Kd | 0.87 | 0.844 | 0.896 | β | |
| PFS, second line KRd | 0.928 | 0.900 | 0.956 | ||
| PFS, MRD-positive | Cycle 1-5 | 0.96 | 0.931 | 0.989 | β |
| Cycle 6-12 | 0.92 | 0.892 | 0.948 | β | |
| Cycle 13- | 0.95 | 0.922 | 0.979 | β | |
| PFS, MRD-negative | Cycle 1-5, 13- | 0.99 | 0.960 | 1.000 | β |
| Cycle 6-12 | 0.98 | 0.951 | 1.000 | β | |
| PFS, third-line, EloPd | Cycle 1-2 | 0.775 | 0.752 | 0.798 | β |
| Cycle 3- | 0.904 | 0.877 | 0.931 | β | |
| PFS, fourth-line, Panobinostat+BD | Cycle 1-4 | 0.84 | 0.815 | 0.865 | β |
| Cycle 5- | 0.65 | 0.631 | 0.670 | β | |
| Withdrawal from 2nd line | 0.06 | 0 | 0.5 | β | |
| Withdrawal from 3rd line | 0.15 | 0 | 0.5 | β | |
| Withdrawal from 4th line | 0.2 | 0 | 0.5 | β | |
| Death as a PD event | 0.1 | 0 | 0.2 | β | |
DSA, deterministic sensitivity analysis; JPY, Japanese yen; PD, progressive disease; USD, US dollars.
Drug costs are shown as costs per administration. Probabilities for PFS means per cycle probabilities of maintaining PFS.
PFS curves according to parameters used in the model. PFS of (A) MRD− and MRD+ patients after ASCT (IFM 2009), (B) Second-line DKd, Kd (CANDOR), and KRd (ASPIRE), (C) EloPd (ELOQUENT-3), and (D) panobinostat-Bd (PANORAMA-1). Survival curves are shown from published clinical trials; curves marked “estimated” in the key were calculated using the model.
PFS curves according to parameters used in the model. PFS of (A) MRD− and MRD+ patients after ASCT (IFM 2009), (B) Second-line DKd, Kd (CANDOR), and KRd (ASPIRE), (C) EloPd (ELOQUENT-3), and (D) panobinostat-Bd (PANORAMA-1). Survival curves are shown from published clinical trials; curves marked “estimated” in the key were calculated using the model.
We next constructed the second model to compare D-VTd and VTd (CASSIOPEIA model). Patients were assumed to receive 4 courses of induction therapy with either D-VTd or VTd before ASCT. After ASCT, patients received 2 courses of consolidation therapy with either D-VTd or VTd. In the study protocol, patients in each arm were randomized in a 1:1 ratio to observation or maintenance therapy with daratumumab every 8 weeks for up to 2 years or until progression if patients progressed prior to 2 years. In the model, we assumed that 50% of the patients in each arm received maintenance therapy. PFS after consolidation was calculated in the same way as in the GRIFFIN model, according to MRD negativity at 10−5 threshold assessed by NGS reported in the trial (57% for D-VTd and 37% for VTd). Because this MRD-based model assumed lenalidomide maintenance, a strategy not employed in the CASSIOPEIA trial, we also constructed an alternative model based on outcomes of the maintenance part of the CASSIOPEIA trial (CASSIOPEIA alternative model; supplemental Figure 1, available on the Blood Web site).4 Second-line treatment for the CASSIOPEIA model was defined as KRd for patients who had been treated by daratumumab (D-VTd plus observation-only, D-VTd plus D maintenance, and VTd plus D maintenance), and DKd for daratumumab-naive patients (VTd plus observation-only). Third- and fourth-line treatments were identical to the GRIFFIN model.
Transition probabilities for the second-, third-, and fourth-line treatments were defined according to published data of the CANDOR trial,20 ASPIRE trial,21 the ELOQUENT-3 trial,22 and a subgroup of patients in the PANORAMA-1 trial who received ≥2 prior therapies (Table 1, Figure 2B-D).23,24 The reported survival outcomes of each trial and modeled data are shown in supplemental Table 1.
Because not all data of clinical trials are available, we made several assumptions. We attributed 90% of PFS events to progression, and 10% to death without progression. We also assumed that the percentage of patients who do not proceed to the next therapy due to patient refusal or poor performance status would increase in later lines of therapy, based on a previously published report.25 All transition probabilities along with the range for sensitivity analysis are shown in Table 1.
The cost-effectiveness of first-line vs second-line daratumumab over 10 years was assessed by calculating the incremental cost-effectiveness ratio (ICER), which represents the additional costs to gain an additional year lived in perfect health. To assess the cost-effectiveness of 2 treatment strategies, ICER of first-line vs second-line daratumumab was compared with a willingness-to-pay (WTP) threshold. We used a WTP threshold ¥7 500 000 (equivalent to $65 217, with conversion rate as of February 20, 2022, $1 = ¥115.0) per QALY for Japanese and $150 000 for US analysis. All costs and utilities were discounted by 3% annually, in accordance with the recommendation of the Panel on Cost-Effectiveness in Health and Medicine.26 The Markov model was constructed, and the cost-effectiveness was analyzed using TreeAge Pro Healthcare 2021 R1.2 (TreeAge Software, Williamstown, MA).
Costs and effectiveness
The costs used for the analysis are shown in Table 1. The dosing schedules for all regimens are detailed in supplemental Table 2. The analysis was performed from the payer’s perspective and only included direct medical costs. For Japanese analysis, the base costs of chemotherapeutic drugs were extracted from the Japanese National Health Insurance Drug Price Standard in 2021. In calculating drug costs, patient body weight and body surface area were assumed as 60 kg and 1.7 m2, respectively, and the dosage was rounded up to the nearest vial. We defined costs for office visits according to standard practice in Japan. Briefly, patients were assumed to receive an office visit and blood examination weekly while on therapy, and monthly while off therapy or on maintenance. Supportive care consisted of acyclovir, H2 blockers, and monthly IV bisphosphonates. Best supportive care consisted of 2 months of outpatient supportive care by medication for palliation such as opioids, and 1 month of inpatient hospice care. The costs for US analysis were extracted from published studies.13,16,27
Sensitivity analysis
In the deterministic sensitivity analysis, expected-value analysis was made by varying parameters across the ranges shown in Table 1. Ranges for costs, QALYs, probability for MRD status, and transition probabilities among Markov states were defined as ±50%, 25%, 25%, and 3% of the base values, respectively. The range for the withdrawal rate from subsequent therapy was defined as 0% to 50%. For the length of time horizon, we performed 15-year, 20-year, and lifelong analyses with starting ages of 50, 60, and 70 years. In performing lifelong analysis, age-matched background mortality and withdrawal rates were incorporated in the model with age increasing as the Markov cycle advances (supplemental Figure 2). Annual discount rates for costs and QALYs were varied from 1.5% to 4.5%. The additional parameters used in sensitivity analysis were shown in supplemental Table 3.
We also performed analysis using different clinical scenarios, including (1) subcutaneous administration of daratumumab; (2) DKd instead of Kd for patients relapsed after D-RVd and D-VTd; (3) alternative dosing of carfilzomib (70 mg/m2 weekly) in DKd and Kd30; (4) Pd (pomalidomide and dexamethasone),31 DPd (daratumumab, pomalidomide, and dexamethasone),32 and IsaPd (isatuximab, pomalidomide, and dexamethasone)31 instead of EloPd for the third-line treatment; (5) selinexor33 and belantamab mafodotin34 instead of Panobinostat-BD for the fourth-line treatment. In addition, we performed scenario analysis for the CASSIOPEIA model, including (6) CASSIOPEIA alternative model (supplemental Figure 1); (7) D-VTd plus D maintenance vs VTd plus observation only; (8) DRd (daratumumab, lenalidomide, dexamethasone)35 for a second-line therapy for daratumumab-naive patients.
Probabilistic sensitivity analysis (PSA) was conducted applying β distributions for probabilities and utilities, and γ distributions for costs. A multivariable PSA was performed using 10 000 Monte Carlo simulations comparing D-RVd with RVd in GRIFFIN model and D-VTd with VTd in the CASSIOPEIA model. The adherence of this study to the Consolidated Health Economic Evaluation Reporting Standards 2022 (CHEERS 2022) statement36 is provided in supplemental Table 4.
Results
Simulation of PFS and OS according to the model
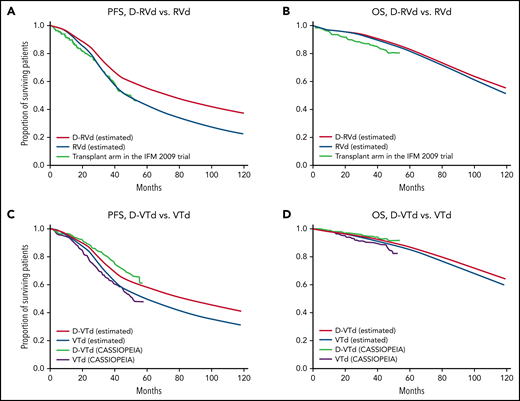
In the GRIFFIN model, estimated PFS of D-RVd, PFS of RVd, OS of D-RVd, and OS of RVd at 120 months were 37.2%, 22.5%, 54.9%, and 51.2%, respectively (Figure 3A-B). In the CASSIOPEIA model, estimated PFS of D-VTd, PFS of VTd, OS of D-VTd, and OS of VTd at 120 months were 40.7%, 30.8%, 64.9%, and 59.1%, respectively (Figure 3C-D). In the CASSIOPEIA alternative model, estimated PFS of D-VTd, PFS of VTd, OS of D-VTd, and OS of VTd at 120 months were 42.5%, 24.9%, 66.4%, and 55.7%, respectively (supplemental Figure 1C-D). The calculated survivals correlated well with those of the clinical trials. PFS2 and PFS3 for all models are shown in supplemental Figure 3.
PFS and OS of first- and second-line daratumumab calculated by the models. (A) PFS, (B) OS by the GRIFFIN model, and (C) PFS, and (D) OS by the CASSIOPEIA model. Survival curves are shown from clinical trials; curves marked “estimated” in the key were calculated using the model.
PFS and OS of first- and second-line daratumumab calculated by the models. (A) PFS, (B) OS by the GRIFFIN model, and (C) PFS, and (D) OS by the CASSIOPEIA model. Survival curves are shown from clinical trials; curves marked “estimated” in the key were calculated using the model.
Cost-effectiveness analysis
Costs, QALYs, and ICER for first- and second-line daratumumab calculated by our models are shown in Table 2. At 60 months, ICER of first- vs second-line daratumumab far exceeded the Japanese WTP threshold of ¥7 500 000 per QALY and US WTP threshold of $150 000 per QALY, suggesting that first-line use of daratumumab may not be cost-effective when a short (5-year) time horizon is considered. In contrast, both D-RVd and D-VTd showed higher QALY with lower costs at 120 months compared with RVd and VTd, meaning that first-line was dominant compared with second-line daratumumab regardless of the WTP threshold. The breakdown of costs and QALYs by stage for the GRIFFIN and CASSIOPEIA model is detailed in supplemental Tables 5 and 6, respectively, showing that the key driver of QALY gain is the PFS on first-line treatment, and the key driver for cost saving is the costs of second-line treatment.
The results for cost-effectiveness analysis of first vs second-line daratumumab by the GRIFFIN and CASSIOPEIA model, with the time horizon of 5 y, 10 y, and lifelong (starting at age 60)
| . | . | Costs . | US (USD) . | Incremental costs . | US (USD) . | Effectiveness (QALY) . | Incremental effectiveness (QALY) . | ICER . | US (USD/QALY) . |
|---|---|---|---|---|---|---|---|---|---|
| Japan (JPY) . | Japan (JPY) . | Japan (JPY/QALY) . | |||||||
| GRIFFIN model | |||||||||
| 5 y | D-RVd | 47 885 772 | 713 318 | 7 477 011 | 95 943 | 3.34 | 0.08 | 99 017 942 | 1 270 567 |
| RVd | 40 408 762 | 617 375 | 3.26 | ||||||
| 10 y | D-RVd | 64 479 793 | 956 037 | −6 807 776 | −110 548 | 5.43 | 0.25 | Dominant | Dominant |
| RVd | 71 287 569 | 1 066 585 | 5.18 | ||||||
| Lifelong | D-RVd | 75 722 495 | 1 119 648 | −18 275 811 | −277 352 | 8.17 | 1.19 | Dominant | Dominant |
| RVd | 93 998 306 | 1 397 000 | 6.99 | ||||||
| CASSIOPEIA model | |||||||||
| 5 y | D-VTd | 28 136 231 | 423 225 | 2 242 802 | 33 967 | 3.38 | 0.06 | 37 268 707 | 564 436 |
| VTd | 25 893 429 | 389 257 | 3.32 | ||||||
| 10 y | D-VTd | 43 600 310 | 673 919 | −5 871 631 | −72 984 | 5.67 | 0.25 | Dominant | Dominant |
| VTd | 49 471 941 | 746 903 | 5.42 | ||||||
| Lifelong | D-VTd | 57 756 308 | 898 611 | −11 062 629 | −139 203 | 8.90 | 1.00 | Dominant | Dominant |
| VTd | 68 818 937 | 1 037 814 | 7.90 |
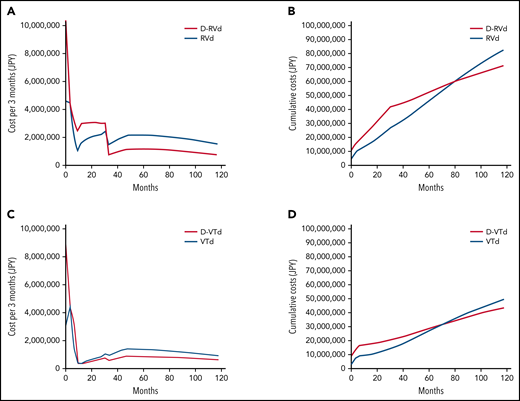
The costs per Markov cycle and cumulative costs in Japanese analysis with both strategies are shown in Figure 4. In the GRIFFIN model, the costs per cycle were highest in the first cycle and decreased with cycles. The cost was consistently higher for D-RVd until 33 months, which accounts for the end of maintenance therapy (Figure 4A). The cost per cycle was higher for the RVd arm for the rest of therapy, which reflects the high cost of second-line DKd. According to the model, the cumulative cost of RVd exceeds that of D-RVd at 78 months (Figure 4B). In the CASSIOPEIA model, the results were similar but the costs during maintenance therapy are lower in both arms (Figure 4C). The cumulative cost of VTd exceeds that of D-VTd at 72 months (Figure 4D).
Costs per cycle and cumulative costs for first- and second-line daratumumab. Costs per Markov cycle (3 months) and cumulative costs over 10 years for the (A-B) GRIFFIN model and (C-D) CASSIOPEIA model.
Costs per cycle and cumulative costs for first- and second-line daratumumab. Costs per Markov cycle (3 months) and cumulative costs over 10 years for the (A-B) GRIFFIN model and (C-D) CASSIOPEIA model.
In summary, first-line use of daratumumab was consistently associated with higher QALY than second-line use. Total costs per cycle were initially higher when daratumumab was used in the first-line setting but decreased over time such that using daratumumab in the first-line setting becomes cost-effective over time compared with its use in the second-line setting.
Sensitivity analysis
A one-way deterministic sensitivity analysis was performed by varying all parameters across the plausible ranges shown in Table 1. In the Japanese analysis, the result was robust to the changes in all parameters except for the withdrawal rate of second-line therapy in the GRIFFIN model (supplemental Table 7). D-RVd was less cost-effective than RVd if >46% of the patients withdrew from second-line therapy. In all other analyses, the conclusion of dominance of first-line daratumumab was robust to changes in all parameters (supplemental Tables 8-10). For the use of daratumumab to no longer be cost-effective in the first-line setting, its price would need to be higher than ¥1 190 063 ($10 348) in Japan and $18 546 in the US for the GRIFFIN model, and ¥1 706 828 ($14 841) in Japan and $23 990 in the United States for the CASSIOPEIA model, which is 2 to 3 times the current price.
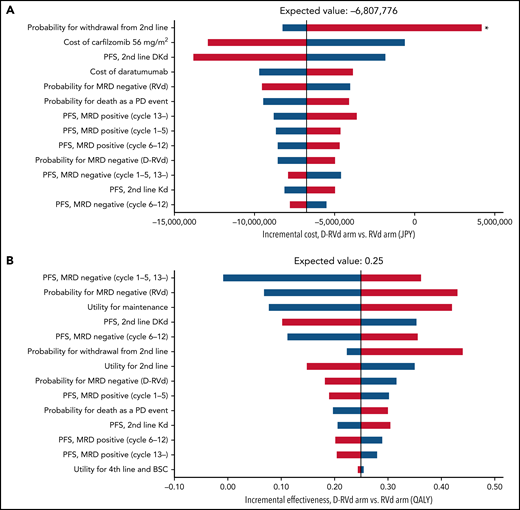
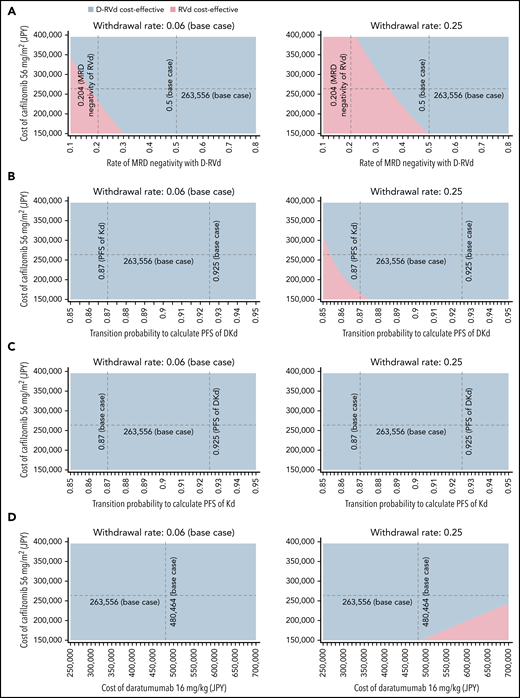
Tornado diagrams of the incremental costs and effectiveness for the Japanese analysis of the GRIFFIN trial are illustrated in Figure 5. The only parameter that may reverse the conclusion of dominance of D-RVd over RVd was the withdrawal rate from second-line treatment. Other parameters that may potentially impact the incremental cost were the cost of carfilzomib and the PFS of second-line treatment (Figure 5). Therefore, we performed a 3-way sensitivity analysis including these parameters and other clinically important parameters related to daratumumab (Figure 6). With the base-case withdrawal rate from second-line treatment, D-RVd was more cost-effective than RVd in most areas regardless of other parameters. Assuming that 25% of the patients withdraw from second-line treatment, decreased MRD-negativity of D-RVd, cost of carfilzomib, and PFS of DKd, and increased cost of daratumumab were associated with improved cost-effectiveness of RVd compared with D-RVd. Similar analyses were conducted using the CASSIOPEIA model, and D-VTd was shown to be cost-effective compared with VTd in most areas (supplemental Figures 4 and 5).
Tornado diagram of one-way sensitivity analysis of the GRIFFIN model (Japanese analysis). (A) Incremental cost and (B) incremental effectiveness of D-RVd vs RVd. Red bars represent changes in values when parameters were varied from base case to higher uncertainty value. Blue bars represent changes in values when parameters were varied from base case to lower uncertainty value. Only parameters that produce >¥1 000 000 change in costs and 0.01 QALY change in effectiveness were included in the diagram. *Probability of withdrawal from second-line treatment was the only parameter that may reverse the incremental cost of D-RVd vs RVd.
Tornado diagram of one-way sensitivity analysis of the GRIFFIN model (Japanese analysis). (A) Incremental cost and (B) incremental effectiveness of D-RVd vs RVd. Red bars represent changes in values when parameters were varied from base case to higher uncertainty value. Blue bars represent changes in values when parameters were varied from base case to lower uncertainty value. Only parameters that produce >¥1 000 000 change in costs and 0.01 QALY change in effectiveness were included in the diagram. *Probability of withdrawal from second-line treatment was the only parameter that may reverse the incremental cost of D-RVd vs RVd.
Sensitivity analysis. Three-way sensitivity analysis varying the cost of carfilzomib, withdrawal rate from second-line treatment, and (A) rate of MRD-negativity with D-RVd, transition probability to calculate PFS of (B) DKd and (C) Kd, and (D) cost of daratumumab. Two withdrawal rates, 0.06 (base case) and 0.25 (25% of the patients withdraw from treatment without receiving second-line), were analyzed. Blue and red areas indicate that D-RVd and RVd are cost-effective within those values, respectively. Dashed black lines indicate the base case or other clinically important values.
Sensitivity analysis. Three-way sensitivity analysis varying the cost of carfilzomib, withdrawal rate from second-line treatment, and (A) rate of MRD-negativity with D-RVd, transition probability to calculate PFS of (B) DKd and (C) Kd, and (D) cost of daratumumab. Two withdrawal rates, 0.06 (base case) and 0.25 (25% of the patients withdraw from treatment without receiving second-line), were analyzed. Blue and red areas indicate that D-RVd and RVd are cost-effective within those values, respectively. Dashed black lines indicate the base case or other clinically important values.
We also performed several alternative clinical scenario analyses (supplemental Tables 11 and 12). Assuming that both the D-RVd arm and the RVd arm received DKd as the second-line treatment, D-RVd showed improved QALY but with higher costs compared with RVd with ICER of ¥11 851 129 ($103 053) per QALY in Japanese analysis and $181 491 per QALY in US analysis, not meeting WTP threshold. However, D-VTd remained more cost-effective than VTd even in this setting in the CASSIOPEIA model. Furthermore, D-VTd remained more cost-effective than VTd in analysis with alternative model, D-VTd plus D maintenance vs VTd plus observation-only, and second-line DRd.
The results were also robust to change in dosing schedule of carfilzomib to 70 mg/m2 weekly from 56 mg/m2 twice weekly. In subcutaneous administration of daratumumab, changes in third- and fourth-line treatment had minimal effects on the cost-effectiveness in both the GRIFFIN and the CASSIOPEIA models.
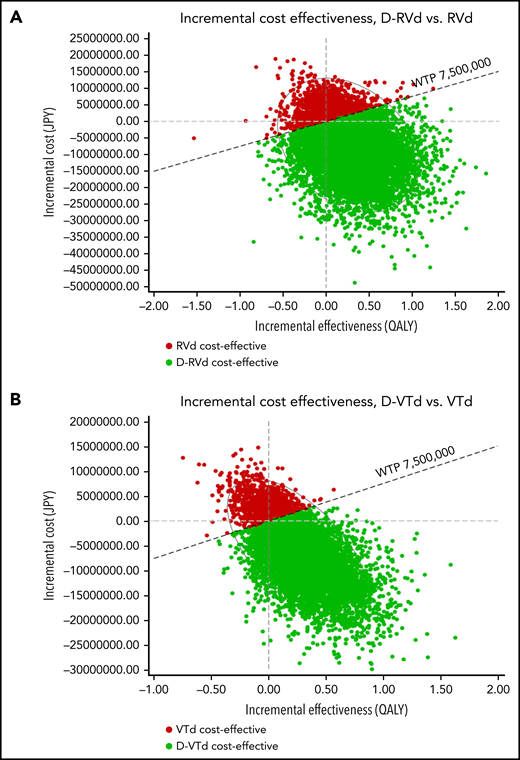
In the PSA for Japanese analysis of the GRIFFIN model using a Monte Carlo simulation with 10 000 trials, 75.5% of iterations showed that D-RVd was superior to RVd with lower cost and higher effectiveness; 3.9% of iterations showed ICERs below the WTP threshold; 15.1% of iterations showed ICERs above the WTP threshold; and 5.6% of iterations showed that D-RVd was inferior to RVd, with higher cost and lower effectiveness. In the CASSIOPEIA model, 77.7% of iterations showed that D-VTd was superior to VTd with lower cost and higher effectiveness; 3.4% of iterations showed ICERs below the WTP threshold; 12.7% of iterations showed ICERs above the WTP threshold; and 6.2% of iterations showed that D-VTd was inferior to VTd, with higher cost and lower effectiveness (Figure 7). The results were similar for US analysis (supplemental Figure 6).
Scatterplot of PSA for the Japanese analysis. Results for (A) GRIFFIN and (B) CASSIOPEIA model. Red and green dots represent iterations in which RVd and D-RVd were cost-effective, respectively.
Scatterplot of PSA for the Japanese analysis. Results for (A) GRIFFIN and (B) CASSIOPEIA model. Red and green dots represent iterations in which RVd and D-RVd were cost-effective, respectively.
Discussion
In this study, we performed a cost-effectiveness analysis to compare first-line and second-line use of daratumumab in transplant-eligible patients with NDMM. To our knowledge, this is the first study to clearly show the cost-effectiveness of daratumumab in transplant settings. First-line use of daratumumab dominated second-line use of daratumumab with higher QALY and higher costs at the start but lower costs overall.
Because long-term survival outcome with D-RVd has not been reported, we assumed that MRD at the end of consolidation predicts PFS. Our model was constructed based on the report by Perrot et al, which describes the survival of patients enrolled in the IFM 2009 trial according to the MRD status with a threshold of 10−6. The simulated OS with RVd of 65% at 96 months was very close to recent long-term follow-up data from the IFM 2009 trial, which was reported to be 62.2% at 8 years for the transplant arm.37 On the other hand, few data are available regarding long-term survival with D-RVd. In a safety run-in cohort of D-RVd preceding the randomized phase of the GRIFFIN trial, PFS and OS at 36 months were 78.1% and 93.8%, respectively.2 According to the most recent update of the GRIFFIN trial at the American Society of Hematology annual meeting in 2021, PFS at 36 months for the D-RVd and RVd arms were 88.9% and 81.2%, respectively.5 Our estimation for D-RVd was very close in OS (92.2% at 36 months) but lower in PFS (70.9% at 36 months). This could be partly explained by the duration of maintenance therapy, which was continued for 24 months in the GRIFFIN trial but stopped at 12 months in the IFM 2009 trial.
We also performed cost-effectiveness analysis of D-VTd vs VTd, using the MRD-based model described above, and the alternative model based on the follow-up data of the CASSIOPEIA trial.4 Both models showed that first-line daratumumab was also cost-effective in combination with VTd. Although this study did not aim at comparing the GRIFFIN and CASSIOPEIA model, the cost of the latter was considerably lower. This seemed to have resulted from a difference in costs for maintenance therapy, rather than a difference in costs of lenalidomide and thalidomide (supplemental Tables 5 and 6). The cost-effectiveness of daratumumab in maintenance is an important issue to be explored, given the promising results of daratumumab maintenance in the CASSIOPEIA trial.4
Because this is a hypothetical model, this study has several limitations. First, we hypothesized that PFS was defined by the MRD status regardless of the contents of maintenance therapy. However, the addition of daratumumab could further improve PFS during maintenance. Furthermore, the duration of maintenance therapy would affect PFS, as mentioned previously.
Second, we did not include the timing or the quality of MRD negativity in the model. Patients who are MRD+ at the start but MRD− at the end of maintenance have been reported to show survival similar to that in patients who are MRD− both at the start and at the end of maintenance.11 Regarding methods for MRD measurement, we used MRD data from the IFM 2009 trial, which used NGS with a 10−6 threshold, and the GRIFFIN trial, which used NGS with a 10−5 threshold, because of the availability of survival data. These choices may have resulted in changes in the values of MRD negativity and were considered in the sensitivity analysis with wide plausible ranges.
Third, although numerous regimens are now available for RRMM, the model assumed that all patients would receive uniform treatment. The content of treatment after relapse may alter the result of the cost-effectiveness analysis. Our deterministic sensitivity analyses showed that results are most sensitive to survival and the costs of second-line treatment. As the second-line treatment, we chose DKd for the second-line daratumumab arm and Kd (KRd for the CASSIOPEIA model) for the first-line daratumumab arm to illustrate the cost-effectiveness of “using daratumumab in the first-line or the second-line,” an important clinical question which Patel et al explored in a nontransplant setting.13 Although it seems reasonable to avoid DKd right after daratumumab maintenance, re-treatment with daratumumab may be possible for patients who are daratumumab-free for >6 months. Assuming DKd as second-line treatment for both treatment arms, first-line daratumumab turned out to be less cost-effective than second-line treatment in the GRIFFIN model. Regarding the costs, DKd was particularly costly, because it was continued until progression. The truncated use or maintenance with lower dose in DKd may alter the results of cost-effectiveness analysis, but such strategies have not been investigated in clinical trials. We excluded IsaPd (isatuximab, pomalidomide, and dexamethasone)31 and IsaKd (isatuximab, carfilzomib, and dexamethasone),38 regimens containing CD38-targeting antibody, from second-line treatment. We also evaluated various regimens for third- and fourth-line treatment, which had minimal effects on the results. We did not include anti-BCMA CAR39,40 for salvage treatment because access to the treatment is limited and clinical outcomes would be complex and heterogeneous. We also included patients who do not proceed to second-line treatment or beyond because of poor performance status, age, or the patient’s preference. Although the results were most sensitive to the withdrawal rate from the second-line therapy, the cost-effectiveness of D-RVd remained unchanged unless 46% of the patients withdraw from the second-line treatment. Real-world patients with RRMM may be treated less intensively than in our model, particularly in resource-poor settings. However, we thought that the treatment intensity in the current model was reasonable for medically fit patients who can tolerate multiagent chemotherapy and ASCT.
Fourth, we did not consider individual patient characteristics such as R-ISS or individualized therapy guided by the presence of high-risk cytogenetic abnormalities. However, it is notable that daratumumab was still cost-effective in our models based on the data of the IFM 2009, GRIFFIN, and CASSIOPEIA trials, in which most of the patients showed standard cytogenetic risk.
In conclusion, we developed a Markov model that closely simulates survival and costs over 10 years for transplant-eligible patients with NDMM with or without daratumumab. Unlike those used in previous studies, our model showed that introduction of daratumumab in first-line therapy was cost-effective even under current pricing. Delaying costly second-line treatment appears to be the key to cost-effectiveness.
Acknowledgment
This research received no specific grant from any funding agency in the public, commercial, or not-for-profit sectors.
Authorship
Contribution: C.Y. wrote the paper; C.Y., D.M., and Y.K. designed the research; S.K., K. Sekiguchi, Y.F., R.M., H. Nakashima, S.M., T.I., S.-i.K., Y.T., S.I., T.N., K.U., H. Nakano, K.M., R.Y., M.A., M.U., K.H., K. Sato, S.-i.F., and K.O. collected and analyzed data.
Conflict-of-interest disclosure: M.A. received speaking fees from the Novartis. M.U. received speaking fees from Janssen, Ono Pharma, Sanofi, Takeda, and BMS. S.-i.F. received honoraria from Novartis, Janssen, Sanofi, and Takeda. K.O. is an advisor for Ono and Janssen and received speaking fees from Novartis and Ono. Y.K. received honoraria from Novartis, Janssen, Ono Pharma, Sanofi, Takeda, and BMS. The remaining author declares no competing financial interests.
Correspondence: Yoshinobu Kanda, Division of Hematology, Department of Medicine, Jichi Medical University, 3311-1 Yakushiji, Shimotsuke, Tochigi, Japan 3290498; e-mail: ycanda-tky@umin.ac.jp.
Requests for data may be made by contacting the corresponding author, Yoshinobu Kanda, at ycanda-tky@umin.ac.jp.
The online version of this article contains a data supplement.
There is a Blood Commentary on this article in this issue.
The publication costs of this article were defrayed in part by page charge payment. Therefore, and solely to indicate this fact, this article is hereby marked “advertisement” in accordance with 18 USC section 1734.

This feature is available to Subscribers Only
Sign In or Create an Account Close Modal