Key Points
Disruption of nSMase-2 alters EV biogenesis and activates an adaptive ISR in HSPCs.
Brief ex vivo pharmacological inhibition of nSMase-2 durably enhances long-term repopulation capacity.
Abstract
Hematopoietic stem and progenitor cell (HSPC) transplantation serves as a curative therapy for many benign and malignant hematopoietic disorders and as a platform for gene therapy. However, growing needs for ex vivo manipulation of HSPC-graft products are limited by barriers in maintaining critical self-renewal and quiescence properties. The role of sphingolipid metabolism in safeguarding these essential cellular properties has been recently recognized, but not yet widely explored. Here, we demonstrate that pharmacologic and genetic inhibition of neutral sphingomyelinase 2 (nSMase-2) leads to sustained improvements in long-term competitive transplantation efficiency after ex vivo culture. Mechanistically, nSMase-2 blockade activates a canonical integrated stress response (ISR) and promotes metabolic quiescence in human and murine HSPCs. These adaptations result in part from disruption in sphingolipid metabolism that impairs the release of nSMase-2–dependent extracellular vesicles (EVs). The aggregate findings link EV trafficking and the ISR as a regulatory dyad guarding HSPC homeostasis and long-term fitness. Translationally, transient nSMase-2 inhibition enables ex vivo graft manipulation with enhanced HSPC potency.
Introduction
Hematopoietic stem and progenitor cell (HSPC) transplantation is a therapeutic strategy to cure benign and malignant hematopoietic pathologies, which relies upon HSPCs to reconstitute a clonally diverse blood and immune system. Autologous transplantation has also emerged as a powerful platform for gene addition and editing strategies to treat monogenic hematopoietic diseases, including bone marrow (BM) failure, hemoglobinopathies, and storage disorders.1
With rising interest in these novel therapies, short-term ex vivo HSPC culture systems have taken on a central role in expansion, manipulation, and screening of therapeutic grafts.1 However, ex vivo expansion needs to reconcile maintenance of stemness properties, including self-renewal, quiescence, and pluripotency with mitotic growth and stem cell exhaustion.2,3 Because any loss of fitness during culture poses inherent risk of graft failure or oligoclonal reconstitution, deeper understanding of cell-intrinsic programming and extrinsic signals governing HSPC fate is essential.4-7
Efforts to optimize ex vivo culture have predominantly focused on supplementation of extrinsic factors to promote HSPC expansion.1 These strategies parallel research uncovering niche signals received by BM HSPCs.7 However, cell-intrinsic factors are crucial during self-renewal through coordination of cell cycle, proteostasis, secretory function, and metabolism. In particular, ceramide has been identified as a key modulator of cell survival and forms the backbone of complex sphingolipids implicated in HSPC self-renewal.8-11 In human HSPCs, pharmacologic or genetic dysregulation of dihydroceramide desaturase (DEGS1) which converts dihydroceramide to ceramide promotes autophagy and a coordinated stress response enhancing self-renewal.10 Modulation of sphingosine metabolism also augments HSPC fitness by improving response to hypoxic insult.11 However, exact molecular mechanisms underlying adaptive stress response by specific sphingolipid species are yet to be fully uncovered, and similar regulatory pathways have also not been validated in murine models. Moreover, how the role of DEGS1 activity in promotion of extracellular vesicle (EV) production, including through its inhibitory role in autophagic degradation of multivesicular bodies,12 affects the observed benefit in hematopoietic stem cell (HSC) function remains unclear.
Multiple biosynthetic pathways converge on ceramide, with DEGS1-mediated de novo production accounting for only a subset.13 Encoded by SMPD3, neutral sphingomyelinase 2 (nSMase-2) hydrolyzes sphingomyelin (SM) to additionally regulate sphingolipid levels.14-16 In the endolysosomal sorting system, nSMase-2 plays a well-described role in ceramide production guiding lipid bilayer pliancy and intraluminal vesicle budding before EV secretion.17-19 The small molecule GW4869 is a noncompetitive inhibitor of nSMase-2, with broadly described impacts on EV secretion.
Adding to growing knowledge surrounding lipid-mediated signaling and homeostatic regulation in HSPCs, here we target nSMase-2. We demonstrate nSMase-2 inhibition results in distinct regulation of quiescence and integrated stress response (ISR) initiated by transient increases in reactive oxygen species (ROS). In part, disruption of cell secretory function underlies these outcomes, a finding congruent with described roles of EVs as mediators of HSPC survival, proliferation, and aging.7,20 Ultimately, we demonstrate an adaptive mechanism downstream of nSMase-2 inhibition that promotes acquisition of homeostatic HSPC properties during ex vivo culture and durable improvements in long-term hematopoietic reconstitution. Translationally, these findings offer a possible novel strategy to safeguard HSPC stemness and regenerative capacity of graft products during ex vivo maintenance and expansion.
Methods
Animals
Animal experiments were approved by the Children’s Hospital of Philadelphia Institutional Animal Care and Use Committee and conducted in accordance with the National Institutes of Health’s Guide for the Care and Use of Laboratory Animals. Please refer to supplemental Methods, available on the Blood website for details.
HSPC enrichment and culture
Mouse BM cells were collected for HSPC enrichment after euthanizing animals. Human HSPCs were enriched from deidentified human leukapheresis products obtained from the University of Pennsylvania Hematopoietic Stem Cell Laboratory under approval of the University of Pennsylvania Institutional Review Board. Please refer to supplemental Methods for details.
Results
Transient inhibition of nSMase-2 improves transplantation after ex vivo expansion
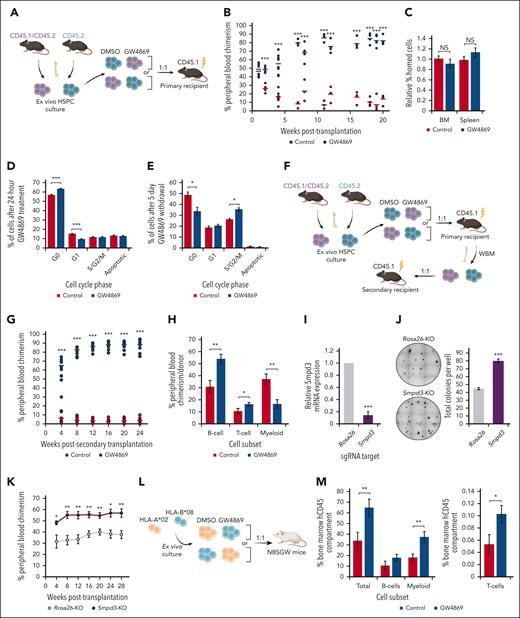
Murine polyvinyl alcohol–based expansion cultures were initiated from BM long-term HSCs (LT-HSCs; Lin− Sca-1+ c-Kit+ CD150+ CD48−)21 (supplemental Figure 1A-B). Given the complex sphingolipid regulation of HSPC fitness, we evaluated the impact of pharmacological nSMase-2 inhibition with GW4869 on posttransplantation reconstitution (Figure 1A). Strikingly, GW4869-treated donor HSPCs (HSPCGW) repopulation outcompeted controls (HSPCCon; more than eightfold at steady-state, P < .001) (Figure 1B), without variance in BM or splenic homing (Figure 1C). At 20 weeks after transplantation, HSPCGW showed relatively increased MPP3 (Lin−Sca-1+c-Kit+CD150−CD48+) population (P < .05), without impact on other subpopulations (supplemental Figure 1C). Accordingly, increased BM Gr-1+ myeloid cells (P < .01) and decreased BM and peripheral blood CD3+ T cells were seen (P < .05) (supplemental Figure 1D-E). No difference was seen in proportions of mature cells in the spleen (supplemental Figure 1F).
Inhibition of nSMase-2 improves long-term transplantation outcomes after ex vivo expansion. (A) Schematic of primary competitive transplantation experiment into lethally irradiated CD45.1 recipient mice (n = 8) using ex vivo cultured GW4869-treated cells (HSPCGW) vs dimethyl sulfoxide (DMSO)–treated cells (HSPCCon). (B) Relative in vivo chimerism over time after competitive transplantation of ex vivo cultured HSPCGW vs HSPCCon. (C) BM and spleen homing analysis of lethally irradiated recipients at 20 hours after HSPC injection. Flow cytometric–based Ki-67/PI cell-cycle analysis of murine HSPCs at (D) 24 hours or (E) 6 days after initiation of 24-hour GW4869 treatment. (F) Schematic of serial (secondary) competitive transplantation experiment into lethally irradiated recipient mice (n = 12). (G) Relative chimerism after serial whole–BM transplantation of primary recipients. (H) Relative proportions of mature lineage cells within each donor compartment in peripheral blood at 28 weeks after secondary transplantation. (I) Relative gene expression of Smpd3 in Cas9/RNP-mediated KO compared with control (Rosa26-KO) cells. (J) Representative methylcellulose colony–forming assays performed after Smpd3-KO in murine HSPCs and total colony quantification. (K) Relative chimerism measured over weeks after competitive transplantation of Smpd3-KO vs Rosa26-KO murine HSPCs (n = 6). Schematic of xenografted NBSGW mice with HLA-mismatched human HSPCs (L), and BM chimerism measured at 6 weeks after transplantation (n = 10) (M). ∗P < .05; ∗∗P < .01; ∗∗∗P < .001; NS, nonsignificant. Refer to supplemental Figure 1.
Inhibition of nSMase-2 improves long-term transplantation outcomes after ex vivo expansion. (A) Schematic of primary competitive transplantation experiment into lethally irradiated CD45.1 recipient mice (n = 8) using ex vivo cultured GW4869-treated cells (HSPCGW) vs dimethyl sulfoxide (DMSO)–treated cells (HSPCCon). (B) Relative in vivo chimerism over time after competitive transplantation of ex vivo cultured HSPCGW vs HSPCCon. (C) BM and spleen homing analysis of lethally irradiated recipients at 20 hours after HSPC injection. Flow cytometric–based Ki-67/PI cell-cycle analysis of murine HSPCs at (D) 24 hours or (E) 6 days after initiation of 24-hour GW4869 treatment. (F) Schematic of serial (secondary) competitive transplantation experiment into lethally irradiated recipient mice (n = 12). (G) Relative chimerism after serial whole–BM transplantation of primary recipients. (H) Relative proportions of mature lineage cells within each donor compartment in peripheral blood at 28 weeks after secondary transplantation. (I) Relative gene expression of Smpd3 in Cas9/RNP-mediated KO compared with control (Rosa26-KO) cells. (J) Representative methylcellulose colony–forming assays performed after Smpd3-KO in murine HSPCs and total colony quantification. (K) Relative chimerism measured over weeks after competitive transplantation of Smpd3-KO vs Rosa26-KO murine HSPCs (n = 6). Schematic of xenografted NBSGW mice with HLA-mismatched human HSPCs (L), and BM chimerism measured at 6 weeks after transplantation (n = 10) (M). ∗P < .05; ∗∗P < .01; ∗∗∗P < .001; NS, nonsignificant. Refer to supplemental Figure 1.
To determine the impact of GW4869 on proliferation ex vivo, cell-cycle profiles were analyzed, showing a majority of cells in G0 cell-cycle phase, even in ex vivo cytokine-supplemented medium (supplemental Figure 1G). After 24-hour GW4869 treatment, HSPCGW showed gains in quiescence that reversed by 5 days after drug removal (Figure 1D-E). Short-term ex vivo cultures were also established for human HSPCs using CD34+ cells from granulocyte colony-stimulating factor (CSF)−mobilized leukapheresis (supplemental Figure 1H). Cytokine-supplemented cultures maintained >75% CD34+ cells for 10 days, demonstrating immature morphology and colony-forming potential (supplemental Figure 1I-K). Similar trends in cell-cycle entry were observed in human HSPCGW (supplemental Figure 1L). Human HSPCGW showed increased colony-forming potential, particularly 5 days after drug withdrawal (P < .05) (supplemental Figure 1M). These data suggest that blockade of nSMase-2 suspends HSPC cell cycling, preserving clonogenicity ex vivo.
Eventual increase in cell-cycle entry and the remarkable surge in long-term chimerism after transient ex vivo GW4869 treatment led us to test whether HSPCGW reach an exhaustive state. Surprisingly, HSPCGW amplified regenerative outgrowth (>20-fold at steady-state, P < .001) (Figure 1F-G). At 28 weeks after serial transplantation, HSPCGW demonstrated relative increase in lymphoid:myeloid repopulation (Figure 1H), supporting long-term suppression of myeloid bias without LT-HSC depletion (supplemental Figure 1N). Transplantation of GW4869-treated Lin− cells after brief (24 hours) ex vivo culture showed short-term delays in repopulation at 4 weeks (P < .05) that resolved after 8 weeks, appeared to reverse after 30 weeks, and were not apparent after secondary transplantation (supplemental Figure 1O). After ex vivo expansion, HSPCGW similarly outcompeted equal starting numbers of fresh LT-HSC in lethally irradiated mice (supplemental Figure 1P). Of note, ex vivo–expanded HSPC showed low-level engraftment (<2%) into nonirradiated recipient mice regardless of treatment (supplemental Figure 1Q).
Cas9-directed knockout (KO) of Smpd3/SMPD3 resulted in increased colony-forming capacity of murine and human HSPCs in methylcellulose assays (P < .05) (Figure 1I-J; supplemental Figure 1R). Similar to GW4869 treatment, enhanced repopulation was seen from Smpd3-KO murine HSPCs, with an average 1.5-fold change (FC) increase over Rosa26-KO HSPCs at steady-state (Figure 1K). Similarly, competitive transplantation of HLA-mismatched human HSPCs into B6.SCID Il2rgamma(-/-)Kit(W41/W41) (NBSGW) mice revealed gains in HSPCGW fitness across donor cells, despite a strong independent HLA effect on engraftment (Figure 1L-M; supplemental Figure 1S). The combined data support a long-lasting impact of nSMase-2 inhibition on ex vivo–expanded grafts for preconditioned transplantation.
Sphingomyelinase activity regulates HSPC composition
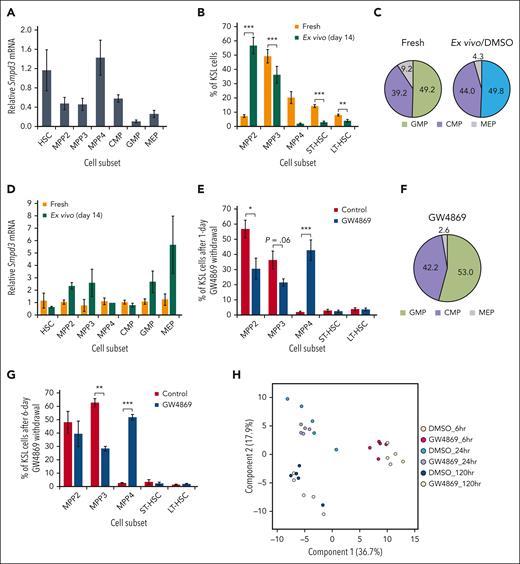
Given striking impacts on repopulation, we aimed our focus on subpopulation-specific differences in sphingomyelinase activity. Prior transcriptomic data had suggested differential expression of SMPD3 within HSPC subsets10,22; however, in our study only variable and nonsignificant differences were seen in Smpd3 or Smpd2 transcript levels across freshly isolated stem and progenitor cells (Figure 2A; supplemental Figure 2A-B). Ex vivo expansion enriched for MPP2 (Lin−Sca-1+c-Kit+CD150+CD48+) at the expense of relative proportions of HSC and megakaryocyte-erythroid precursors (MEP; Lin−Sca-1-cKit+CD34−CD16−CD32−) (Figure 2B-C); however, absolute numbers of all HSPC subpopulations were increased given the >5000-fold expansion (supplemental Figure 1B), with exception of MPP4 (Lin−Sca-1+c-Kit+CD150−Flk2+) and MEP. Despite lack of significant differences in Smpd3 expression after 14 days in culture (Figure 2D), 24-hour GW4869 treatment had a differential effect on HSPC composition resulting in increased lymphoid-primed MPP4 (P < .001) and decreased myeloid-primed MPP2 (P < .01) and MPP3 (P = .06) (Figure 2E-F). No differences in short-term (ST)–HSC (Lin−Sca-1+c-Kit+CD150−CD48−) or LT-HSC proportions were seen. Effects on MPP3 and MPP4 populations persisted 6 days after drug removal (Figure 2G), indicating that nSMase-2 inhibition suppresses outgrowth of myeloid-primed multipotent progenitors in ex vivo expansion culture.
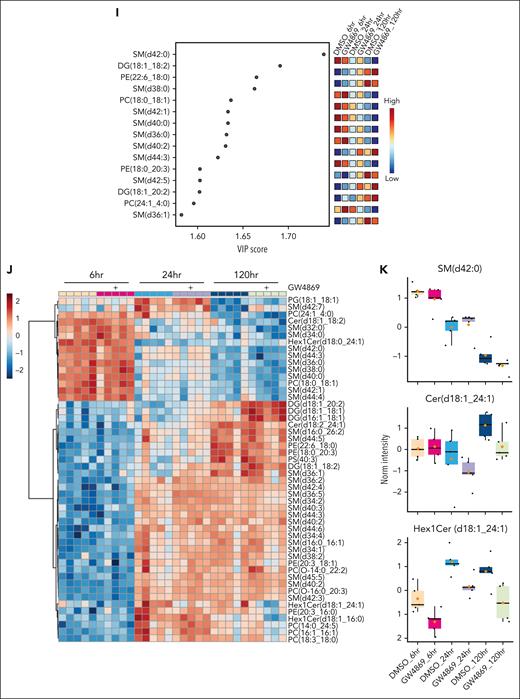
Neutral sphingomyelinase activity regulates HSPC pool composition. (A) Relative Smpd3 gene expression across murine HSPC subpopulations in vivo. HSC and MPP (B), oligopotent progenitor proportions (C), and relative Smpd3 gene expression (D) after 14-day ex vivo culture. HSC and MPP (E) or oligopotent progenitor proportions in ex vivo culture 1 day after 24-hour GW4869 treatment (F). (G) HSC and MPP proportions 7 days after 24-hour GW4869 treatment. PLS-DA plot (H), variable importance in projection (VIP) plot (I), and heat map of top 50 differentially expressed lipids across HSPCs after GW4869 treatment (J). (K) Exemplary SM, ceramide (Cer), and hexosylceramide (Hex1Cer) levels in HSPCs over time. Refer to supplemental Figure 2.
Neutral sphingomyelinase activity regulates HSPC pool composition. (A) Relative Smpd3 gene expression across murine HSPC subpopulations in vivo. HSC and MPP (B), oligopotent progenitor proportions (C), and relative Smpd3 gene expression (D) after 14-day ex vivo culture. HSC and MPP (E) or oligopotent progenitor proportions in ex vivo culture 1 day after 24-hour GW4869 treatment (F). (G) HSC and MPP proportions 7 days after 24-hour GW4869 treatment. PLS-DA plot (H), variable importance in projection (VIP) plot (I), and heat map of top 50 differentially expressed lipids across HSPCs after GW4869 treatment (J). (K) Exemplary SM, ceramide (Cer), and hexosylceramide (Hex1Cer) levels in HSPCs over time. Refer to supplemental Figure 2.
Given the central role of nSMase-2 in lipid metabolism, we undertook lipidomic profiling of HSPCGW. Somewhat surprisingly, we observed neither global ceramide depletion nor SM accumulation (Figure 2H-J; supplemental Figure 2C-D). However, of lipid alterations measured in HSPCGW over time, the accumulation of specific SM species appeared to drive major differences. In particular, SM (d42:0) was identified as an important component of differential HSPC lipidomes, with decreasing levels over time and isolated accumulation in HSPCGW at 24 hours (Figure 2I-K). Ceramide to SM ratios for 42:2 species demonstrated the greatest perturbation after nSMase-2 inhibition, with Cer (d42:2) and Hex1Cer (d42:2) species showing time-dependent decreases in HSPCGW (Figure 2K; supplemental Figure 2E-F). These findings highlight the complexity of sphingolipid synthesis and implicate additional potent cellular processes regulating HSPC fitness downstream of transient lipid remodeling.
Single-cell RNA sequencing of murine HSPCGW reveals mitochondrial and protein translation alterations
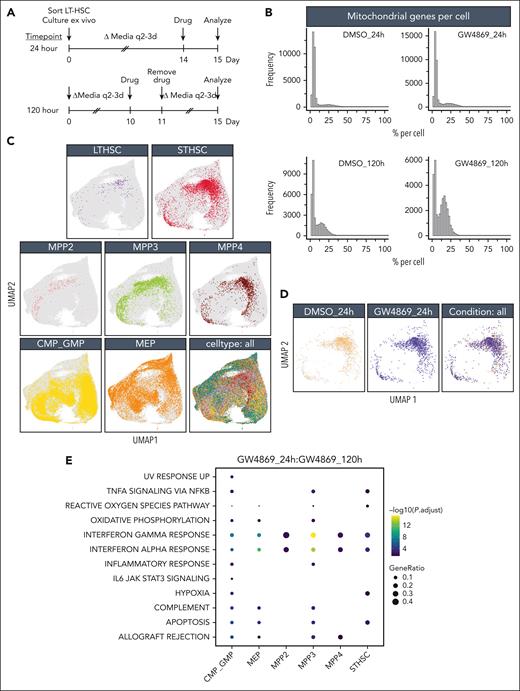
To assess impacts of nSMase-2 blockade on heterogenous HSPC subsets, single-cell RNA sequencing was performed immediately or 5 days (120 hours) after GW4869 treatment and live-cell sort (Figure 3A). Mitochondrial and total gene transcripts were elevated in a subset of HSPCGW at the 24-hour time point, with further elevation at 120 hours (Figure 3B). Given the strong treatment effect, and enhanced functional outcome of HSPCGW, this was favored to reflect biologic differences rather than poor viability.
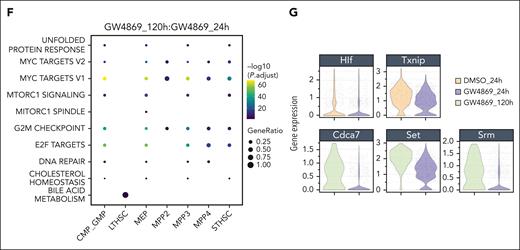
Single-cell transcriptomic analysis reveals altered mitochondrial and protein translation signatures in murine HSPCs. (A) Timeline of GW4869 (or DMSO) treatment in ex vivo cultured murine HSPCs (n = 3 biologic replicates per treatment/condition) before 10x Genomics single-cell RNA sequencing. (B) Proportions of mitochondrial over total genes sequenced per cell across treatment groups and time points. (C) In silico fluorescence-activated cell sorter–like annotations of stem and progenitor cell populations identified across conditions in single-cell RNA sequencing analyses. (D) Uniform manifold approximation and projections of ST-HSCs in HSPCCon and HSPCGW at 24-hour time point. Bubble heatmaps of significant hallmark gene sets enriched in HSPCGW at 24 hours (E) and 120 hours (F). (G) Violin plots of top differentially expressed genes in ST-HSCGW. Refer to supplemental Figures 3 and 4.
Single-cell transcriptomic analysis reveals altered mitochondrial and protein translation signatures in murine HSPCs. (A) Timeline of GW4869 (or DMSO) treatment in ex vivo cultured murine HSPCs (n = 3 biologic replicates per treatment/condition) before 10x Genomics single-cell RNA sequencing. (B) Proportions of mitochondrial over total genes sequenced per cell across treatment groups and time points. (C) In silico fluorescence-activated cell sorter–like annotations of stem and progenitor cell populations identified across conditions in single-cell RNA sequencing analyses. (D) Uniform manifold approximation and projections of ST-HSCs in HSPCCon and HSPCGW at 24-hour time point. Bubble heatmaps of significant hallmark gene sets enriched in HSPCGW at 24 hours (E) and 120 hours (F). (G) Violin plots of top differentially expressed genes in ST-HSCGW. Refer to supplemental Figures 3 and 4.
HSPCGW at 24 hours showed upregulation of viral response and ubiquitin-like protein ligase binding genes and downregulation of myeloid processes (supplemental Figure 3A-B). Positive regulation of protein homeostasis and turnover (Ube2c and Stfa1), ROS response (Hsp90ab1, S100a4, and Ccl5),23 and self-renewal (Tubb5 and Hsp90ab1)23,24 were noted, whereas the apoptotic factor Fos was downregulated in HSPCGW (supplemental Figure 3B). At the 120-hour time point, HSPCGW upregulated cell cycle–related processes (supplemental Figure 3C-D), congruent with time-dependent cell-cycle entry (Figure 1E).
Because previous studies have indicated significant overlap of HSPC subpopulation transcriptomes in uniform manifold approximation and projection (UMAP) space,25,26 a fluorescence-activated cell sorter–like in silico annotation approach was taken (Figure 3C). Similar to others’ observations,26 HSPC subpopulations did not cluster distinctly in UMAP space. LT-HSCs demonstrated relatively high repopulation signature among subpopulations, as previously described,8 with lower scores seen in the most mature myeloid progenitors and no significant differences among treatment groups or time points (supplemental Figure 4A-C). ST-HSCGW demonstrated largely overlapping transcriptomes as ST-HSCCon, but harbored ROS and hypoxia signatures at 24 hours, including upregulation of Ftl1, Gpx4, Ndufa6, Uqcrh, and antiproliferation factor Btg1, whereas mTORC1 and MYC signaling, E2F targets, G2M check point, and ribosomal processes were negatively regulated (Figure 3D-F; supplemental Figure 4E). A prominent interferon response was transiently induced by GW4869 across the majority of subpopulations, with exception of LT-HSC (Figure 3E; supplemental Figure 4D).
Notably, ST-HSCGW showed significant transient downregulation of Hlf, a negative regulator of lymphoid lineage commitment,27 p53 and ROS regulator Txnip,28 notch target Cdca7,29 and Srm, previously described to negatively regulate HSC ex vivo fitness through polyamine synthesis30 (Figure 3G). Of interest, decreases in transcriptional level were noted for Set, a negative regulator of nucleosome acetylation, raising the possibility of its role in long-lasting functional impacts of GW4869.
Oligopotent common myeloid progenitor (CMP)/GMPGW and MEPGW subsets showed distinct transcriptional differences compared with those of MPPGW and ST-HSCGW, predominantly driving the pseudobulk changes observed in mature myeloid process regulation (Figure 3E; supplemental Figure 4E). In contrast, transcriptional changes in LT-HSC were minimal, perhaps because of the quiescent nature and small subset of these cells. A bile acid metabolism signature seen in LT-HSCGW at the late time point (Figure 3F) was driven entirely by ATP-binding cassette transporter Abca4, the significance of which is uncertain given prior data demonstrating its scarce expression in human HSCs.31 Finally, analysis of lipid genes involved in ceramide and sphingolipid biogenesis was performed, highlighting varied expression of many genes at the single-cell level but showing overall uniform trends across major subpopulations (supplemental Figure 4F). Levels of Smpd3, in particular, were unchanged across stem and progenitor subsets. Altogether, these data suggest that posttranslational nSMase-2 inhibition leads to transient changes in cell-cycle entry, ribosomal synthesis, and lineage fate across ST-HSC, MPP, and oligopotent progenitors with global impacts on mitochondrial function and metabolic state.
Blockade of nSMase-2 impairs mitochondrial cargo export
Intracellular processes are, in part, driven by consequences of cellular secretion, through export of signaling components or through autocrine loops.32,33 Given the known role of nSMase-2 in secretory activity via intraluminal vesicle and EV biogenesis, we postulated that GW4869 would disrupt the functional HSPC secretome. Owing to limitations in material for large-scale vesicle characterization from murine HSPCs, we turned to ex vivo–expanded human CD34+ cells. GW4869 treatment resulted in depletion of all tested EV biomarkers and over two-fold reduction in vesicle release from HSPCs, with secretory rebound 10 hours after drug removal (supplemental Figure 5A-E).
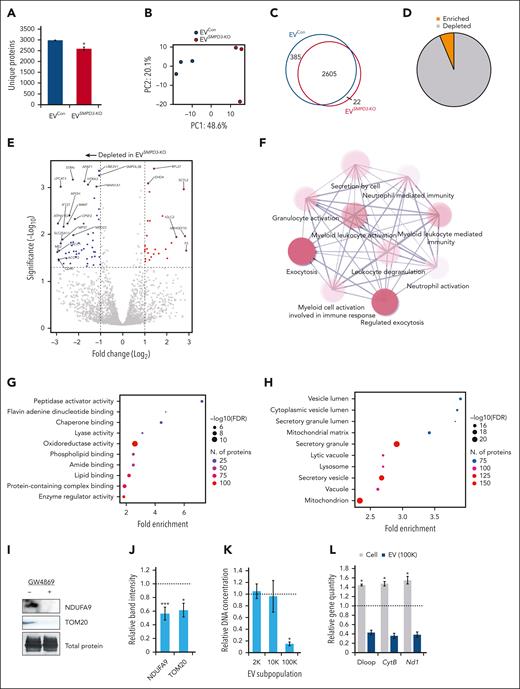
Quantitative mass spectrometry was performed on EVs derived from human SMPD3-KO HSPCs (EVSMPD3-KO) compared with control HSPCs with Cas9 and single-guide RNA targeting the AAVS1 locus (EVCon). Reduced numbers of unique proteins were identified on average in EVSMPD3-KO (n = 2972) compared with EVCon (n = 2591) (P < .05) (Figure 4A). EVSMPD3-KO demonstrated a distinct proteome (Figure 4B) with 385 proteins identified only in EVCon (Figure 4C) and numerous proteins depleted in EVSMPD3-KO (Figure 4D-E). EVSMPD3-KO showed reduced levels of myeloid activating factors (Figure 4F), including granulocytic and macrophage CSF)1R (FC = −0.83, P.adj < .05) and CSF2RA (FC = −0.90, P.adj < .05) as well as myeloid-associated transcription factor PU.1 (FC = −2.0, P.adj < .05) (supplemental Figure 5F). In contrast, stemness factors thrombopoietin and arginase-1 were increased in EVSMPD3-KO compared with that in EVCon (FC = 2.2, P.adj < .05) (supplemental Figure 5F). These findings point to possible mechanisms of HSPC autocrine feedback loops that promote self-renewal and suppress myeloid bias.34-37 Additional pathway analyses performed on depleted proteins in EVSMPD3-KO compared with those in EVCon demonstrated deficits in secretion of proteins involved in oxidoreductase (false discovery rate [FDR] = 2.8E−12) and lipid binding functions (FDR = 7.3E−07), metabolic pathways (FDR = 2.0E−33), and secretory vesicles (FDR = 4.5E−20) (Figure 4G-H; supplemental Figure 5G). Strikingly, depleted proteins were mitochondrial-associated proteins (FDR = 8.3E−22) (Figure 4H), consistent with depletion of oxidoreductase and metabolic functions. Reduced secretion of mitochondrial proteins NDUFA9 and TOM20 were confirmed in HSPCGW EV (P < .001 and P < .05) (Figure 4I-J).
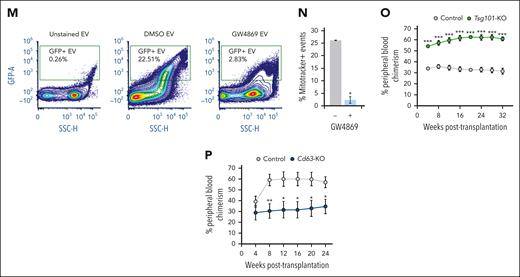
Blockade of nSMase-2 results in mitochondrial export deficits. (A) Average total number of unique proteins identified by quantitative LC-MS/MS of EVs derived from SMPD3-KO (EVSMPD3-KO, n = 3) vs AAVS1-KO (EVCon, n = 3) human CD34+ cells. (B) Principal component analysis (PCA) plot of vesicle proteomes. (C) Overlap in unique proteins identified in EVSMPD3-KO and EVCon. (D) Proportions and (E) volcano plot of depleted and enriched proteins differentially abundant in EVSMPD3-KO compared with EVCon. The dotted horizontal line represents −log10(P = .05). (F) String analysis of protein-protein networks depleted in EVSMPD3-KO. Gene ontology analysis of the (G) molecular function or (H) cell compartment of proteins significantly depleted in EVSMPD3-KO. (I) Representative immunoblot analysis and (J) quantitation of mitochondrial proteins depleted in EVs derived from HSPCGW, equal volume loaded. (K) Total DNA extracted from HSPCGW vesicles after 2000g (2K), 10 000g (10K), or 100 000g (100K) centrifugations; the dotted line indicates average normalized EV DNA extracted from HSPCCon vesicles. (L) Relative copy number of mtDNA regions per genes in cells and 100K vesicles after GW4869 treatment; dotted line represents normalized controls. Representative fluorescence-activated cell sorter plots (M) and quantification of MitoTracker staining in 100K vesicles (N). Relative chimerism measured over weeks after competitive transplantation of Tsg101-KO (n = 8) (O) or Cd63-KO (n = 7) (P) vs Rosa26-KO murine HSPCs (n = 15). ∗P < .05; ∗∗P < .01; ∗∗∗P < .001. Refer to supplemental Figures 5 and 6.
Blockade of nSMase-2 results in mitochondrial export deficits. (A) Average total number of unique proteins identified by quantitative LC-MS/MS of EVs derived from SMPD3-KO (EVSMPD3-KO, n = 3) vs AAVS1-KO (EVCon, n = 3) human CD34+ cells. (B) Principal component analysis (PCA) plot of vesicle proteomes. (C) Overlap in unique proteins identified in EVSMPD3-KO and EVCon. (D) Proportions and (E) volcano plot of depleted and enriched proteins differentially abundant in EVSMPD3-KO compared with EVCon. The dotted horizontal line represents −log10(P = .05). (F) String analysis of protein-protein networks depleted in EVSMPD3-KO. Gene ontology analysis of the (G) molecular function or (H) cell compartment of proteins significantly depleted in EVSMPD3-KO. (I) Representative immunoblot analysis and (J) quantitation of mitochondrial proteins depleted in EVs derived from HSPCGW, equal volume loaded. (K) Total DNA extracted from HSPCGW vesicles after 2000g (2K), 10 000g (10K), or 100 000g (100K) centrifugations; the dotted line indicates average normalized EV DNA extracted from HSPCCon vesicles. (L) Relative copy number of mtDNA regions per genes in cells and 100K vesicles after GW4869 treatment; dotted line represents normalized controls. Representative fluorescence-activated cell sorter plots (M) and quantification of MitoTracker staining in 100K vesicles (N). Relative chimerism measured over weeks after competitive transplantation of Tsg101-KO (n = 8) (O) or Cd63-KO (n = 7) (P) vs Rosa26-KO murine HSPCs (n = 15). ∗P < .05; ∗∗P < .01; ∗∗∗P < .001. Refer to supplemental Figures 5 and 6.
Constitutive secretion of mitochondrial protein and mitochondrial DNA (mtDNA) cargo into EVs (EV-mito) contributes to mitochondrial quality control and immune response.38-42 To confirm the presence of mtDNA in EV subpopulations, we isolated vesicles after 2000 (2K)g, 10 000 (10K)g, and 100 000 (100K)g centrifugations (supplemental Figure 5H). Total secreted DNA from HSPCGW was relatively unchanged in 2K and 10K vesicle preparations but significantly decreased in small (100K) EVs (Figure 4K). Targeted analysis of mitochondrial genes Cytb and Nd1 in addition to mtDNA region D-loop showed accumulation in HSPCGW cells consistent with transcriptomic profiling (Figures 3B and 4L). In contrast, decreased mtDNA copy number was seen in all vesicle subpopulations (Figure 4L; supplemental Figure 5I). Whole or fragmented mitochondria measured by vesicle-contained MitoTracker staining showed variable levels across EV subsets, similar to those previously described (supplemental Figure 5J-L).42-44 GW4869 treatment reduced mitochondrial cargo secretion, particularly in small 100K vesicles (Figure 4M-N; supplemental Figure 5M). Together, these findings indicate poor export of mitochondrial protein and mtDNA from HSPCGW
To confirm a role for nSMase-2–independent EV export in HSPC fitness, we targeted an endosomal sorting complex required for transport–associated gene TSG101 involved in EV biogenesis (supplemental Figure 6A-C).45 Cas9-mediated KO of TSG101 demonstrated similar deficits as SMPD3-KO in mitochondrial oxidoreductase protein secretion (supplemental Figure 6D-H) and enhanced long-term reconstitution compared with control cells (Figure 4O; supplemental Figure 6I-L). In contrast, preserved levels of EV-mito were observed after deletion of the tetraspanin CD63 that has well-described functions in small EV biogenesis and autophagic regulation46-49 (supplemental Figure 6M), whereas long-term engraftment showed deficits akin to those previously described50 (Figure 4P). These data support differential EV biogenesis pathways in selective mitochondrial cargo export, and further link vesicle release of select cargo to HSPC fitness.
nSMase-2 inhibition promotes a stress response in HSPCs
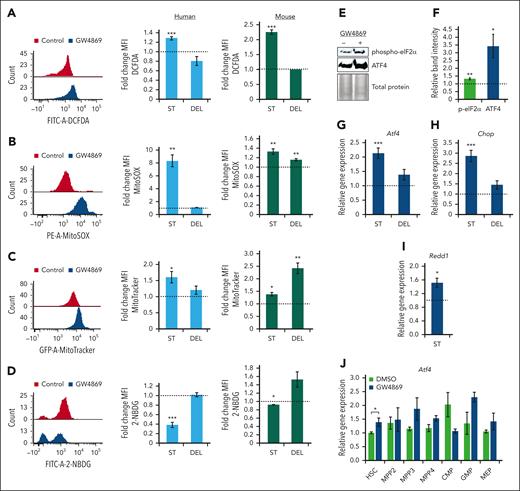
Given the deficits in mitochondrial cargo secretion and transcriptomic signature of HSPCGW, we assessed the impact of GW4869 on metabolic activity and ROS production. Intracellular ROS levels were elevated in human and murine HSPCGW (P < .001) with return to baseline 5 days after GW4869 removal (Figure 5A). Human and murine HSPC ROS was noted to be mitochondrial-sourced (P < .01) (Figure 5B) and was seen with concomitantly increased intracellular mitochondrial mass (P < .05) (Figure 5C). These gains in mitochondrial mass persisted in murine HSPCGW 5 days after drug withdrawal. Accumulation of mtROS in HSPCGW was associated with decreased uptake of a fluorescently labeled deoxyglucose analog (2-NBDG), suggesting alterations in global metabolic activity (Figure 5D).
Transient nSMase-2 inhibition activates an ROS-driven ISR in human and murine HSPCs. Representative fluorescence intensity of human CD34+ cells and relative FCs in mean fluorescence intensity (MFI) of human CD34+ cells (blue histograms) and murine HSPCs (green histograms) after GW4869 treatment: ROS by DCFDA/DCF measurement (A), mitochondrial ROS measurement by MitoSOX assay (B), mitochondrial mass measurement by MitoTracker analysis (C), and 2-NBDG glucose analog uptake measurement (D). Representative immunoblots (E) and quantitative analysis of phosphorylated eIF2α and total ATF4 protein levels in murine HSPCGW (F), equal protein loaded. Relative gene expression of Atf4 (G), Chop (H), and Redd1 (I) in murine HSPCGW. (J) Relative gene expression of Atf4 across murine HSPCGW subpopulations. Dotted lines represent normalized averages of DMSO-treated cell controls. ST, short-term time point (24 hours after GW4869 initiation). DEL, delayed time point (5 days after GW4869 withdrawal). ∗P < .05; ∗∗P < .01; ∗∗∗P < .001. Refer to supplemental Figure 7.
Transient nSMase-2 inhibition activates an ROS-driven ISR in human and murine HSPCs. Representative fluorescence intensity of human CD34+ cells and relative FCs in mean fluorescence intensity (MFI) of human CD34+ cells (blue histograms) and murine HSPCs (green histograms) after GW4869 treatment: ROS by DCFDA/DCF measurement (A), mitochondrial ROS measurement by MitoSOX assay (B), mitochondrial mass measurement by MitoTracker analysis (C), and 2-NBDG glucose analog uptake measurement (D). Representative immunoblots (E) and quantitative analysis of phosphorylated eIF2α and total ATF4 protein levels in murine HSPCGW (F), equal protein loaded. Relative gene expression of Atf4 (G), Chop (H), and Redd1 (I) in murine HSPCGW. (J) Relative gene expression of Atf4 across murine HSPCGW subpopulations. Dotted lines represent normalized averages of DMSO-treated cell controls. ST, short-term time point (24 hours after GW4869 initiation). DEL, delayed time point (5 days after GW4869 withdrawal). ∗P < .05; ∗∗P < .01; ∗∗∗P < .001. Refer to supplemental Figure 7.
We next considered how HSPCs demonstrated markedly enhanced long-term engraftment capacity despite coincident elevations in mtROS. The ISR has been demonstrated to promote HSPC survival in the setting of low-stress conditions through global translation attenuation and restoration of cellular homeostasis.51 Murine stem and progenitor subpopulations showed minor insignificant differences in homeostatic Atf4 and Chop levels in vivo (supplemental Figure 7A-B). However, murine and human HSPCGW showed increased phosphorylation of eukaryotic translation initiation factor 2α (eIF2α) and increased levels of ATF4 (Figure 5E-F; supplemental Figure 7C-D). Transient transcriptional upregulation of murine and human Atf4/ATF4, downstream transcription factor Chop/CHOP, and hypoxia-inducible factor-1 target gene Redd1/REDD1 was also noted (Figure 5G-I; supplemental Figure 7E-G). ISR activation was seen across murine HSPCGW subpopulations, including HSC (P < .05), MPP3 (P = .14), MPP4 (P = .14), and granulocyte-monocyte progenitors (GMP) (P = .15) (Figure 5J). In support of modulation of the ISR by EV-mito secretion, TSG101-KO HSPCs harbored similar elevations in intracellular mitochondrial load, mtROS, and CHOP expression (supplemental Figure 7H-J), whereas CD63-KO HSPCs remained unperturbed (supplemental Figure 7K-M). These findings suggest that transient blockade of EV-mito release leads to ISR activation in stem and progenitor cell populations.
The ISR inhibits downstream mTOR signaling in HSPCs
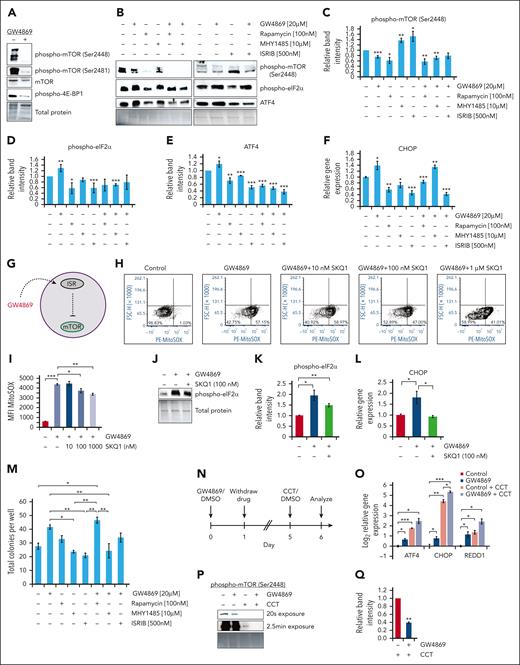
Previous studies have demonstrated the complex interplay between ISR and mTOR signaling pathways resulting in inversely proportional activity.52-54 Given known roles of mTOR signaling in regulating HSC quiescence and self-renewal,55,56 we investigated the impact of nSMase-2 inhibition and ISR activation on mTOR signaling. GW4869 treatment reduced mTOR activation in human and murine HSPCs (Figure 6A; supplemental Figure 7N). Treatment of HSPCs with rapamycin, with or without GW4869, resulted in mTOR hypophosphorylation, without subsequent increase in phospho-eIF2α, ATF4, or CHOP levels (Figure 6B-F; supplemental Figure 7O); these findings were conserved across human and murine cells. In contrast, treatment with phospho-eIF2α inhibitor resulted in decreased phospho-eIF2α and ATF4 protein levels, reduced ATF4 and CHOP transcription, and elevated mTOR phosphorylation. These results suggest that ISR activation in HSPCs leads to downstream mTOR pathway suppression (Figure 6G).
The ISR dampens human HSPC mTOR signaling. Representative immunoblots (A-B) and quantitative protein analysis (C-E) of human CD34+ cells after 24-hour drug treatment, equal protein loaded. (F) Gene expression analysis of CHOP in human CD34+ cells after 24-hour drug treatment. (G) Schematic of GW4869-driven ISR activation upstream of mTOR inhibition. Representative flow cytometric plots (H) and quantitative analysis (I) of PE-MitoSOX fluorescence intensity after human CD34+ cell GW4869 and/or SKQ1 treatment. Representative immunoblots (J) and quantitative analysis (K) of phospho-eIF2α levels in human CD34+ cells following GW4869 and 100 nM SKQ1 treatment, equal protein loaded. (L) Gene expression analysis of CHOP levels in treated human CD34+ cells. (M) Colony formation assay after 24-hour drug treatment. (N) Timeline of ISR sensitization experiments. (O) Relative gene expression in human CD34+ cells after GW4869 priming and CCT020312 (CCT) treatment. (P) Representative immunoblot and (Q) quantitative analysis of phospho-mTOR (Ser2448) levels in GW4869-primed CD34+ cells after CCT treatment. ∗P < .05; ∗∗P < .01; ∗∗∗P < .001. Refer to supplemental Figure 7.
The ISR dampens human HSPC mTOR signaling. Representative immunoblots (A-B) and quantitative protein analysis (C-E) of human CD34+ cells after 24-hour drug treatment, equal protein loaded. (F) Gene expression analysis of CHOP in human CD34+ cells after 24-hour drug treatment. (G) Schematic of GW4869-driven ISR activation upstream of mTOR inhibition. Representative flow cytometric plots (H) and quantitative analysis (I) of PE-MitoSOX fluorescence intensity after human CD34+ cell GW4869 and/or SKQ1 treatment. Representative immunoblots (J) and quantitative analysis (K) of phospho-eIF2α levels in human CD34+ cells following GW4869 and 100 nM SKQ1 treatment, equal protein loaded. (L) Gene expression analysis of CHOP levels in treated human CD34+ cells. (M) Colony formation assay after 24-hour drug treatment. (N) Timeline of ISR sensitization experiments. (O) Relative gene expression in human CD34+ cells after GW4869 priming and CCT020312 (CCT) treatment. (P) Representative immunoblot and (Q) quantitative analysis of phospho-mTOR (Ser2448) levels in GW4869-primed CD34+ cells after CCT treatment. ∗P < .05; ∗∗P < .01; ∗∗∗P < .001. Refer to supplemental Figure 7.
Because the ISR can be triggered by diverse stimuli,57 we tested whether the stress response resulted from elevated mtROS levels in HSPCGW. Treatment with escalating doses of mtROS scavenger SKQ1 partially restored mtROS levels in human HSPCGW (Figure 6H-I). Despite only partial rescue of mtROS in HSPCGW by intermediate-dose SKQ1, eIF2α phosphorylation was reduced, and transcriptional levels of CHOP returned to baseline (Figure 6J-L). Functionally, blockade of either GW4869-induced ISR or downstream mTOR inhibition reduced colony output after brief ex vivo culture (Figure 6M; supplemental Figure 7P).
Initiation of the ISR through CCT020312-mediated PERK activation further resulted in upregulation of ATF4, CHOP, and REDD1 in human HSPCs previously exposed to GW4869 (Figure 6N-O). Similar sensitization of mouse HSPCs to ISR activation was noted (supplemental Figure 7Q). Exaggerated mTOR hypophosphorylation was also observed in cells primed with GW4869 (Figure 6P-Q). These data may at least partially explain long-term enhanced fitness of HSPCGW after transplantation, in that initial ISR activation sensitizes HSPCs to later stress response.
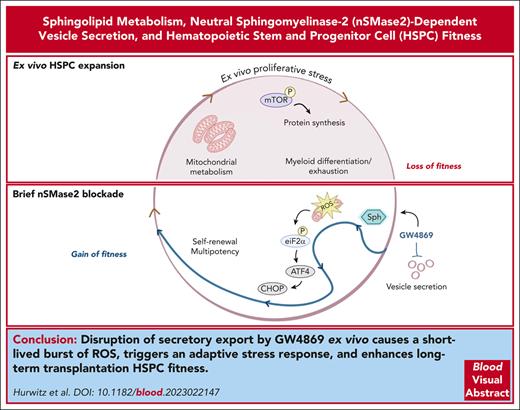
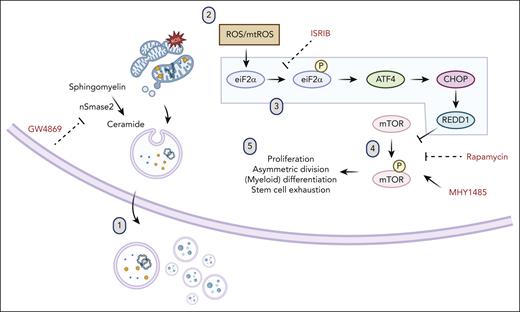
Aggregate data support a model in which transient nSMase-2 inhibition in HSPCs ex vivo results in poor mitochondrial and oxidoreductase cargo export through vesicle secretion, with accumulation of mitochondrial-sourced ROS (Figure 7). In the setting of transiently elevated ROS, rescue of HSPCs occurs through ISR activation and downstream mTOR inhibition. Consequences of this stress reaction include transient metabolic quiescence that relieves HSPC of myeloid differentiation bias in culture and improves clonogenicity. Importantly, these effects ultimately enhance long-term in vivo engraftment and hematopoietic reconstitution of ex vivo cultured HSPCs.
Model of ISR and mTOR suppression after ceramide-EV blockade. (1) Pharmacologic or genetic inhibition of neutral sphingomyelinase results in deficits in EV secretion of mitochondrial cargo. (2) Mitochondrial ROS accumulation leads to (3) activation of the ISR via eIF2α phosphorylation, subsequent ATF4 translation, upregulation of CHOP and REDD1, (4) downstream inhibition of mTOR phosphorylation, and (5) resultant quiescence, relative lymphoid bias, and enhanced fitness after transplantation.
Model of ISR and mTOR suppression after ceramide-EV blockade. (1) Pharmacologic or genetic inhibition of neutral sphingomyelinase results in deficits in EV secretion of mitochondrial cargo. (2) Mitochondrial ROS accumulation leads to (3) activation of the ISR via eIF2α phosphorylation, subsequent ATF4 translation, upregulation of CHOP and REDD1, (4) downstream inhibition of mTOR phosphorylation, and (5) resultant quiescence, relative lymphoid bias, and enhanced fitness after transplantation.
Discussion
Secretory function, including through EV release, is a major mechanism governing cell homeostasis; however, technical challenges have long prevented thorough understanding of precise roles the HSPC secretome plays in guiding cell fate. Using ex vivo expansion,21,58 we conduct large-scale investigations of HSPC vesicle content and function. For the first time, we demonstrate that ex vivo modulation of nSMase-2–dependent vesicle secretion in both mouse and human cells confers durable gains in long-term HSPC fitness through activation of the ISR. Importantly, these profound impacts are sustained after transient pharmacologic treatment, providing a feasible translational avenue for pursuit in improving ex vivo–expanded cell products. Strikingly, nSMase-2 blockade in human CD34+ cells leveled disparities in HLA-dependent engraftment in NBSGW mice, a finding that is of particular interest given critical roles of HLA in long-term transplantation outcomes.
Elimination of mitochondria may be particularly relevant in stem cells as a mechanism of quality control and means by which to outsource mitophagy.38,40,41,59,60 Although we anticipate the possibility of additional collateral consequences of disrupting sphingolipid biosynthesis, disruption of EV-mito likely in part contributes to the observed adaptive stress response. Sphingolipid metabolism is inextricably tied to EV biogenesis17-19; however, to distinguish direct sphingolipid-mediated rewiring of HSPCs from predominantly EV-mediated effects, we investigated additional genetic models disrupting EV secretion. Recapitulation of ISR activation and long-term fitness gains after loss of Tsg101-dependent EV-mito secretion supports a mechanism by which secreted EV factors modulate HSPC function. This argument is strengthened by the lack of broad, class-specific sphingolipid alterations, such as global ceramide depletion after GW4869 treatment, suggesting an EV secretome-dependent mechanism rather than solely direct sphingolipid-mediated metabolic changes. It is possible that prior reports of prosurvival stress response after de novo ceramide synthesis inhibition result similarly from loss of DEGS1-dependent EVs.10,12
Impacts of nSMase-2 inhibition on HSPC transplantation were profound and unexpected, given well-described detrimental roles of ROS in driving cycling and myeloid bias,61-65 and led us to investigate the molecular mechanisms driving long-term stress adaptation. High mtROS levels after nSMase-2 inhibition led to ISR activation and mTOR inhibition that ultimately enhances fitness of HSPC pools. Parallel, but distinct findings were reported with DEGS1 inhibition, in which human HSPCs showed increased autophagic flux and proteostatic ISR activation with concomitantly reduced ROS, suggesting an alternative, but possibly convergent pathway of HSPC adaptive stress response.10
In HSPCs, mTOR suppression mediates re-entry into quiescence, reduced protein synthesis, and enhanced symmetric division.55,56,66,67 Promotion of the ISR in HSPCs likely has broader impacts beyond mTOR regulation, including translation dynamics. Tightly controlled protein synthesis rates are crucial for HSPC self-renewal, lineage commitment, and stress resistance.67-75 ISR-driven reduction of protein synthesis may be particularly relevant in settings of ex vivo expansion cultures or other proliferative stress, in which protein synthesis is massively induced at the expense of reconstituting activity.75 In this study, regenerative enhancement was seen most strikingly in HSPCGW after >24-hour culture. Given the proliferative rebound seen in HSPCGW after drug withdrawal, durable gains in fitness after transient enzymatic inhibition likely reflect some level of resistance to regenerative stress rather than sustained quiescence.
Interestingly, transient nSMase-2 inhibition sensitized HSPCs to altered subsequent stress response. It does not escape our attention that our findings in some regard parallel those observed in aging or during trained immunity of mature and primitive hematopoietic cells, particularly through inflammatory tolerance.76-80 Trained immunity has recently been described to occur in macrophages through reprogramming of sphingolipid-mitochondrial fission pathways.81 Future studies are warranted to evaluate possible chromatin accessibility reprogramming that may mediate long-term stress adaptation in HSPCs after nSMase-2 dysregulation.
Although numerous advances have been made over past decades to improve safety and efficiency of HSPC transplantation,82,83 constraints in cell quantity and graft success continue to limit outcomes. Ex vivo cultures for expansion of cord blood HSPCs have gained interest for broadening use in adult patients. Moreover, gene addition and editing strategies have made short-term maintenance of HSPCs necessary, before and after manipulation. However, challenges surround the preservation of stemness properties and graft potency in ex vivo cultured HSPCs. Our data uncover a cell-autonomous mechanism for regulating metabolic HSPC quiescence, stress response, and repopulation capacity. Importantly, we unveil a novel pharmacologic agent to be explored in improving ex vivo HSPC culture and transplantation.
Acknowledgments
The authors thank the Children’s Hospital of Philadelphia (CHOP) Flow Cytometry core laboratory, CHOP Department of Veterinary Resources, University of Pennsylvania (Penn) Stem Cell and Xenograft Core, CHOP-Penn Proteomics Core Facility, and CHOP Center for Applied Genomics core laboratory for experimental assistance. The authors additionally thank Single Cell Discoveries for single-cell RNA sequencing analytical assistance and the University of Pennsylvania Hematopoietic Stem Cell Laboratory for donation of patient-derived samples under appropriate institutional review board approval.
This study was funded in part through the National Institutes of Health (NIH), National Heart, Lung, and Blood Institute grants R01-HL164633 (P.K.), 4-R38-HL143613-04 (S.N.H.), T32 HL-07439 (S.N.H.), and NIH, National Institute of Environmental Health Sciences grant P30ES013508 (C.M.).
The visual abstract was created with BioRender.
Authorship
Contribution: S.N.H., S.K.J., and P.K. conceptualized the study; S.N.H., S.K.J., C.M., and P.K. developed the methodology; S.N.H., S.K.J., D.R.K., C.M., H.F., and L.A.S. carried out the investigation; S.N.H., C.M., E.B.P., and N.G. conducted the formal analysis; S.N.H. wrote the original draft of the manuscript; S.N.H., S.K.J., D.R.K., C.M., H.F., L.A.S., E.B.P., N.G., and P.K. reviewed and edited the manuscript; S.N.H., C.M., and P.K. were responsible for funding acquisition; and S.N.H. and P.K. supervised the study.
Conflict of interest disclosure: The authors declare no competing financial interests.
Correspondence: Peter Kurre, Comprehensive Bone Marrow Failure Center, Children’s Hospital of Philadelphia, 3615 Civic Center Blvd, Philadelphia, PA 19104; e-mail: kurrep@chop.edu.
References
Author notes
Proteomic data are available in the ProteomeXchange Consortium via the PRIDE84 partner repository (PXD040865). Single-cell RNA sequencing data have been deposited at Gene Expression Omnibus (GSE226348).
Data are available on request from the corresponding author, Peter Kurre (kurrep@chop.edu).
The online version of this article contains a data supplement.
There is a Blood Commentary on this article in this issue.
The publication costs of this article were defrayed in part by page charge payment. Therefore, and solely to indicate this fact, this article is hereby marked “advertisement” in accordance with 18 USC section 1734.

This feature is available to Subscribers Only
Sign In or Create an Account Close Modal