Key Points
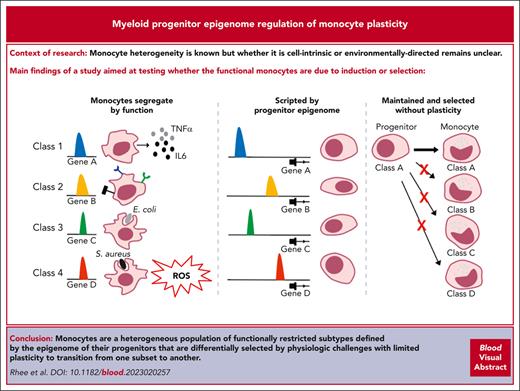
Four functional subsets of monocytes were identified by tracking myeloid progenitor clonal descendants.
Interconversion between monocyte subsets is infrequent even with in vivo stress.
Abstract
Myeloid cell heterogeneity is known, but whether it is cell-intrinsic or environmentally-directed remains unclear. Here, an inducible/reversible system pausing myeloid differentiation allowed the definition of clone-specific functions that clustered monocytes into subsets with distinctive molecular features. These subsets were orthogonal to the classical/nonclassical categorization and had inherent, restricted characteristics that did not shift under homeostasis, after irradiation, or with infectious stress. Rather, their functional fate was constrained by chromatin accessibility established at or before the granulocyte-monocyte or monocyte-dendritic progenitor level. Subsets of primary monocytes had differential ability to control distinct infectious agents in vivo. Therefore, monocytes are a heterogeneous population of functionally restricted subtypes defined by the epigenome of their progenitors that are differentially selected by physiologic challenges with limited plasticity to transition from one subset to another.
Introduction
Myeloid cells are the most evolutionarily ancient aspect of a specialized immune system and the cornerstone of innate immunity in vertebrates.1 Among myeloid cells, monocytes play a pivotal role in innate immunity as phagocytes, cytokine producers, and sources of antigen-presenting cells that patrol the blood and assume tissue resident sites.2-5
Under normal conditions and during infection, monocytes differentiate from both granulocyte-monocyte progenitors (GMPs) and monocyte-dendritic cell progenitors (MDPs) in the bone marrow (BM) of adults.6 Once produced, monocytes leave the bloodstream and migrate to other tissues, where they differentiate into macrophages. Recent research indicates that mouse MDPs may also originate from common myeloid progenitors independently of GMPs.7,8 Numerous studies have demonstrated that mouse monocytes are grouped into 2 subsets based on immunophenotypes and functions.9-11 Inflammatory classical monocytes are selectively recruited to inflamed tissues to secrete large quantities of tumor necrosis factor α (TNF-α) and interleukin-1 in response to damage. “Resident and patrolling” nonclassical monocytes dynamically patrol the vascular endothelium during steady-state and inflammation. In parallel, 3 distinct human monocyte subsets were identified based on the expression of CD14 and CD16, named classical, intermediate, and nonclassical subsets.12-15 Classical monocytes readily convert to nonclassical monocytes with high responsiveness to exogenous cues,16 and this is dependent upon expression of transcription factors (TFs) such as C/EBP17 and NR4A1,18 although some controversy remains.6,16,19,20
Several studies using unbiased single-cell RNA sequencing (scRNA-seq) and high-dimensional mass cytometry analysis have mapped heterogenous human circulating monocytes.21,22 These studies highlighted increased heterogeneity compared with previous classifications, but the subsets are of unclear functional consequence. Previous research has also shown that different progenitors, GMPs and MDPs, independently produce functionally distinct monocytes.8 Differences of PU.1 levels in naive monocytes lead to distinct microbicidal or dendritic cell differentiation upon stimulation.23-25 It has also been extensively shown that monocytes are readily induced to acquire functional features dependent on physiological needs,26-28 all leading to the prevailing model that monocytes are highly plastic and able to interconvert based on environmental factors.
To further test monocyte heterogeneity, plasticity, and whether the functional monocytes are due to induction or selection, we used a model system that allowed us to expand and control the differentiation of individual myeloid progenitors ex vivo. We could then determine whether the progenitor clones with molecular and immunophenotypic distinctions differentiated into monocytes with specialized functions. Functional, transcriptomic, and epigenomic analyses of myeloid progenitor clones and their monocyte descendants revealed 4 progenitor differentiation trajectories that yield functionally distinct monocytes. Notably, these groups were evident at the myeloid progenitor level based on unsupervised clustering of chromatin configuration data. The differentiation fate of the monocyte descendants was epigenetically scripted in their progenitors, and this fate had little flexibility once differentiation began. Testing cells under in vitro and in vivo homeostasis and stress conditions indicates that the cells maintain their differentiation path and do not transition from one state to another.
Methods
Generation of ER-Hoxb8 myeloid progenitors
ER-Hoxb8 immortalized cells were generated using lin-depleted mouse BM of C57BL/6-CD45.1 (STEM) mice and maintained as previously reported.29,30 Briefly, retrovirus was produced via the cotransfection of MSCVneo-HA-ER-Hoxb8 (ER-Hoxb8) plasmid (provided by David Sykes, Massachusetts General Hospital) and Ecotropic packaging construct into 293T cells at 70% confluence on 10 cm dishes. Viral supernatant was filtered through a 0.45 micron syringe filter to remove debris. ER-Hoxb8 cells were maintained in RPMI medium (Thermo Fisher) supplemented with 1% penicillin/streptomycin, 1% glutamine, 0.5 μM β-estradiol (Sigma, E2758), and conditioned media containing different cytokines. The cell lines were kept in a 5% CO2, humidified atmosphere at 37°C. After 10 days of maintenance, the cells were sorted using fluorescence-activated cell sorting (FACS) into 96 well plates with culture media for further analysis.
Lineage tracing
Primary myeloid progenitors (CD45+, Lin–, cKit+, Sca–, CD16/32+, and CD34) from C57BL/6-Tg(UBC-GFP)30Scha/J (004353, Jackson) or C57BL/6-CD45.1 (STEM)31 mice were sorted, followed by transduction with a high-complexity barcode library, pRSI9-U6-(sh)-UbiC-TagRFP-2A-Puro (67267, Addgene). Barcoded progenitors were transferred into irradiated (6 or 9 Gy) C57BL/6 mice (000664, Jackson) for 72 hours or 7 days before isolation of blood monocytes. Cells from tissues were harvested and sorted into the 4 different classes of primary monocytes based on the CD49f/CD54 analytic schema, and GFP+TagRFP+ or Cd45.1+TagRFP+ cells in each class were processed for DNA sequencing per previously published methods.32
Results
Monocytic cells have myeloid progenitor clone–specific behaviors that can be classified into functional groups
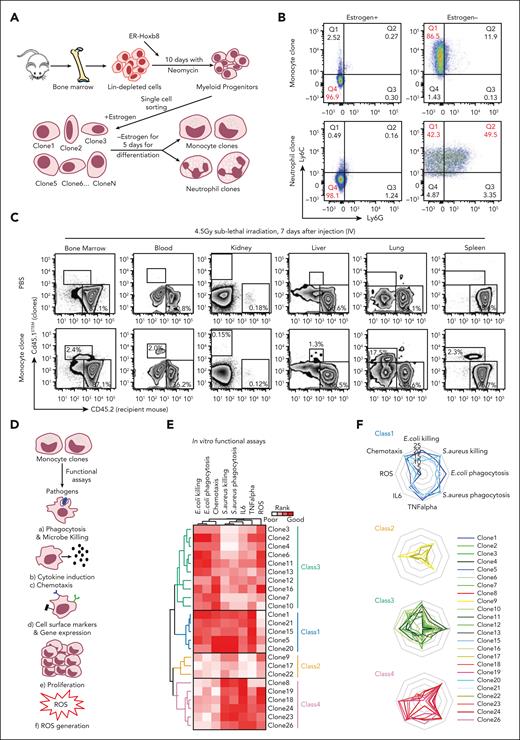
To study the heterogeneity of myeloid progenitors at a clonal level, a system that allows for inducible clonal expansion of primary mouse myeloid progenitors capable of differentiating into mature myeloid cells was adapted.29,30 Primary murine BM cells transduced with an ER-Hoxb8 fusion construct and maintained in the presence of an estrogen agonist self-renew indefinitely as myeloid progenitors. These cells collectively possess granulocyte and monocyte differentiation capability consistent with that of myeloid progenitors. The progenitors can be isolated via single cell sorting and propagated as clones in the presence of estrogen (Figure 1A). Estrogen withdrawal inactivates ER-Hoxb8, allowing for terminal myeloid differentiation into either monocytes or neutrophils over ∼5 days, as confirmed by the presence of cell surface markers (CD11b, Ly6C, and Ly6G) and morphology (Figure 1B; supplemental Figure 1A-B, available on the Blood website). Given the heterogeneous populations of cells transduced with ER-Hoxb8, individual clones might have been derived from either GMPs or MDPs, and therefore, they are termed myeloid progenitors. Undifferentiated myeloid progenitor clones derived from CD45.1STEM donor mice that had monocyte potential (and were, therefore, likely monocyte committed progenitors) were infused into sublethally irradiated CD45.2 recipients, and their ability to undergo in vivo differentiation (F4/80Hi) was confirmed after 7 days (Figure 1C; supplemental Figure 1C-E). CD45.1STEM donor cells in tissues or blood were sorted and then subjected to reverse transcription quantitative polymerase chain reaction (RT-qPCR) to examine whether the cells acquired tissue-specific profiles. They expressed tissue-specific profiles (Adgre1, Itgax, Itgam, Fcgr1, Csf1r, and H2-Ab1), implying that the clones respond to the tissue environment (supplemental Figure 1F). Therefore, undifferentiated myeloid progenitor clones expanded in vitro can differentiate into monocytes in vitro and in vivo.
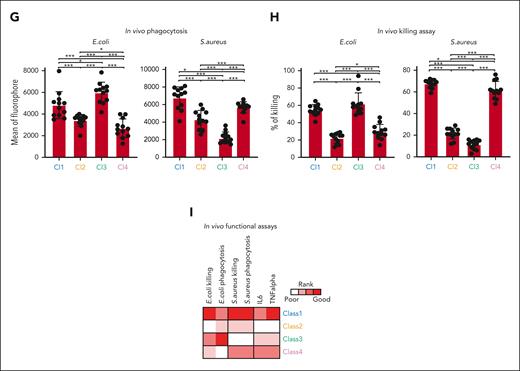
ER-Hoxb8 monocytic cells have clone-specific behaviors that can be classified into functional groups. (A) Experimental scheme of conditional myeloid differentiation. (B) Representative FACS plots showing cell fates of ER-Hoxb8 clones. (C) Representative FACS plots of ER-Hoxb8 progenitor clones showing monocytes derived from ER-Hoxb8 can emigrate and reside in tissues after injection into the blood (n = 3 independent experiments, in triplicate technical replicates). (D) Experimental scheme of functional assays to evaluate heterogeneity within monocytic ER-Hoxb8 clones. (E) Heatmap showing monocytic clones have clone-specific behaviors that can be classified into 4 functional groups. Each parameter was scored based on its functional performance. The level of response was roughly broken down into quartiles of the difference from baseline to maximal response. The best-performing clone was colored in red, the worst-performing clone was marked in white, and the remaining clones were displayed in a gradient between red and white. (F) Radar plots showing the functional abilities of monocyte ER-Hoxb8 clones in vitro. (G) Bar graphs showing in vivo phagocytosis of ER-Hoxb8 monocytes using fluorescently labeled heat-killed bacteria (n = 4 independent experiments, in triplicate biological replicates). (H) Bar graphs showing in vivo killing assay of ER-Hox8b monocytes using live bacteria (n = 4 independent experiments, in triplicate biological replicates). (I) Heatmap showing in vivo functional assays correlate with in vitro data. Class 1 and class 4 mark the same level as both classes produce interleukin-6 (IL-6) at a similar rate. ∗P < .05; ∗∗P < .01; ∗∗∗P < .005.
ER-Hoxb8 monocytic cells have clone-specific behaviors that can be classified into functional groups. (A) Experimental scheme of conditional myeloid differentiation. (B) Representative FACS plots showing cell fates of ER-Hoxb8 clones. (C) Representative FACS plots of ER-Hoxb8 progenitor clones showing monocytes derived from ER-Hoxb8 can emigrate and reside in tissues after injection into the blood (n = 3 independent experiments, in triplicate technical replicates). (D) Experimental scheme of functional assays to evaluate heterogeneity within monocytic ER-Hoxb8 clones. (E) Heatmap showing monocytic clones have clone-specific behaviors that can be classified into 4 functional groups. Each parameter was scored based on its functional performance. The level of response was roughly broken down into quartiles of the difference from baseline to maximal response. The best-performing clone was colored in red, the worst-performing clone was marked in white, and the remaining clones were displayed in a gradient between red and white. (F) Radar plots showing the functional abilities of monocyte ER-Hoxb8 clones in vitro. (G) Bar graphs showing in vivo phagocytosis of ER-Hoxb8 monocytes using fluorescently labeled heat-killed bacteria (n = 4 independent experiments, in triplicate biological replicates). (H) Bar graphs showing in vivo killing assay of ER-Hox8b monocytes using live bacteria (n = 4 independent experiments, in triplicate biological replicates). (I) Heatmap showing in vivo functional assays correlate with in vitro data. Class 1 and class 4 mark the same level as both classes produce interleukin-6 (IL-6) at a similar rate. ∗P < .05; ∗∗P < .01; ∗∗∗P < .005.
The functional features of cells derived from clonal progenitors were assessed using multiple in vitro assays (Figure 1D). Monocytes derived from 25 single myeloid progenitor clones were assessed for phagocytosis, as measured based on the intracellular fluorescence of engulfed fluorescently labeled bacteria at baseline and following lipopolysaccharide (LPS) activation. Bactericidal activity was evaluated using bacterial colony forming unit assays. Killing of both gram-negative Escherichia coli and gram-positive Staphylococcus aureus bacteria demonstrated clone-specific capacity for each of the functions regardless of LPS treatment (supplemental Figure 2A-F).33 Clones also varied in their chemotaxis in vitro, a prerequisite for blood monocytes migration into tissues, where they transform into macrophages (supplemental Figure 2G). Monocyte production of reactive oxygen species (ROSs) and secretion of TNF-α and interleukin-6 after LPS stimulation were also tested and found to be clone-specific (supplemental Figure 2H-J).
Each parameter was scored, and unsupervised clustering of the aggregated functional data helped identify 4 distinct functional groups (Figure 1E-F). Functional distinctions were not due to differences in differentiation and proliferation rates, which were equivalent between clones (supplemental Figure 2K). Cell cycles of ER-Hoxb8 clones were assessed via Ki67 and 4′,6-diamidino-2-phenylindole staining, and no significant differences were found (supplemental Figure 2L). The biological replicates from different aliquots differentiated into monocytes that had highly stereotypic, clone-specific behaviors. Therefore, myeloid progenitors differentiate into functionally distinctive monocytes.
This functional monocyte grouping suggests a subcategorization beyond inflammatory classical and resident nonclassical monocytes.10 Importantly, although all clones could perform the functions we tested, there were significant differences in how well each class performed. Broadly characterizing each group, class 1 was more adept at both E coli and S aureus killing, chemotaxis, and cytokine secretion. Class 2 did not perform well in most functional assays but had more ROS production upon LPS stimulation than class 1. Class 3 exhibited preferential E coli killing over S aureus and strong ROS production after LPS stimulation. Class 4 was more effective at killing S aureus than E coli and vigorously produced cytokines. Comparing class 3 with class 4, class 3 expressed higher levels of toll-like receptor 4, the essential receptor involved in LPS recognition and signal initiation. It also differentially expressed higher levels of the gene ontology terms for Yersinia (gram-negative) infection, Salmonella (gram-negative) infection, and tuberculosis, possibly accounting for the distinctive antimicrobial functions.
To test whether these classifications were relevant in vivo, we intraperitoneally or IV injected clones from each class of monocyte into lethally irradiated mice with live bacteria or labeled heat-killed bacteria, followed by assessing their capacity to clear the infection and produce cytokines. We excluded ROS from the in vivo characterization because most ROS are short-lived in vivo with low steady-state levels and rapid alteration. Consistent with our in vitro findings, class 1 phagocytosed and cleared the bacteria most efficiently with the highest secretion of the cytokines interleukin-6 and TNF-α. Class 3 and class 4 were efficient in killing E coli and S aureus, respectively, in vivo, whereas class 2 was inefficient in the monocyte functions tested (Figure 1G-I; supplemental Figure 2M-N). Collectively, monocytes from the ER-Hoxb8 system can be functionally distinguished into 4 classes with distinctive and defined functional behaviors in vitro and in vivo.
Subgroups of monocytes exhibit distinct gene expression signatures
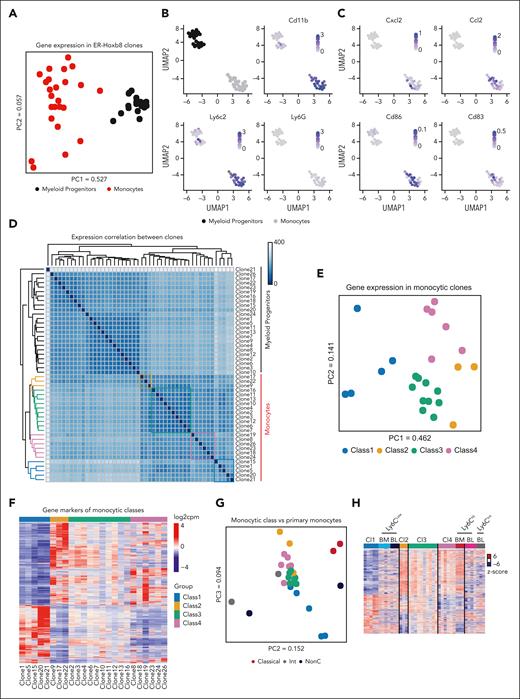
To assess whether the functional distinctions between monocytes were reflected in their transcriptional signatures, clonally paired ER-Hoxb8 myeloid progenitors and mature monocytes were subjected to RNA-seq. Expression profiles of myeloid progenitors and monocytes clustered distinctly from each other, as expected (Figure 2A-D; supplemental Table 1). The principal component analysis (PCA) of gene expression among myeloid progenitors was tightly clustered, but there was divergence in gene expression among their descendant monocytes, consistent with heterogeneity among the monocytes in a clone-specific manner (Figure 2A). Among the genes expressed in monocytes derived from ER-Hoxb8 clones, innate immune response–related genes and macrophage markers were upregulated compared with the progenitors, as expected with differentiation (supplemental Figure 3A). To validate the correspondence of the clone-derived monocytes with murine naive primary monocytes, we assessed expression of key monocytic genes, such as Ly6c2 and CD11b, but not in the key neutrophil gene Ly6G (Figure 2B). Notably, although all myeloid progenitor clones had similar transcriptomes (Figure 2A), unsupervised correlation analyses and PCA revealed 4 distinct monocyte classes that corresponded with their functional classifications with one clone discrepancy (Figure 2D-E). Clustering was not biased or trained using known monocyte markers.
Monocyte subsets have distinct gene expression signatures. (A) PCA plot of gene expression patterns in ER-Hoxb8 progenitors and monocytes. (B-C) Uniform manifold approximation and projection (UMAP) plots of myeloid progenitors and monocyte clones with expression of known monocytic markers visualized using color. (D) Correlation heatmap of gene expression patterns in both myeloid progenitor and monocytic clones. Sample distances were calculated with a Euclidean distance method using a “dist” function in the DESeq2 program. Functional classes are highlighted by boxes (class 1: blue, class 2: yellow, class 3: green, and class 4: red). (E) PCA of global gene expression patterns reveals distinct subgroups of monocytic clones. Points are colored based on functional class. (F) Heatmap of class-specific gene expression levels in monocytic clones. (G) Combined PCA of expression patterns in ER-Hoxb8 monocytes and primary mouse monocytes with previously defined classification. Points are colored by monocyte classification. (H) Heatmap of gene expression levels in ER-Hoxb8 monocytes together with previously published primary mouse blood monocytes, for the genes differentially expressed between any 2 classes in ER-Hoxb8 monocytic clones. The levels are shown as z scores based on the expression of a given gene across all samples. (I) Gene enrichment analysis of class-specific differentiation signatures between a progenitor clone and the corresponding monocyte clone.
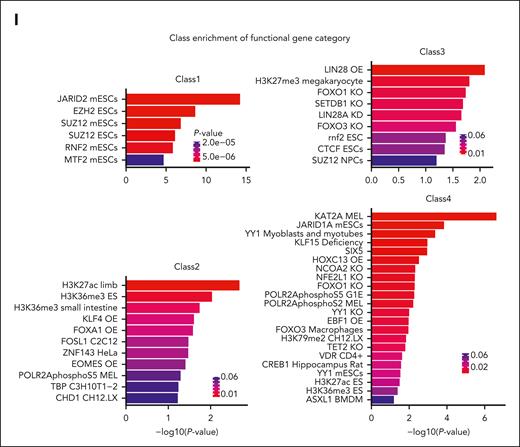
Monocyte subsets have distinct gene expression signatures. (A) PCA plot of gene expression patterns in ER-Hoxb8 progenitors and monocytes. (B-C) Uniform manifold approximation and projection (UMAP) plots of myeloid progenitors and monocyte clones with expression of known monocytic markers visualized using color. (D) Correlation heatmap of gene expression patterns in both myeloid progenitor and monocytic clones. Sample distances were calculated with a Euclidean distance method using a “dist” function in the DESeq2 program. Functional classes are highlighted by boxes (class 1: blue, class 2: yellow, class 3: green, and class 4: red). (E) PCA of global gene expression patterns reveals distinct subgroups of monocytic clones. Points are colored based on functional class. (F) Heatmap of class-specific gene expression levels in monocytic clones. (G) Combined PCA of expression patterns in ER-Hoxb8 monocytes and primary mouse monocytes with previously defined classification. Points are colored by monocyte classification. (H) Heatmap of gene expression levels in ER-Hoxb8 monocytes together with previously published primary mouse blood monocytes, for the genes differentially expressed between any 2 classes in ER-Hoxb8 monocytic clones. The levels are shown as z scores based on the expression of a given gene across all samples. (I) Gene enrichment analysis of class-specific differentiation signatures between a progenitor clone and the corresponding monocyte clone.
Differentially expressed gene (DEG) analyses of each class of clones against all other clones were used to define gene markers of each class, shown in the expression heatmap along with the class-specific enrichment of functional gene sets (Figure 2F; supplemental Figure 3B; supplemental Table 2). Class 1 monocytes were enriched in general immune response genes including inflammatory response and response to toxic substances, whereas class 3 monocytes were enriched in defense response to bacteria and acute-phase response genes (supplemental Figure 3B). Interestingly, genes that were highly expressed in class 2 were not enriched in monocyte-associated functional terms but rather associated with terms such as DNA repair.
Next, we assessed the transcriptomic relationship of functionally defined monocyte groups from our method with previously described classes of murine primary monocytes (classical, intermediate, and nonclassical). Clear global transcriptomic correlations between previously described monocytic classes and our defined classes were not observed (Figure 2G). However, when using DEG only, class 1 and class 4 transcriptionally resembled nonclassical and classical monocytes, respectively (Figure 2H). These data suggest that our functionally defined monocyte classes further recapitulate the heterogeneity of primary monocytes at the transcriptomic level.
We further analyzed gene expression signatures of clones differentiated from myeloid progenitors to monocytes using DEG analysis between the monocyte and the progenitor stage for clones within each class, and the functional enrichments among these genes were assessed using EnrichR.34,35 Interestingly, differentiation signatures for each class were enriched in distinct gene sets associated with key chromatin regulators and TFs (Figure 2I). For example, although DEGs of class 1 were strongly enriched in the binding targets of Polycomb complexes PRC1/2, DEGs of class 3 were enriched not only in the targets of Polycomb and the related H3K27me3 but also differentially in the targets of H3K9 methyltransferase SETDB1, TFs LIN28 and FOXO1/3, and a key regulator of chromatin interactions CCCTC-binding factor (CTCF). Differentiation in class 2 was associated with polymerase II, TATA-binding protein (TBP), transcription-related chromatin factor CHD1, and histone marks H3K36me3 and H3K27ac as well as stem cell differentiation factors, whereas class 4 was associated with similar transcriptional machinery but a different group of chromatin regulators and differentiation factors (eg, KAT2A, Tet2, Yy1, Jarid1A, Ebf1, Hoxc13, and Asxl1). Taken together, these signatures suggest that monocyte classes may have distinct differentiation mechanisms and trajectories.
Chromatin accessibility patterns in myeloid progenitors presage monocyte subgroups
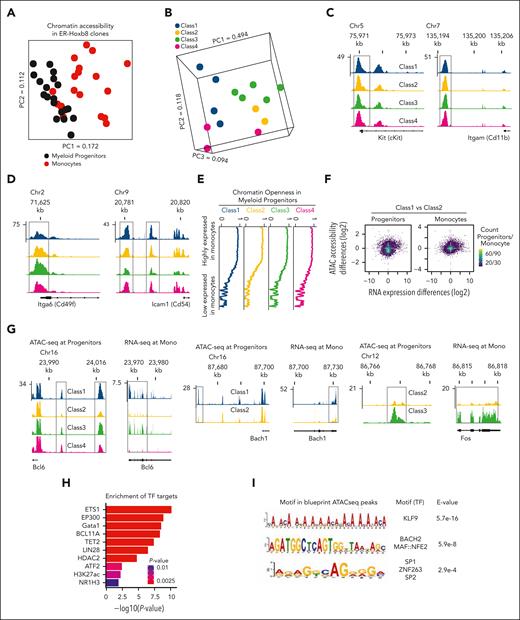
To assess the relationship of transcriptional differences among monocytes with epigenetic signatures of their progenitors, assay for transposase-accessible chromatin using sequencing (ATAC-seq) on myeloid progenitor clones and their differentiated monocytes was performed (supplemental Figure 3C). Surprisingly, myeloid progenitors had heterogeneous patterns of chromatin accessibility largely different from monocytes (Figure 3A), and the 4 clone groups of myeloid progenitors had distinct chromatin accessibility corresponding to their functional classification (Figure 3B). For example, the regulatory regions of the key marker genes such as cKit and CD11b had a similar chromatin openness between the progenitor subsets (Figure 3C). In contrast, cell surface markers such as CD49f and CD54, which we found to be differentially expressed in monocytes (supplemental Figure 3D), had differential chromatin openness between the subsets (Figure 3D). The chromatin configuration in the myeloid progenitors was reflected in the gene expression in their descendant monocytic subset.
Monocyte subsets are primed epigenetically at the level of progenitor cells. (A) PCA plot of chromatin accessibility at ATAC-seq peaks in progenitors, and monocyte ATAC-seq reveals distinct patterns of chromatin accessibility among myeloid progenitors. (B) PCA of chromatin accessibility patterns in progenitors, with points colored based on functional classes of monocytes. (C) Representative genomic tracks of ATAC-seq tag density near cKit and CD11b genes with similar chromatin accessibility across all classes (boxed). (D) Representative genomic tracks of differential ATAC-seq tag density between classes (boxed). (E) Gene expression is associated with chromatin openness in myeloid progenitors. Plots of genome-wide chromatin accessibility were calculated as moving averages of ATAC-seq signal in a sliding window (window size, 55; bin size, 1), sorted based on gene expression. (F) Scatter plots of genome-wide RNA expression differences against promoter chromatin accessibility differences between class 1 and class 2 as a representative example. Each gene is represented by a point in the space of log2 of fold change between average RNA-seq reads per kilobase million (RPKM) values among the clones of each class (x-axis) against log2 of fold change between average ATAC-seq RPKM values calculated at the transcription start site (TSS) proximal region among the clones of each class (y-axis). (G) Representative genomic tracks of class-specific differences in enhancer chromatin accessibility among myeloid progenitors that precede the corresponding class-specific differences in gene expression among mature monocytes. For Bcl6 gene, multiple pairwise differences between classes were detected, and representative clones for all 4 classes are shown. For Bach1 and Fos, 1 class pair showed a difference: class 1 vs 2 and class 2 vs 3, respectively. Representative tracks for these class pairs are shown. (H) Class-specific monocyte expression signatures preceded by progenitor enhancer differences are enriched in key functional gene categories. (I) Enriched TF binding motifs among progenitor enhancers with class-specific differential ATAC-seq peaks that precede class-specific monocyte gene expression.
Monocyte subsets are primed epigenetically at the level of progenitor cells. (A) PCA plot of chromatin accessibility at ATAC-seq peaks in progenitors, and monocyte ATAC-seq reveals distinct patterns of chromatin accessibility among myeloid progenitors. (B) PCA of chromatin accessibility patterns in progenitors, with points colored based on functional classes of monocytes. (C) Representative genomic tracks of ATAC-seq tag density near cKit and CD11b genes with similar chromatin accessibility across all classes (boxed). (D) Representative genomic tracks of differential ATAC-seq tag density between classes (boxed). (E) Gene expression is associated with chromatin openness in myeloid progenitors. Plots of genome-wide chromatin accessibility were calculated as moving averages of ATAC-seq signal in a sliding window (window size, 55; bin size, 1), sorted based on gene expression. (F) Scatter plots of genome-wide RNA expression differences against promoter chromatin accessibility differences between class 1 and class 2 as a representative example. Each gene is represented by a point in the space of log2 of fold change between average RNA-seq reads per kilobase million (RPKM) values among the clones of each class (x-axis) against log2 of fold change between average ATAC-seq RPKM values calculated at the transcription start site (TSS) proximal region among the clones of each class (y-axis). (G) Representative genomic tracks of class-specific differences in enhancer chromatin accessibility among myeloid progenitors that precede the corresponding class-specific differences in gene expression among mature monocytes. For Bcl6 gene, multiple pairwise differences between classes were detected, and representative clones for all 4 classes are shown. For Bach1 and Fos, 1 class pair showed a difference: class 1 vs 2 and class 2 vs 3, respectively. Representative tracks for these class pairs are shown. (H) Class-specific monocyte expression signatures preceded by progenitor enhancer differences are enriched in key functional gene categories. (I) Enriched TF binding motifs among progenitor enhancers with class-specific differential ATAC-seq peaks that precede class-specific monocyte gene expression.
Furthermore, global analysis of genes highly expressed in the monocyte classes had evidence of chromatin openness in the respective progenitor clones (Figure 3E). This implies epigenetic priming of monocytes at the level of progenitor cells. Genome-wide, quantitative differences in promoter chromatin accessibility between myeloid progenitor classes had a modest correlation with quantitative transcriptional differences between monocyte classes (Figure 3F; supplemental Figure 3E-F). However, a considerable group of genes in the progenitors, named blueprint ATAC-seq peaks (Supplemental Table 3), showed class-specific differences of enhancer chromatin accessibility that preceded corresponding differences of gene expression in monocytes, but these were not transcriptionally manifested in myeloid progenitors themselves. For instance, genes that are important in myeloid lineages, such as Bcl6, Bach1, and Fos, had differential chromatin accessibility in the progenitors, but their expression levels were affected only in the descendant monocytes (Figure 3G). Figure 3G shows examples of ATAC-seq tracks at their proximal promoters and RNA-seq tracks at their gene bodies for representative clones from the classes that showed these differences. supplemental Figure 3G shows the complete sets of tracks for all clones at these genomic regions for Bcl6. This group of genes (supplemental Table 4) was enriched in the targets of key differentiation-related TFs and chromatin modifiers, including P300 and associated histone mark H3K27ac, Gata1, Bcl11a, Tet2, Lin28, and HDAC2 (Figure 3H). Furthermore, sequence motif analysis of the corresponding enhancer ATAC-seq peaks revealed binding motifs of key myeloid lineage markers (Figure 3I). We additionally performed de novo motif enrichment analysis using myeloid progenitor class-specific peaks for all classes (supplemental Table 4). Notably, most of these motifs were specific to each class, with only a small overlap between motifs enriched in different progenitor classes (supplemental Figure 3H). Altogether, these suggest that the class-specific epigenetic signatures in the vicinity of key differentiation genes in myeloid progenitors serve as a blueprint for class-specific gene expression in descendant cells.
CD49f and CD54 are markers that distinguish monocytic classes in mouse and human blood
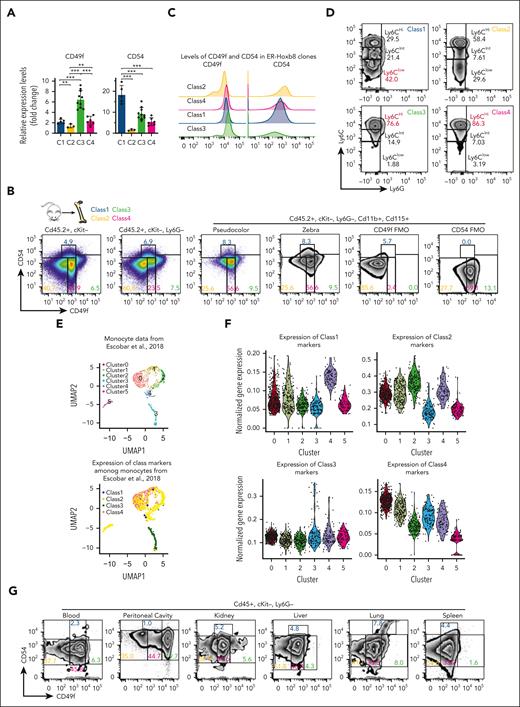
To determine whether the 4 monocytic classes could be identified in primary monocytes, we used the RNA-seq data to identify differentially expressed cell surface markers. Among these, CD49f and CD54 were candidates with associated antibodies against their gene products. The expression of these genes in each class was validated via RT-qPCR (Figure 4A; supplemental Table 5). CD49f is an integrin known for cell surface adhesion and signaling. CD54 is intercellular adhesion molecule 1 known to bind to CD11a and CD11b. Myeloid progenitor clones that give rise to class 1 and class 3 monocytes had open chromatin at CD54 and CD49f in myeloid progenitors, respectively (Figure 3D), and they had higher expression of these genes in descendant monocytes. Although immunomarkers derived from DEG data often do not provide easily separated populations,36 they can be used with cytometry gates validated using Fluorescence Minus One controls, which we did to discriminate the classes of monocytes. CD49f/CD54 were used to isolate each class of monocytes (CD45+, cKit–, Ly6G–, CD11b+, and CD115+) from primary mouse BM (Figure 4B; supplemental Figure 4A-C). At steady-state, class 4 monocytes were the most prevalent, whereas class 1 cells were the least. ER-Hoxb8 monocytic clones were confirmed to express CD49f and CD54 per the class (Figure 4C). Similar to transcriptomic profiling, sorted primary monocytes resembled classical, intermediate, and nonclassical monocytes regarding Ly6C levels (Figure 4D; supplemental Figure 4D). However, unexpectedly, the levels of Cx3cr1, Ccr2, and CD43 of our monocytic subsets do not correlate with previously known monocytic classes (supplemental Figure 4E). To better understand the correlation between our defined monocytic subsets and previously known classification, we performed RNA-seq of primary murine monocytes using our CD49f/CD54 sorting schema and the classical and nonclassical schema. Although we observed similarities between class 1/class 2 with nonclassical and class 3/class 4 with classical primary monocytes (supplemental Figure 4F; supplemental Table 6), they did not correlate based on gene expression, suggesting that the functionally defined classification schema groups cells distinctively from the classical and nonclassical monocyte categories. Additionally, we compared RNA-seq of primary murine monocytes using CD49f/CD54 with published primary monocyte scRNA-seq.37 Transcriptional signatures of class 1 to class 4 monocytes project into different subsets of mouse primary monocytes scRNA-seq data (Figure 4E-F, supplemental Table 6). These demonstrate that our functionally and transcriptionally distinct myeloid progenitor–defined classes of monocytes exist in vivo.
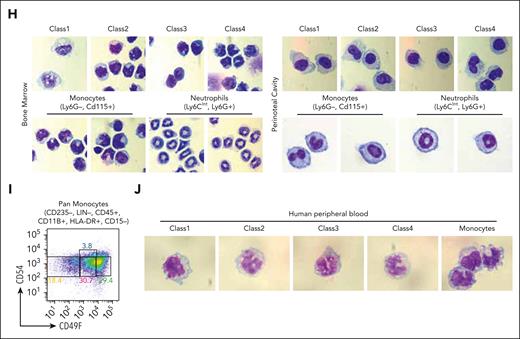
CD49f and CD54 are class-specific markers of monocytic cells in mouse and human blood. (A) RT-qPCR of ER-Hoxb8 monocytic clones showing that CD49f and CD54 are differentially expressed in each class. (B) Representative FACS plots showing CD49f and CD54 reveal distinct subgroups of murine primary BM monocytes (n >10 independent experiments). (C) Histograms showing CD49f and CD54 expression in ER-Hoxb8 monocytic clones during steady conditions (n = 3 independent experiments, in triplicate technical replicates). (D) Representative FACS plots showing Ly6C levels in each class of primary mouse monocytes (n > 10 independent experiments). (E) (Top) UMAP plot of previously published primary monocyte scRNA-seq data colored based on unsupervised cell clusters per the overall gene expression and assigned using Seurat. (Bottom) The same UMAP plot was colored based on the class assignment to each cell per the class-specific gene signatures derived from our bulk RNA-seq data (Figure 2F). Classes largely occupy separate regions of UMAP plot. Class 1 is present but assigned to only a few cells. (F) Violin plots of normalized expression values for each class-specific gene signature in 6 unsupervised clusters defined using Seurat in panel E. See “Methods” for details. (G) Representative FACS plots showing CD49f and CD54 can distinguish subgroups of monocytes in multiple murine tissues (n = 3 independent experiments, using 3 mice each). (H) Wright-Giemsa staining of sorted murine cells confirming monocytic morphologies of sorted monocytes or neutrophils as indicated (original magnification ×100). (I) Representative FACS plots showing CD49F and CD54 can distinguish subgroups of human primary monocytes from peripheral blood (n = 2 independent experiments, using 2-3 donors each experiment). (J) Wright-Giemsa staining of sorted human monocytic cells (original magnification ×100). ∗P < .05; ∗∗P < .01; ∗∗∗P < .005.
CD49f and CD54 are class-specific markers of monocytic cells in mouse and human blood. (A) RT-qPCR of ER-Hoxb8 monocytic clones showing that CD49f and CD54 are differentially expressed in each class. (B) Representative FACS plots showing CD49f and CD54 reveal distinct subgroups of murine primary BM monocytes (n >10 independent experiments). (C) Histograms showing CD49f and CD54 expression in ER-Hoxb8 monocytic clones during steady conditions (n = 3 independent experiments, in triplicate technical replicates). (D) Representative FACS plots showing Ly6C levels in each class of primary mouse monocytes (n > 10 independent experiments). (E) (Top) UMAP plot of previously published primary monocyte scRNA-seq data colored based on unsupervised cell clusters per the overall gene expression and assigned using Seurat. (Bottom) The same UMAP plot was colored based on the class assignment to each cell per the class-specific gene signatures derived from our bulk RNA-seq data (Figure 2F). Classes largely occupy separate regions of UMAP plot. Class 1 is present but assigned to only a few cells. (F) Violin plots of normalized expression values for each class-specific gene signature in 6 unsupervised clusters defined using Seurat in panel E. See “Methods” for details. (G) Representative FACS plots showing CD49f and CD54 can distinguish subgroups of monocytes in multiple murine tissues (n = 3 independent experiments, using 3 mice each). (H) Wright-Giemsa staining of sorted murine cells confirming monocytic morphologies of sorted monocytes or neutrophils as indicated (original magnification ×100). (I) Representative FACS plots showing CD49F and CD54 can distinguish subgroups of human primary monocytes from peripheral blood (n = 2 independent experiments, using 2-3 donors each experiment). (J) Wright-Giemsa staining of sorted human monocytic cells (original magnification ×100). ∗P < .05; ∗∗P < .01; ∗∗∗P < .005.
Using CD49f/CD54 as markers, 4 primary monocyte subsets were sorted from different tissues (Figure 4G). Similar proportions of blood monocyte classes in multiple tissues were observed (supplemental Figure 4G). The sorted cells had morphologic features of monocytes in all subsets after Wright-Giemsa staining (Figure 4H). In addition, 5-bromo-2′-deoxyuridine (BrdU) incorporation showed that class 1 through class 4 primary monocytes had similar proliferation rates in C57BL/6 mice (supplemental Figure 4H).
Then, we examined whether these monocytic classes also exist in human blood. CD49F/CD54 could again be used as markers to discriminate the 4 classes of monocytes in human blood (Figure 4I-J; supplemental Figure 4I). The marker genes identified in the ER-Hoxb8 system can be used to isolate subsets of both mouse and human primary monocytes.
Each primary monocyte class exhibits a distinct phenotype upon bacterial infection
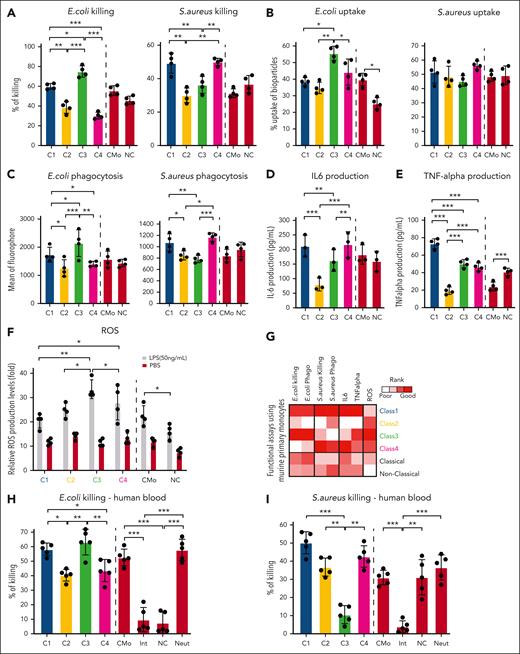
We performed the same in vitro and in vivo functional assays that were used with ER-Hoxb8–derived monocytes on primary mouse monocytes sorted using CD49f/CD54. Similar to ER-Hoxb8 monocytic clones, primary monocytes showed distinct functional patterns (Figure 5A-F). Class 3 monocytes were efficient at killing E coli and generating ROS, whereas class 4 monocytes preferentially cleared S aureus over E coli, in addition to class 1 being efficient at both killing bacteria and producing TNF-α. Notably, the most efficient functional monocytes from our defined subgroups were more robust in the tested functions than cells isolated using traditional classical and nonclassical monocyte isolation methods (Figure 5G).
Each monocytic class exhibits distinct phenotypes upon bacterial infection. (A-F) Bar graphs showing each class of primary murine monocytes have varying capacities to perform monocytic functions (n = 4 independent experiments, in triplicate technical replicates). Killing assays, cytokine production enzyme-linked immunosorbent assay, and ROS assays were performed in vitro. Bacterial uptake refers to cells taking up dead bacteria, whereas phagocytosis is the ingestion of heat-killed bacteria. Bacterial uptake and phagocytosis were performed in vivo. (G) Heatmap summarizing in vitro and in vivo functional assays of primary murine monocytes. (H-I) Bar graphs showing each class of human peripheral blood monocytes (using gating strategy of class monocytes in Figure 4I. Classical monocytes: CD235–, LIN–, CD45+, CD11B+, HLA-DR+, CD15–, CD14+, and CD16–. Intermediate monocytes: CD235–, LIN–, CD45+, CD11B+, HLA-DR+, CD15–, CD14+, and CD16+. Nonclassical monocytes: CD235–, LIN–, CD45+, CD11B+, HLA-DR+, CD15–, CD14–, and CD16+. Neutrophils: CD235–, LIN–, CD45+, CD11B+, HLA-DR+, and CD15+) have varying capacities to phagocytose in vitro (n = 2 independent experiments, using 2-3 donors each experiment in duplicate technical replicates). A mixed model analysis of variance was used for the statistical test. ∗P < .05; ∗∗P < .01; ∗∗∗P < .005. Statistical tests were performed within classes 1 to 4 monocytes or controls.
Each monocytic class exhibits distinct phenotypes upon bacterial infection. (A-F) Bar graphs showing each class of primary murine monocytes have varying capacities to perform monocytic functions (n = 4 independent experiments, in triplicate technical replicates). Killing assays, cytokine production enzyme-linked immunosorbent assay, and ROS assays were performed in vitro. Bacterial uptake refers to cells taking up dead bacteria, whereas phagocytosis is the ingestion of heat-killed bacteria. Bacterial uptake and phagocytosis were performed in vivo. (G) Heatmap summarizing in vitro and in vivo functional assays of primary murine monocytes. (H-I) Bar graphs showing each class of human peripheral blood monocytes (using gating strategy of class monocytes in Figure 4I. Classical monocytes: CD235–, LIN–, CD45+, CD11B+, HLA-DR+, CD15–, CD14+, and CD16–. Intermediate monocytes: CD235–, LIN–, CD45+, CD11B+, HLA-DR+, CD15–, CD14+, and CD16+. Nonclassical monocytes: CD235–, LIN–, CD45+, CD11B+, HLA-DR+, CD15–, CD14–, and CD16+. Neutrophils: CD235–, LIN–, CD45+, CD11B+, HLA-DR+, and CD15+) have varying capacities to phagocytose in vitro (n = 2 independent experiments, using 2-3 donors each experiment in duplicate technical replicates). A mixed model analysis of variance was used for the statistical test. ∗P < .05; ∗∗P < .01; ∗∗∗P < .005. Statistical tests were performed within classes 1 to 4 monocytes or controls.
Next, we examined whether the functional phenotypes of sorted monocytic classes found in mice also occur in humans. Indeed, we observed similar functional distinction in the capacity of each class to conduct bacterial killing (Figure 5H-I). These resolve the functional attributes of monocytes in more than traditional classical and nonclassical categories.
Limited plasticity of functional blood monocyte subsets
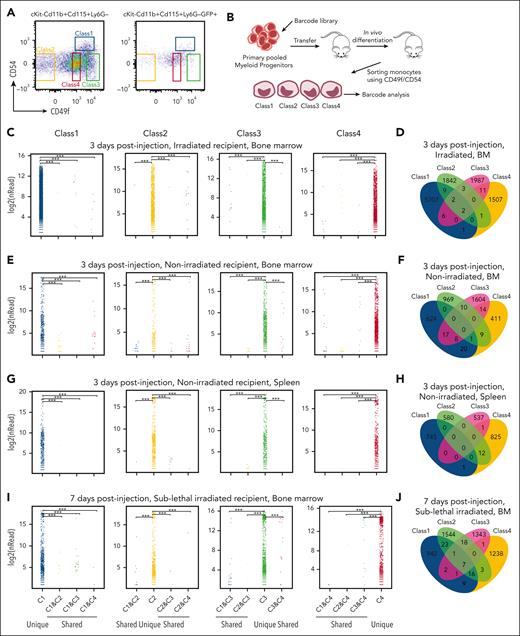
To determine whether interconversion occurred between cell classes during homeostasis, we sorted primary progenitor cells (CD45+, Lin–, cKit+, Sca–, CD16/32+, and CD34) (supplemental Figure 5). Pooled primary myeloid progenitors were then transduced with a high-complexity barcode library, pRSI9-U6-(sh)-UbiC-TagRFP-2A-Puro, to enable high-resolution clonal tracing in vivo (Figure 6A-B). These barcoded progenitor cells were transferred into lethally irradiated mice and allowed to differentiate in vivo. Blood monocytes were isolated 72 hours later. The monocytes were sorted into the 4 different classes of primary monocytes based on CD49f/CD54. Cells in each class were then analyzed via DNA sequencing to define whether individually labeled myeloid progenitors yielded monocytes restricted to a particular class or randomly contributed to all 4 subsets. Strikingly, barcodes were restricted to a particular monocyte subclass (Figure 6C; supplemental Table 7) often with multiple cells in the class bearing the same barcode. Although barcodes overlapping subsets were found, they were significantly underrepresented with small numbers of reads compared with hundreds to thousands of reads within a class (Figure 6D; supplemental Table 7), consistent with sorting contamination.
Limited plasticity of functional blood monocyte subsets. (A) Gating strategy of barcode-labeled primary mouse monocytes using CD49/CD54f markers. (B) Experimental scheme of clonal tracing experiment. (C) Representative jitter plots displaying the log2 number of reads for barcodes in each monocytic class of irradiated recipient mice BM (n = 5 mice). (D) A Venn diagram showing the number of overlapping and unique barcodes that are derived from myeloid progenitors found in monocytic classes of irradiated recipient mice BM (n = 5 mice). (E) Representative jitter plots of nonirradiated recipient mice BM (n = 4 mice). (F) A Venn diagram of nonirradiated recipient mice BM (n = 4 mice). (G) Representative jitter plots of nonirradiated recipient mice spleen (n = 2 mice). (H) A Venn diagram of nonirradiated recipient mice spleen (n = 2 mice). (I) Representative jitter plots of sublethally irradiated recipient mice BM at 7 days after injection (n = 2 mice). (J) A Venn diagram of sublethally irradiated recipient mice BM at 7 days after injection (n = 2 mice). Hypergeometric test shows P < .005 of the significance of overlapping barcodes. (K) A graph showing changes in Ly6C levels of each class primary monocytes upon different amounts (1 × 10⁸ colony-forming unit in 200 μL) of bacterial infection in vivo.
Limited plasticity of functional blood monocyte subsets. (A) Gating strategy of barcode-labeled primary mouse monocytes using CD49/CD54f markers. (B) Experimental scheme of clonal tracing experiment. (C) Representative jitter plots displaying the log2 number of reads for barcodes in each monocytic class of irradiated recipient mice BM (n = 5 mice). (D) A Venn diagram showing the number of overlapping and unique barcodes that are derived from myeloid progenitors found in monocytic classes of irradiated recipient mice BM (n = 5 mice). (E) Representative jitter plots of nonirradiated recipient mice BM (n = 4 mice). (F) A Venn diagram of nonirradiated recipient mice BM (n = 4 mice). (G) Representative jitter plots of nonirradiated recipient mice spleen (n = 2 mice). (H) A Venn diagram of nonirradiated recipient mice spleen (n = 2 mice). (I) Representative jitter plots of sublethally irradiated recipient mice BM at 7 days after injection (n = 2 mice). (J) A Venn diagram of sublethally irradiated recipient mice BM at 7 days after injection (n = 2 mice). Hypergeometric test shows P < .005 of the significance of overlapping barcodes. (K) A graph showing changes in Ly6C levels of each class primary monocytes upon different amounts (1 × 10⁸ colony-forming unit in 200 μL) of bacterial infection in vivo.
In addition, in vivo differentiation in nonirradiated recipient mice assessed the steady-state context. Consistently, barcodes were represented in a single immunophenotypic class of monocytes. This was observed in the blood and BM (Figure 6E-F; supplemental Table 7) as well as in other tissues, such as those of the spleen and lung (Figure 6G-H; supplemental Table 7). We further examined barcode representation at a longer time point. Again, barcodes were restricted to a particular monocyte subclass even after 1 week after injection (Figure 6I-J; supplemental Table 7).38 These data demonstrate that myeloid progenitors are programmed to become specific functional monocytes with limited plasticity to contribute to multiple classes, at least under homeostasis or after irradiation.
Next, we tested whether limited plasticity pertains to conditions of stress. We added peptidoglycans of gram-negative E coli or gram-positive S aureus bacteria into the culture media during class-specific myeloid progenitor differentiation over 5 days and did not observe changes in surface expression of the indicator proteins, CD49f and CD54, and other key distinctively expressed monocyte markers, Ly6C, CD115, F4/80, and major histocompatibility complex class II (MHCII) (supplemental Figure 6A-D). Similarly, expression levels of indicator proteins did not vary after bacterial infection both in vitro and in vivo (supplemental Figure 6E-H).
To test the stability of Ly6C levels in each monocytic class, Ly6C levels were examined 4 days after transplantation of ER-Hoxb8 progenitor clones IV injected into wild-type and Ccr2 knockout (KO) mice. The Ccr2 chemokine receptor is critical for monocyte and macrophage infiltration of tissues. Ccr2 KO mice have endogenous monocytes that are unable to be recruited into an infected tissue during the immune response. These mice were infected with E coli or S aureus intraperitoneally 3 hours before analysis. The Ly6C levels of classes 1 to 4 monocytes were shifted from Ly6CHi to Ly6CLow when increasing numbers of bacteria were used in the infection (Figure 6K; supplemental Figure 6I-J). Therefore, Ly6C expression varies within each monocyte class, further supporting the notion that these are orthogonal means of categorizing monocytes.
Class-specific monocytes are selected based on physiological challenges
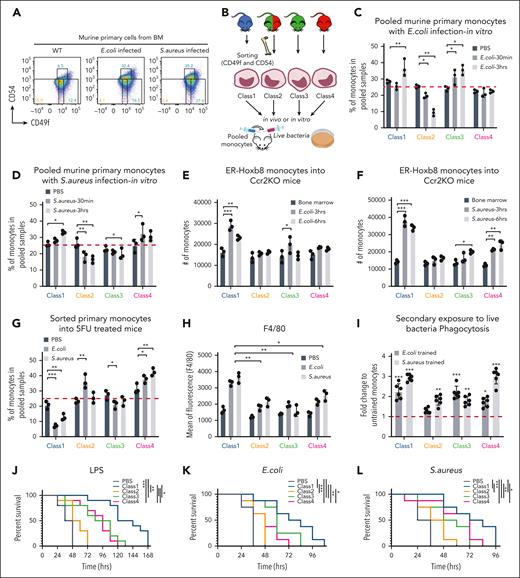
To further test whether cells alter their fate between classes or classes are selected during infection, we evaluated monocyte class populations in the BM before and after E coli or S aureus peritonitis. The proportion and absolute number of class 1 monocytes dramatically increased with septic challenge (Figure 7A; supplemental Figure 7A), suggesting either class 1 monocytes proliferate in response to infection or monocytes switch identity to class 1. To answer this question, we sorted each class of primary monocyte from a different fluorescently labeled engineered mouse strain (ie, each class genetically bore a different fluorophore), pooled them, and incubated the sorted cells with live bacteria in vitro (Figure 7B). After 3 hours of infection, the proportions of monocytes in the pooled samples changed (Figure 7C-D; supplemental Figure 7B). Although class 1/3 and class 1/4 monocytes increased upon E coli and S aureus exposure respectively, class 2 monocytes decreased (Figure 7C-D). In addition, the level of F4/80 in class 1 increased compared with other classes (supplemental Figure 7C), indicating a class-specific response to bacteria. Notably, the class-specific responses did not converge, and the classes did not interconvert.
Class-specific monocytes are selected based on physiological challenges. (A) Representative FACS plots showing changes in the proportions of monocytic classes after 3 hours of bacterial infection in vivo (n = 3 independent experiments, using 3 mice for each). (B) Experimental scheme of functional assays (Figure 7C-D; supplemental Figure 7B-C) that evaluate selection vs induction of primary murine monocytes upon bacterial infection. The fluorophores labeled for each class of monocytes were used in different combinations as well. (C-D) Bar graphs showing the percentage of primary monocyte subsets left in pooled samples after live E coli and S aureus infection, respectively, in vitro (n = 3 independent experiments, using 3 mice for each). (E-F) Bar graphs showing the number of ER-Hoxb8 monocytes found in the BM (black) or peritoneal cavity (dark gray and light gray) of Ccr2 KO mice after heat-killed E coli and S aureus infection, respectively, in vivo (n = 3 mice). The cells from the BM were used as baseline to define the proportion of each injected monocyte class. (G-H) Bar graphs showing percentage of primary monocyte subsets left in pooled samples and F4/80 expression levels after 24 hours of live bacterial infection into 5FU-treated mice in vivo, respectively (n = 3 independent experiments, using 3 mice each). Statistical tests were done against phosphate-buffered saline (G). (I) Bar graphs showing phagocytosis efficiency in secondary exposure to live bacteria. (J) Survival curves of sublethally irradiated mice with injection of individual ER-Hoxb8 clones followed by infection with LPS (n = 8 mice with 2 independent experiments). (K-L) Survival curves of lethally irradiated mice with injection of ER-Hoxb8 monocytic clones followed by live bacterial infection (n = 10 mice with 2 independent experiments). A mixed model analysis of variance was used for the statistical test (C-D,G-H). ∗P < .05; ∗∗P < .01; ∗∗∗P < .005.
Class-specific monocytes are selected based on physiological challenges. (A) Representative FACS plots showing changes in the proportions of monocytic classes after 3 hours of bacterial infection in vivo (n = 3 independent experiments, using 3 mice for each). (B) Experimental scheme of functional assays (Figure 7C-D; supplemental Figure 7B-C) that evaluate selection vs induction of primary murine monocytes upon bacterial infection. The fluorophores labeled for each class of monocytes were used in different combinations as well. (C-D) Bar graphs showing the percentage of primary monocyte subsets left in pooled samples after live E coli and S aureus infection, respectively, in vitro (n = 3 independent experiments, using 3 mice for each). (E-F) Bar graphs showing the number of ER-Hoxb8 monocytes found in the BM (black) or peritoneal cavity (dark gray and light gray) of Ccr2 KO mice after heat-killed E coli and S aureus infection, respectively, in vivo (n = 3 mice). The cells from the BM were used as baseline to define the proportion of each injected monocyte class. (G-H) Bar graphs showing percentage of primary monocyte subsets left in pooled samples and F4/80 expression levels after 24 hours of live bacterial infection into 5FU-treated mice in vivo, respectively (n = 3 independent experiments, using 3 mice each). Statistical tests were done against phosphate-buffered saline (G). (I) Bar graphs showing phagocytosis efficiency in secondary exposure to live bacteria. (J) Survival curves of sublethally irradiated mice with injection of individual ER-Hoxb8 clones followed by infection with LPS (n = 8 mice with 2 independent experiments). (K-L) Survival curves of lethally irradiated mice with injection of ER-Hoxb8 monocytic clones followed by live bacterial infection (n = 10 mice with 2 independent experiments). A mixed model analysis of variance was used for the statistical test (C-D,G-H). ∗P < .05; ∗∗P < .01; ∗∗∗P < .005.
Next, we injected equal cell numbers of all 4 classes of ER-Hoxb8 monocytic clones with each clone bearing a clone-specific, distinct fluorescent tag into the same lethally irradiated Ccr2 KO mice using IV injection. Thereafter, bacteria were injected into the peritoneal cavity of the same Ccr2 KO recipient mice (supplemental Figure 7D). Interestingly, significant numbers of monocytes bearing the fluorescent tag of class 1 were then found in the peritoneal fluid after 3 hours of bacterial infection. By 6 hours, the number of class 1 monocytes decreased (Figure 7E-F). To validate these pooled monocyte behaviors in vivo, we injected bacteria with equal numbers of our sorted primary monocyte subsets intraperitoneally into Ccr2 KO or fluorouracil (5FU)-treated mice. Both Ccr2 KO and 5FU-treated mice were used to clear out endogenous monocytes. Intraperitoneal cell numbers were quantified after 24 hours. Despite class 3 specializing in killing E coli and class 4 specializing in killing S aureus, proportions of class 1 were the most affected (Figure 7G; supplemental Figure 7E). Notably, the other classes of cells did not undergo a state shift to acquire the class 1–like state to accumulate in the peritoneal cavity with bacterial infection (supplemental Figure 7F). These aggregated data support a selection of class 1 cells over induction of class 1–like monocytes in vivo. Furthermore, these data suggest that class 1 monocytes either undergo cell death or become activated, exiting from the blood to tissues. We observed no induction of annexin V indicative of apoptosis (supplemental Figure 7G). Systemically administered class 1 ER-HoxB8–derived monocytic cells preferentially entered the infected peritoneal cavity. Therefore, class 1 cells are distinctive in their response to infectious challenges in vivo.
To determine whether our findings had implications for clinical settings, sublethally irradiated mice received individual myeloid progenitor clones IV. After in vivo differentiation over 4 days, LPS was intraperitoneally injected (supplemental Figure 7H). Class 1 progenitor infusion significantly increased the survival rates compared with the infusion of other myeloid progenitor classes (Figure 7J). Next, we lethally irradiated mice, followed by injecting them with monocytic clones and bacteria on the same day (supplemental Figure 7I). Transfer of class 1 cells into recipient mice increased the survival rates most significantly (Figure 7K-L). These findings are consistent with the class-specific functions being maintained in stress and that class1 monocytes provide a preferential benefit under conditions resembling sepsis.
Discussion
Myeloid progenitors and monocytes play pivotal roles in innate immunity and can be defined by specific surface marker combinations and morphologies. Although single-cell technologies have revealed novel heterogeneity in myeloid progenitors and monocyte populations,17,39 it is still not fully understood how heterogeneity develops and to what extent it is plastic in response to physiologic challenges. Previously, we used a myeloid progenitor clonal expansion and differentiation protocol that allowed us to clonally expand individual primary myeloid progenitors and differentiate them into monocytes.29,30 By taking advantage of this system, we reveal that myeloid progenitors give rise to 4 subsets of monocytes classified based on their functions and corresponding gene expression signatures. By tracing monocytes from each functional class back to their original progenitors, we reveal that monocytic functional heterogeneity is predefined with different chromatin accessibility profiles at least at the progenitor state, although we cannot exclude that it occurred earlier. Prior scATAC-seq of human primary GMPs also indicates distinct clusters.40 These findings provide evidence that functional subpopulations of monocytic cells are specified at the progenitor level and may not be as fluid in response to external stimuli as some models suggest.
The constraints on subpopulation identity at the mature cell level was evident in vivo. Monocytic cells present in an infected peritoneum were predominantly class 1; the circulating cells that contributed to them were from class 1 progenitor clones; there were class-specific functions in vitro and in vivo with both ER-Hoxb8–derived and primary monocytes, and these functions were distinctive enough to provide class-specific effects on survival from septic challenge. The data argue that subset transitions do not occur even with extreme physiological challenges, which resembles adaptive immune system in which cell populations have a defined, bounded reactivity, although enforced by very different means. Our studies further suggest that representation of different functional classes may provide benefits in overcoming specific challenges like infection. Future work is necessary to determine whether mechanisms that control heterogeneity become awry during disease or whether new therapies can be developed based on selective manipulation of monocytic heterogeneity or transfer of specific subsets.
Acknowledgments
The authors thank the Harvard Stem Cell Institute-Center for Regenerative Medicine Flow Cytometry Core Facility at Massachusetts General Hospital for technical assistance with FACS sorting and Bauer Core Facility at Harvard University and NextGen Sequencing Core at Massachusetts General Hospital for high-throughput sequencing assistance. The authors also thank summer students Adrian Berg, Giovanna Mantica, and Andrea Vanzulli for their participation in the project.
This work was supported by the National Heart, Lung, and Blood Institute, National Institutes of Health (grants HL131477 and HL142494) (D.T.S.) and the Gerald and Darlene Jordan Chair at Harvard Medical School (D.T.S.). C.R. was a recipient of the Kirschstein National Research Service Award Institutional Research Training Grant (T32) program. H.K was a recipient of The Uehara Memorial Foundation and Japan Society for the Promotion of Science Overseas Research Fellowship. G.S. was supported by EMBO long-term fellowship (ALTF-743-2018).
Authorship
Contribution: C.R. initiated the project, designed and performed experiments, and wrote the manuscript; E.W.S., G.S., M.C.M., P.L.C., H.K., and F.F.H. designed and performed experiments and analyzed data; L.P.W., M.M., and B.-K.L. analyzed sequencing data; B.-K.L., J.K., M.N., M.K.M., D.B.S., and R.I.S. provided thoughtful advice; D.T.S. initiated the project, analyzed data, provided supervision, and wrote the manuscript; and all authors helped to edit the manuscript and approved the final manuscript.
Conflict-of-interest disclosure: D.T.S. is a founder, director, and stockholder of Magenta Therapeutics, Clear Creek Bio, and Lightning Biotherapeutics; a director of Agios Pharmaceuticals, Editas Medicines, and Sonata Therapeutics; a founder and equity holder of Fate Therapeutics and Geruda Therapeutics; and a consultant for VcanBio and Simcere Zaiming. The remaining authors declare no competing financial interests.
Correspondence: David T. Scadden, Massachusetts General Hospital, Harvard Stem Cell Institute, 185 Cambridge St, Boston, MA 02114; e-mail: david_scadden@harvard.edu.
References
Author notes
RNA-seq and ATAC-seq data have been deposited in the National Center for Biotechnology Information Gene Expression Omnibus database (accession number GSE176050).
Original data are available on request from the corresponding author, David Scadden (david_scadden@harvard.edu).
The online version of this article contains a data supplement.
There is a Blood Commentary on this article in this issue.
The publication costs of this article were defrayed in part by page charge payment. Therefore, and solely to indicate this fact, this article is hereby marked “advertisement” in accordance with 18 USC section 1734.


This feature is available to Subscribers Only
Sign In or Create an Account Close Modal