Abstract
The erythroid-specific isoform of δ-aminolevulinate synthase (ALAS-E) catalyzes the first step of heme biosynthesis in erythroid cells, and ALAS-E gene mutations are known to be responsible for x-linked sideroblastic anemia. To study the role of ALAS-E in erythroid development, we prepared mouse embryonic stem (ES) cells carrying a disrupted ALAS-E gene and examined the effect of the lack of ALAS-E gene expression on erythroid differentiation. We found that mRNAs for erythroid transcription factors and TER119-positive cells were increased similarly both in the wild-type and mutant cells. In contrast, heme content, the number of benzidine-positive cells, adult globin protein, and mRNA for β-major globin were significantly decreased in the mutant cells. These results were confirmed using another ES differentiation system in vitro and suggest that ALAS-E expression, hence heme supply, is critical for the late stage of erythroid cell differentiation, which involves hemoglobin synthesis.
δ-AMINOLEVULINATE synthase (ALAS) is the first and rate-limiting enzyme in heme biosynthesis.1There are two tissue-specific isozymes of this enzyme, ie, the nonspecific isoform (ALAS-N) expressed ubiquitously and the erythroid-specific isoform (ALAS-E) expressed exclusively in erythroid cells.2 The human ALAS-N gene, ALAS1, has been assigned to chromosome 3p21,3 while the ALAS-E gene,ALAS2, to a distal subregion of band Xp11.2.4 In Friend virus-transformed murine erythroleukemia (MEL) cells, mRNA for ALAS-E was found to increase markedly when MEL cells were induced to undergo erythroid differentiation by treatment with chemicals such as dimethylsulfoxide, while ALAS-N mRNA decreased rapidly, suggesting that the upregulation of the ALAS-E gene is essential in erythroid development.5 Several point mutations in the ALAS-E gene have been described in human patients with x-linked sideroblastic anemia, also indicating the critical involvement of ALAS-E in the development of anemia in this disorder.6 7
It is not clear, however, what effects the lack of ALAS-E expression may have on erythropoiesis of normal hematopoietic cells. This question is particularly intriguing because globin mRNA translation is known to be regulated by the phosphorylation of the α-subunit of eukaryotic translation initiation factor (eIF-2α) by the heme-regulated eIF-2α kinase (HRI).8 It is possible therefore that deficient heme synthesis may activate HRI and thus inhibit protein synthesis in ALAS-E–deficient erythroid cells. Alternatively, heme may be required in an early stage of erythroid cell differentiation, which involves expression of various erythroid specific genes.
To address this question, we disrupted genetically the expression of ALAS-E in embryonic stem (ES) cells and analyzed the effect of the lack of ALAS-E on erythroid cell differentiation by using two different in vitro differentiation systems of ES cells. ES cells are derived from the inner cell mass of blastocysts9 and maintained in the totipotent state in culture with feeder cells, or in the presence of leukemia inhibitory factor (LIF), and they can contribute to somatic and germ line tissues when reintroduced into blastocysts.10In the first system, ES cells were cultivated in the presence of LIF and were then let to differentiate by withdrawal of LIF from the culture medium, and to form a three-dimensional structure termed embryoid bodies (EBs), which contain various differentiated cell types, including hematopoietic cells.11 Because the process of hematopoietic development in EBs resembles normal hematopoiesis, this system has been used for the analysis of genetic regulation of hematopoietic cell differentiation12 and studies on the effects of specifically introduced mutations on development of hematopoietic cells.13,14 An alternative ES cell differentiation system has recently been developed in which ES cells are cocultured on a layer of OP9 feeder cells,15 which permits ES cells to preferentially differentiate into hematopoietic lineage cells, without forming embryoid bodies.
The results of the two independent ES cell differentiation systems showed that, whereas erythroid transcription factors were expressed normally and a similar number of TER119-positive cells were observed both in the wild-type and ALAS-E(-) ES cells, there was no increase in the formation of heme and adult hemoglobin in ALAS-E(-) ES cells. Especially, adult β-major globin level was significantly lower in ALAS-E(-) EBs than in the wild-type EBs, suggesting that HRI may be activated by heme deficiency in ALAS-E(-) ES cell-derived erythroid cells. These findings indicate that the early stage of erythroid differentiation can be triggered without the presence of ALAS-E, however, ALAS-E expression, hence increased heme biosynthesis, is essential for the late stage in the development of erythroid cells including hemoglobinized erythroid cells.
MATERIALS AND METHODS
Construction of a targeting vector.
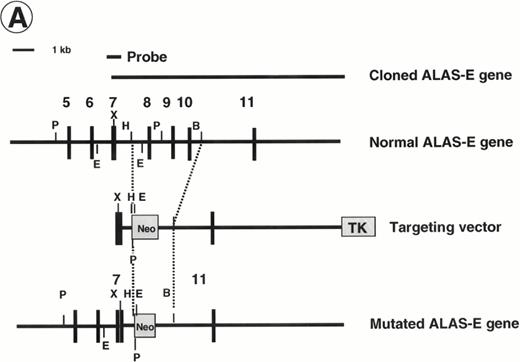
A replacement-type ALAS-E targeting vector was assembled in a modified plasmid pSP72 (Promega, Madison, WI), which had an additionalNot I site and a Pac I site introduced between the SP6 promoter sequence and Xho I site. As a selection marker, a Neomycin-resistance cassette from pMCneo, which contained a stop codon,16 was subcloned into Sal I site. As a 5′-homology region, a 0.8-kb Xho I/HindIII fragment, including a part of exon 7, was subcloned into theXho I/HindIII site. As a 3′-homology region, a 10-kb BamHI/Sal I fragment, including exon 11, was subcloned into the BamHI site after converting an Sal I site to a BamHI site. A herpes simplex virus thymidine-kinase cassette was subcloned into an Not I site (Fig 1A). The final construct was linearized by Pac I digestion.
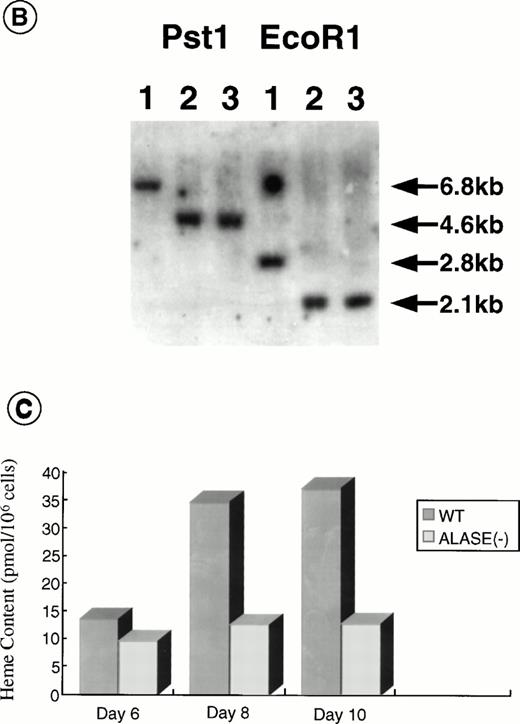
Disruption of the ALAS-E gene in mouse ES cells. (A) Strategy for ALAS-E gene targeting. A phage clone encoding a part of mouse ALAS-E gene was cloned independently in our laboratory and is shown in the upper side of (A) along with the normal mouse ALAS-E gene. A probe used for Southern blotting in (B) is also shown. Maps of the targeting construct and the predicted structure of the targeted ALAS-E allele are shown in the lower lines of (A). (B) Southern blot analysis of ES clones. A linearized construct was electroporated into J1 and CCE cells and 20 mg of genomic DNA was isolated from clones selected in the presence of Neomycin and Gancyclovir. The DNA samples were digested with Pst I or EcoRI and examined by Southern blot analysis. 6.8-kb and 4.6-kb bands detected after digestion withPst I represent the wild-type and the disrupted allele, respectively, while 2.8-kb and 2.1-kb bands detected after digestion with EcoRI represent the wild-type and the disrupted allele, respectively. DNA samples are from wild-type CCE cells (lane 1), ALAS-E(-) J1 cells (lane 2), or ALAS-E(-) CCE cells (lane 3). (C) Heme content in differentiating EBs. Heme content of EBs of day 6, 8, and 10 was determined fluorometrically33 using 1 × 10⁵ cells, which were dissociated from EBs into single cells by incubation in a collagenase solution. Data are the mean of three separate experiments.
Disruption of the ALAS-E gene in mouse ES cells. (A) Strategy for ALAS-E gene targeting. A phage clone encoding a part of mouse ALAS-E gene was cloned independently in our laboratory and is shown in the upper side of (A) along with the normal mouse ALAS-E gene. A probe used for Southern blotting in (B) is also shown. Maps of the targeting construct and the predicted structure of the targeted ALAS-E allele are shown in the lower lines of (A). (B) Southern blot analysis of ES clones. A linearized construct was electroporated into J1 and CCE cells and 20 mg of genomic DNA was isolated from clones selected in the presence of Neomycin and Gancyclovir. The DNA samples were digested with Pst I or EcoRI and examined by Southern blot analysis. 6.8-kb and 4.6-kb bands detected after digestion withPst I represent the wild-type and the disrupted allele, respectively, while 2.8-kb and 2.1-kb bands detected after digestion with EcoRI represent the wild-type and the disrupted allele, respectively. DNA samples are from wild-type CCE cells (lane 1), ALAS-E(-) J1 cells (lane 2), or ALAS-E(-) CCE cells (lane 3). (C) Heme content in differentiating EBs. Heme content of EBs of day 6, 8, and 10 was determined fluorometrically33 using 1 × 10⁵ cells, which were dissociated from EBs into single cells by incubation in a collagenase solution. Data are the mean of three separate experiments.
Transfection and screening of ES cells.
CCE ES cells,17 kindly provided by Dr P. Pandolfi (Memorial Sloan-Kettering Cancer Center, New York, NY), were maintained on mitomycin-treated STO feeder cells. J1 ES cells18 were maintained on irradiated primary cultures of embryonic mouse fibroblasts. Cell culture and electroporation were performed as described previously.19 Clones selected in G418 (400 μg/mL) and gancyclovir (2 mmol/L) were subjected to Southern blot analysis to confirm a specific recombination allele. For Southern blot analysis, genomic DNA was isolated by digesting cells in a lysis buffer containing 1% sodium dodecyl sulfate (SDS), 625 μg/mL proteinase K, 100 mmol/L NaCl, 10 mmol/L Tris (pH7.5), and 1 mmol/L EDTA, at 55°C overnight and spooling after ethanol precipitation. After digestion with EcoRI or Pst I, the Southern blots were probed with a 0.6-kb fragment corresponding to an external 5′-homology region of the targeting vector, or the Neo cassette (Fig 1A).
In vitro differentiation of ES cells.
Differentiation of ES cells in semisolid culture was induced according to the method described previously.20 To remove feeder layer cells, cells were plated onto a gelatin-coated plastic dish and incubated at 37°C for 1 hour. After incubation, ES cells in suspension were seeded to bacterial-grade dishes at 1 × 10⁵ cells/mL in Iscove's Modified Dulbecco's medium supplemented with 15% fetal bovine serum (FBS) (GIBCO-BRL, Gaithersburg, MD), 450 μmol/L monothio-glycerol (MTG) (Sigma, St Louis, MO) and 2 U/mL rh erythropoietin (EPO, Kirin Brewery Co, Tokyo, Japan) for 24 hours to allow formation of aggregates. The suspension was then diluted to achieve 50 to 100 aggregates per 35-mm dish, and the cells were directly added to a 0.9% methylcellulose medium containing 15% FBS, 450 μmol/L MTG, and 2 U/mL EPO.
For cell differentiation on a layer of stromal cells, we first performed a one-step differentiation method. Collected ES cells were seeded onto a confluent layer of OP9 cells in a Falcon 6-flat well tissue culture plate (Becton Dickinson Co, Lincoln Park, NJ) at 1 × 10⁴ cells/well and incubated for up to 3 weeks as described previously.15 The two-step method described by Nakano et al15 was used to induce more efficient in vitro differentiation of hematopoietic cells from ES cells on OP9 cells. Approximately 2 weeks after seeding ES cells on OP9 cells, floating cells from the stromal cell layer were collected with media. These cells were analyzed by fluorescence-activated cell sorting (FACS) and dianisidine staining. FACS analysis was performed with fluorescein isothiocyanate (FITC)-labeled TER119 antibody,21 kindly provided by Dr Tatsuo Kina (Kyoto University, Kyoto, Japan), and FITC-conjugated Mac1 antibody (Pharmingen, San Diego, CA) as markers of erythroid and myeloid lineages, respectively. Dianisidine-stained cells were fixed to slide glass by using Cytospin (Shandon Southern Products, Cheshire, UK), and the nuclei of these cells were counter-stained with methylgreen.
Reverse transcriptase-polymerase chain reaction (RT-PCR) analysis.
EBs were harvested at various times in culture and RNA was extracted according to the method described previously.22 A total of 2 μg of total RNA were reverse-transcribed in 30 μL of reaction mixture containing the RT buffer (GIBCO-BRL), 10 mmol/L dithiothreitol (DTT), 1 μg of oligo (dT), 1 mmol/L each of deoxynucleotide triphosphates (dNTP), 14 U of RNase inhibitor (GIBCO-BRL) and 300 U of Moloney murine leukemia virus (M-MLV) reverse transcriptase. PCR reactions were performed in a final volume of 70 μL of the PCR reaction buffer (Perkin-Elmer-Cetus, Norwalk, CT) containing 0.1 mmol/L each of dNTP, 50 pmol each of the primer, 3 μCi [α-32P]deoxycytidine triphosphate (dCTP) (3,000 Ci/mmol), and 2.5 U of Taq polymerase (Promega). The amount of cDNAs added to the reaction mixture was normalized by the intensity of the β-actin amplicon. Aliquots were electrophoresed in 7% polyacrylamide gels. Gels were dried, autoradiographed, and subjected to densitometric analysis. An optimal cycle number for each primer was determined by preliminary PCR by removing aliquots at various numbers of cycles and examining intensity of amplicons at each time. Linear amplification was verified at the determined cycle numbers for each primer. Primers used in this study were as follows:
β-actin23 sense, 5′-GTGACGAGGCCCAGAGCAAG; antisense, 5′-AGGGGCCGGACTCATCGTAC; ALAS-E24 sense, 5′-GTGGTGCAGCCAAGTTTGTC; antisense, 5′-AGCATAGGTGGTAACATATT; GATA-125 sense, 5′-ACTCGTCATACCACTAAGGT; antisense, 5-AGTGTCTGTAGGCCTCAGCT; EKLF26 sense, 5′-GATCGCCGGAGACGCAGGCT; antisense, 5′-TCCCCAGTCCTTGTGCAGGA; p4527 sense, 5′-TCAGCAGAACAGGAACAGGT; antisense, 5′-GCTTTGACACTGGTATAGCT; βh1 globin28sense, 5′-CTCAAGGAGACCTTTGCTCA; antisense, 5′-GCCTAATTCAGTCCCCATGG; β-major globin29sense, 5′-CACAACCCCAGAAACAGACA; antisense, 5′-CTGACAGATGCTCTCTTGGG.
Immunoblot analysis.
For immunoblot analysis, EBs were homogenized in 20 mmol/L Tris-Cl (pH7.4) containing 2% SDS, 5% 2-mercaptoethanol, 10% glycerol, and 1 mmol/L phenylmethylsulfonyl fluoride (PMSF). A total of 15 μg of protein was loaded onto a 12% Laemmli gel30 and electrophoretically separated. Immunoblotting and detection by an enhanced chemiluminescence (ECL, Amersham International plc, Buckinghamshire, UK) was performed as described previously.31 Primary antibodies used in this study were a rat antimouse GATA-1 antiserum (Santa Cruz Biotechnology, Santa Cruz, CA) and a rabbit antimouse hemoglobin antiserum (CAPPEL/Organon Teknica, Durham, NC). A goat antirat IgG for GATA-1 and a goat antirabbit-IgG for hemoglobin, both of which had been coupled with horseradish peroxidase, were used as the secondary antibody in the ECL assay. The specificity of rat antimouse GATA-1 antibody (N6) has been previously established by its exclusive binding to mouse GATA-1 protein in immunoblot analysis.32 The antihemoglobin antibody used was a polyclonal antibody raised in a rabbit immunized by mouse adult hemoglobin(s).
Heme assay.
EBs were dissociated by incubation in phosphate-buffered saline containing 0.25% collagenase and then incubated with 20% FBS for 1 hour.12 After incubation, a single cell suspension was prepared by passing cells through a syringe with a 20-gauge needle. Heme content was determined in triplicate using 1 × 10⁵ cells per assay by fluorometry as described previously.33
RESULTS
Preparation of a targeting vector for ALAS-E gene.
Before ALAS-E gene targeting, we examined the chromosomal location of the mouse ALAS-E gene. Our finding indicates that the mouse ALAS-E gene was located on the X-chromosome (data not shown), as is the case with the human ALAS-E gene (ALAS2).4
To prepare a disrupted ALAS-E gene in mouse ES cells, we constructed a replacement vector that contained a 0.8-kb 5′-homologous region and a 10-kb 3′-homologous region of the ALAS-E gene flanking a NEO cassette (Fig 1A). Because a 4.4-kb genomic fragment, including exon 8 through exon 10, was replaced with the NEO cassette by the homologous recombination, the mutant allele lacked a domain including the binding site for pyridoxal 5′-phosphate,34 an essential cofactor for ALAS activity (Fig 1A). The linearized targeting vector was electroporated into two ES cell lines, CCE and J1, and clones were screened for resistance to G418 and gancyclovir. Southern blot analysis of the selected clones showed that one each of the CCE and J1 clone contained the targeted ALAS-E gene (Fig 1B).
Heme content in ALAS-E(-) EBs.
To evaluate the consequence of ALAS-E deficiency in erythroid cell development, ALAS-E(-) ES cells were incubated in a semisolid medium to allow EB formation and cell differentiation. EBs thus developed were harvested at various time points and heme content was determined. The heme content in the wild-type EBs increased from day 6, continued to increase during cell differentiation, and reached a maximum by day 10 (Fig 1C). Development of hemoglobinized erythroid cells was also observed in the wild-type EBs (see below), which was similar to the rate of heme synthesis. In contrast to the wild-type EBs, heme content in ALAS-E(-) EBs did not increase at all (Fig 1C).
Erythroid differentiation of ALAS-E(-) ES cells.
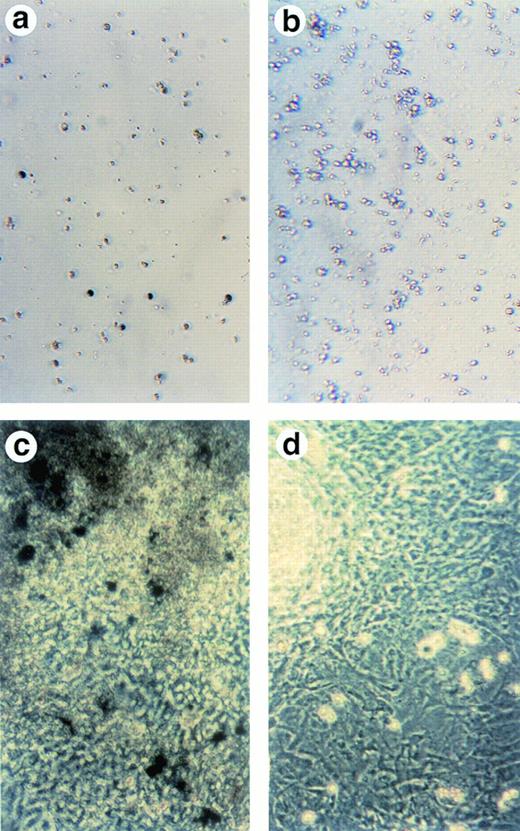
To examine whether cells in ALAS-E(-) EBs differentiate along with the erythroid lineage, both the wild-type and ALAS-E(-) EBs were harvested on day 8 and were dissociated using a collagenase solution and stained for hemoglobin with benzidine. Significant numbers of benzidine-positive cells were detected in the wild-type EBs (Fig 2A), whereas no benzidine-positive cells were observed in ALAS-E(-) EBs (Fig 2B). This finding indicates that cells in the mutant EBs did not differentiate fully to the hemoglobinized cells, as in the wild-type EBs.
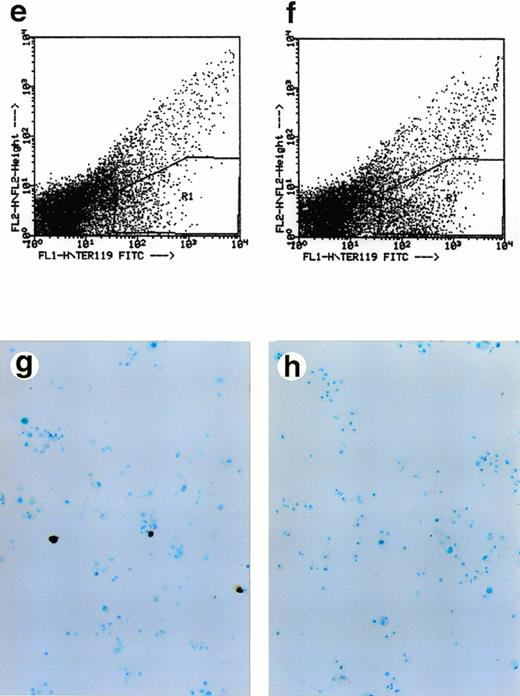
Lack of ALAS-E affects erythroid differentiation of ES cells at late stage. EBs formed from the wild-type (a) and ALAS-E(-) mutant ES cells (b) were dissociated with collagenase and stained with benzidine. Note the presence of dark blue cells in the wild-type EBs, which are positive to the benzidine staining. The wild-type (c) and mutant ES cells (d) were also cocultured with OP9 stroma cells and colonies formed were stained with benzidine. Hematopoietic cells obtained from the two-step coculture culture system with OP9 cells were then analyzed. The expression of TER119 was analyzed by FACS. Comparable numbers of TER119-positive cells were floated from ALAS-E(-) mutant ES cell culture (f) as does from the wild ES cell culture (e). However, no benzidine staining-positive cells were observed in the hematopoietic cells from the mutant ES cells (h), while a number of benzidine-positive cells were observed in the floating hematopoietic cells from the wild-type ES cells (g).
Lack of ALAS-E affects erythroid differentiation of ES cells at late stage. EBs formed from the wild-type (a) and ALAS-E(-) mutant ES cells (b) were dissociated with collagenase and stained with benzidine. Note the presence of dark blue cells in the wild-type EBs, which are positive to the benzidine staining. The wild-type (c) and mutant ES cells (d) were also cocultured with OP9 stroma cells and colonies formed were stained with benzidine. Hematopoietic cells obtained from the two-step coculture culture system with OP9 cells were then analyzed. The expression of TER119 was analyzed by FACS. Comparable numbers of TER119-positive cells were floated from ALAS-E(-) mutant ES cell culture (f) as does from the wild ES cell culture (e). However, no benzidine staining-positive cells were observed in the hematopoietic cells from the mutant ES cells (h), while a number of benzidine-positive cells were observed in the floating hematopoietic cells from the wild-type ES cells (g).
This conclusion was also confirmed by using another recently developed in vitro differentiation system, which uses coculture of ES cells with OP9 stromal cells.15 OP9 is a cell line that lacks a macrophage colony-stimulating factor (M-CSF) receptor and is known to permit efficient hematopoietic cell differentiation of ES cells, without forming EBs.15 Using this system, both the wild-type and the mutant ES cells were cocultured on a layer of OP9 cells for 5 days and then transferred to a new layer of OP9 cells after dissociation with trypsin. Development of hematopoietic cell colonies was observed in association with the OP9 layer. Figure 2C and D show the benzidine-positive colonies from the wild-type and mutant ES cells, respectively, on the day 14 culture. In the wild-type ES cell culture, there were a number of benzidine-positive cell aggregates (Fig 2C), indicating that these colonies contain hemoglobinized cells. In contrast, there were no benzidine-positive colonies in ALAS-E(-) cells (Fig2D).
The colonies formed in this culture were mixed colonies, rather than pure hematopoietic colonies. Thus, we selected hematopoietic cells according to the procedure of Nakano et al.15 In this method, it was shown that cells floated after the second passage of ES cells contain cells of various hematopoietic lineages. Floating cells were harvested from day 14 culture and stained for TER119 erythroid-specific marker, which is known to be exclusively expressed in mature erythrocytes.
Approximately 5% of both the wild-type and ALAS-E(-) ES cells were found to be positive for TER119 (Fig 2E and F). This finding thus suggests that both the wild-type and ALAS-E(-) cells have developed to a stage beyond colony-forming unit-erythroid (CFU-E).21 The percentages of cells positive for other cell lineage-specific markers, such as B220 for B-cell lineage, GR1 for the granulocyte lineage, and Mac1 for the monocyte lineage, were similar for both the wild-type and ALAS-E(-) ES cells (data not shown). There were cells that were positive for hemoglobin synthesis in the wild-type ES culture as judged by positive stain with benzidine (Fig 2G), while there were no cells that were positive for benzidine in ALAS-E(-) ES cells (Fig 2H). A summary of repeated experiments is shown in Table 1. These findings clearly show that while ALAS-E(-) ES cells develop to the TER119-positive stage, these cells are not capable of hemoglobin synthesis.
Hemoglobinized Cells in Two In Vitro Culture Systems
| ES Cells . | Semisolid Culture (%) . | Coculture With Stromal Cells (%) . | |||
|---|---|---|---|---|---|
| Exp. 1 . | Exp. 2 . | Exp. 3 . | Exp. 1 . | Exp. 2 . | |
| Wild type | 2 | 6 | 4 | 2 | 2 |
| ALAS-E(−) | 0 | 0 | 0 | 0 | 0 |
| ES Cells . | Semisolid Culture (%) . | Coculture With Stromal Cells (%) . | |||
|---|---|---|---|---|---|
| Exp. 1 . | Exp. 2 . | Exp. 3 . | Exp. 1 . | Exp. 2 . | |
| Wild type | 2 | 6 | 4 | 2 | 2 |
| ALAS-E(−) | 0 | 0 | 0 | 0 | 0 |
A total number of 100 cells were counted for each sample in semisolid cultures, and 150 cells were counted for each sample in coculture experiments.
Expression of mRNAs for ALAS-E and erythroid transcription factors in ALAS-E(-) EBs.
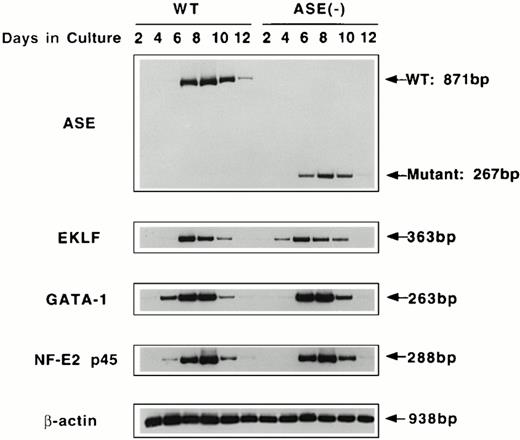
To examine the effect of ALAS-E gene disruption in the early stage of erythropoiesis, we examined expression of mRNAs for ALAS-E and erythroid transcription factors in the wild-type and ALAS-E(-) EBs. EBs were harvested at various time points, and RT-PCR was performed using total RNA to determine the levels of mRNAs. As shown in Fig 3, the normal and mutated ALAS-E mRNAs were detectable by day 4 in the wild-type and ALAS-E(-) EBs, respectively. By Southern blot analysis of the PCR products, expression of normal ALAS-E mRNA and the mutant mRNA lacking exon 8 through exon 10, in the wild-type and ALAS-E(-) cells, respectively, was demonstrated (data not shown).
RT-PCR analysis of the expression of erythroid transcription factors in EBs. Expression of mRNAs coding for ALAS-E and erythroid transcription factors GATA-1, p45, and EKLF were examined by RT-PCR. RNA samples were obtained from day 2 through day 12 EBs in culture. WT, wild-type EBs; ALAS-E(-), ALAS-E(-) EBs.
RT-PCR analysis of the expression of erythroid transcription factors in EBs. Expression of mRNAs coding for ALAS-E and erythroid transcription factors GATA-1, p45, and EKLF were examined by RT-PCR. RNA samples were obtained from day 2 through day 12 EBs in culture. WT, wild-type EBs; ALAS-E(-), ALAS-E(-) EBs.
Expression of GATA-1, p45 NF-E2, and EKLF mRNAs was also examined using RT-PCR of RNAs isolated from EBs. Similar to ALAS-E mRNA, levels of these mRNAs increased rapidly in the wild-type EBs and reached a maximum on day 8 (Fig 3). The level and the time course of the expression of these mRNAs in ALAS-E(-) EBs was very similar to those that were observed in the wild-type EBs, indicating that heme deficiency per se does not affect the early stage of erythropoiesis.
Expression of globin mRNA and protein in ALAS-E(-) EBs.
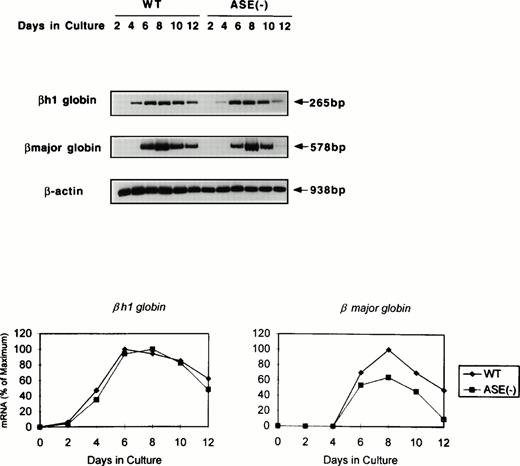
We next examined globin gene expression by using RT-PCR. βh1-globin mRNA was found increased by day 4, but that of the β-major globin became detectable for the first time on day 6 in the wild-type EBs (Fig 4). In addition, β-major globin mRNA levels were lower in ALAS-E(-) EBs than in the wild-type EBs, while βh1-globin mRNA expression in the mutant EBs showed a similar time course and levels to those in the wild-type EBs (Fig 4). Specifically, after day 8, the β-major globin mRNA level declined more rapidly in ALAS-E(-) EBs than in the wild-type EBs. This finding suggests that the transcription and/or stability of the β-major globin mRNA, but not of βh1-globin, was suppressed by the lack of ALAS-E expression.
Expression of globin mRNAs in differentiating EBs. The levels of mRNAs coding for βh1 and β-major globin were examined by RT-PCR. RNA samples were obtained from day 2 through day 12 EBs in culture. The top panel shows the photograph, while the bottom panel is a graphic presentation of the data.
Expression of globin mRNAs in differentiating EBs. The levels of mRNAs coding for βh1 and β-major globin were examined by RT-PCR. RNA samples were obtained from day 2 through day 12 EBs in culture. The top panel shows the photograph, while the bottom panel is a graphic presentation of the data.
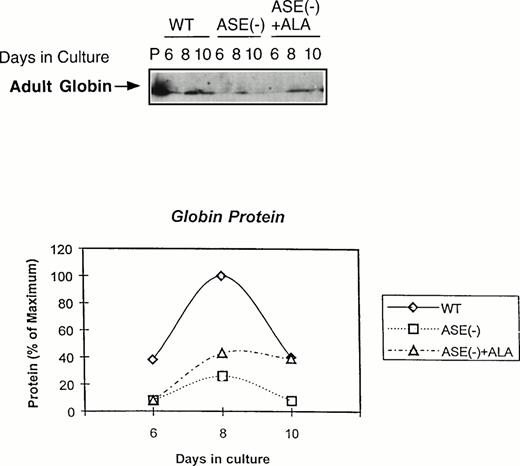
We next examined the expression of globin protein by immunoblot analysis using an antibody raised against adult mouse hemoglobin. As shown in Fig 5, adult hemoglobin levels were very much lower in ALAS-E(-) EBs than in the wild-type EBs, despite the fact that a substantial amount of β-major globin mRNA was detectable in these cells (see Fig 4). In contrast to β-major globin protein, GATA-1 protein was significantly expressed, which is consistent with the result of its mRNA expression (see Fig 3A ), both in ALAS-E(-) and wild-type EBs (data not shown). These findings suggest that decreased β-major globin in ALAS-E(-) EBs is not only due to suppressed expression of its mRNA, but also to an additional posttranscriptional mechanism.
Expression of adult globin protein in differentiating EBs. Adult globin proteins were analyzed by Western blot analysis. Proteins were isolated from EBs of day 6, 8, and 10 in culture. Immunoquantitation was performed using a rabbit antimouse hemoglobin serum and a goat antirabbit-IgG coupled with horseradish peroxidase in an ECL assay system. In the top panel, lane P shows the analysis protein sample from DMSO-treated MEL cells as a positive control, lanes WT show the analysis of proteins from wild-type EBs in culture of day 6, 8, and 10. Lanes ASE(-) show the analysis of proteins from ALAS-E(-) EBs in culture of day 6, 8, and 10 and lanes ASE (-) + ALA show the analysis of proteins from ALAS-E(-) EBs in culture with the addition of ALA of day 6, 8, and 10. The bottom panel is a graphic presentation of the data.
Expression of adult globin protein in differentiating EBs. Adult globin proteins were analyzed by Western blot analysis. Proteins were isolated from EBs of day 6, 8, and 10 in culture. Immunoquantitation was performed using a rabbit antimouse hemoglobin serum and a goat antirabbit-IgG coupled with horseradish peroxidase in an ECL assay system. In the top panel, lane P shows the analysis protein sample from DMSO-treated MEL cells as a positive control, lanes WT show the analysis of proteins from wild-type EBs in culture of day 6, 8, and 10. Lanes ASE(-) show the analysis of proteins from ALAS-E(-) EBs in culture of day 6, 8, and 10 and lanes ASE (-) + ALA show the analysis of proteins from ALAS-E(-) EBs in culture with the addition of ALA of day 6, 8, and 10. The bottom panel is a graphic presentation of the data.
If ALA is the rate-limiting factor for erythroid heme synthesis and expression of β-major globin, an addition of ALA to ALAS-E(-) EBs is expected to correct these problems. When ALA (100 μmol/L) was added to the culture, heme content in ALAS-E(-) EBs was found to increase and eventually reached the level found in the wild-type EBs (data not shown), showing that the defect in heme synthesis in ALAS-E(-) cells was due to ALA deficiency by the lack of ALAS-E expression. The level of adult hemoglobin was also significantly restored, although not complete, by ALA treatment (see Fig 5). These results indicate that the suppression of β-major globin synthesis is due to heme deficiency by the lack of ALA formation and show the critical role of heme synthesis in β-major globin synthesis.
DISCUSSION
Erythroid cells synthesize a large amount of heme, which is several orders of magnitude greater than other cells,1 and yet in normal erythroid cells, the amount of heme and globin is stoichiometrically matched. Thus, there must be an extremely fine control to maintain a balance between the synthesis of heme and globin in developing erythroid cells. In this study, we disrupted genetically the expression of ALAS-E that catalyzes the first step of heme biosynthesis and studied its effect on erythroid cell differentiation by using two in vitro differentiation systems of ES cells. The results clearly showed that ALAS-E is indispensable for the development of hemoglobinized mature erythroid cells and suggest that the rate of heme synthesis in erythroid cells plays a critical role in hemoglobin formation in these cells.
No hemoglobinized cells were found in cultures of ALAS-E(-) ES cells in both ES cell differentiation systems. Because the genes encoding erythroid transcription factors were expressed in ALAS-E(-) cells similarly as in the wild-type cells, it is unlikely that the number of erythroid precursors may be decreased in ALAS-E(-) EBs. Thus, the observed difference in the phenotype in ALAS-E(-) cells is more likely to be due to the lack of heme supply, which principally affected the late stage development of erythroid cells.
A positive role of heme on erythroid differentiation is well documented, while its exact mechanism of action is yet to be defined.35-37 Heme may have several effects in erythroid development, as it is known to upregulate heme pathway enzyme,5,36 as well as globin genes in MEL cells,38,39 and to stimulate erythroid colony formation in primary bone marrow cultures.40 These effects of heme in erythroid cells are in marked contrast to its effect on its own synthesis in the liver, which is exclusively suppressive. The difference in the action of heme between the erythroid and the nonerythroid tissues may importantly be related to the tissue-specific expression of the ALAS gene.
Our findings suggest that β-major globin expression is suppressed not only at the transcriptional level, but also at the translational level in ALAS-E(-) EBs. Using ALAS-E(-) cells, it is now possible for the first time to define the significance of the entire lack of erythroid heme formation in these cells. For example, heme is known to be necessary for translation of globin mRNA through inhibiting the activity of eIF-2α kinase (HRI, reviewed in Chen and London8). During the initiation of translation, eIF-2α forms a ternary complex with initiator tRNA charged with methionine and guanosine triphosphate (GTP). Phosphorylation of the eIF-2α at Ser 51 reduces its activity by impairing the rate of eIF-2B–dependent guanosine diphosphate (GDP)-GTP exchange reaction. Heme deficiency in ALAS-E(-) EBs may thus interfere with translation of globin from its mRNA by inhibiting the ternary complex formation.
Alternatively, the lack of heme may also affect the stability of β-major globin mRNA. Because the extent of a decrease in β-major globin synthesis was far greater than that of a decrease in its mRNA level, it is also possible that there is an additional posttranscriptional effect in globin synthesis due to heme deficiency, which may decrease the steady state level of β-major globin mRNA in ALAS-E(-) EBs. The significance of heme deficiency in β-major globin synthesis is also corroborated by the fact that globin protein synthesis was partially restored by treatment of ALAS-E(-) ES cells with exogenous ALA.
Our findings also show that while heme synthesis by normal expression of ALAS-E is critical for the late stage in erythroid differentiation, which involves hemoglobin synthesis, it may not be so essential for the early stage, which involves expression of other early erythroid genes. The reason(s) for different responses of βh1 and β-major globin mRNAs to the supply of heme by ALAS-N in ALAS-E(-) cells is not understood at present. One of the technical difficulties in dealing with this question is the fact that mouse ALAS-N cDNA has not been cloned, thus prohibiting evaluation of this question directly. It should be noted, however, that primitive and definitive erythropoiesis are known to be differentially affected, depending on which transcription factors are knocked out, eg, c-Myb,41 EKLF,42,43 and GATA-1.44Thus, βh1 and β-major globin mRNAs might be differently regulated by the lack of ALAS-E expression. It is also possible that ALAS-E may be more important for β-major than βh1 globin mRNA expression, as β-major globin synthesis in MEL cells is exclusively dependent on ALAS-E, rather than ALAS-N.5,45 For example, ALAS-E mRNA levels in untreated MEL cells are ≈10-fold higher than ALAS-N mRNA, and the former is increased more than ∼30-fold at 72 hours as compared with untreated cells,39 while the latter is downregulated during erythroid differentiation of these cells.5 39 While these findings do not provide a direct answer to the question, they collectively suggest that expression of β-major globin mRNAs may be more critically dependent on the availability of erythroid heme, or ALAS-E expression, than βh1 globin mRNA.
Our findings show that the percentages of TER119-positive cells were similar both in the wild-type and ALAS-E(-) ES cells. Because TER119-antigen is expressed only in late stage erythroid cells including mature erythrocytes, but not in erythroid progenitors such as burst-forming unit-erythroid (BFU-E) or CFU-E,21 it can be inferred that the ALAS(-) ES cells differentiated to a stage similar to that of the wild-type cells, which were TER119-positive. This finding is also consistent with the observation in patients with x-linked sideroblastic anemia (XLSA), in which a mutation of the ALAS-E gene has been documented,34that erythroid cells usually differentiate to a late stage of erythroid development, ie, mature erythrocytes, while these cells have a decreased amount of hemoglobin.
In contrast to the bone marrow of patients with XLSA, however, ring sideroblasts, which are the characteristic of this condition, were not observed in ALAS-E(-) cells cultured in vitro. The reason(s) for this discrepancy is unclear at present. It is possible that the in vitro system may lack a certain important factor(s) for complete erythroid differentiation, thus it may not permit the formation of ring sideroblasts. Alternatively, unlike the mutation of ALAS-E gene in patients with XLSA, which have residual enzyme activity, the null mutation of ALAS-E in ALAS-E(-) cells may be too stringent for the development of ring sideroblasts. To clarify this question, a new knockdown targeting and an animal model of ALAS-E(-) is necessary, and these experiments are under way in our laboratory.
ACKNOWLEDGMENT
We are grateful to Drs P. Pandolfi, Memorial Sloan-Kettering Cancer Center, New York, NY, for his generous supply of CCE ES cells; T. Kina for TER119; T. Nakano, Osaka University, Osaka, Japan, for his helpful discussion; Kirin Brewery Co for rh erythropoietin; and to Luba Garbaczewski for her technical assistance.
Supported in part by Grant No. DK-32890 from the United States Public Health Service (to S.S.), The Yamanouchi Molecular Medicine Fund from the Yamanouchi USA Foundation (to S.S.), Japanese Society for Promotion of Science and The Uehara Memorial Foundation (to M.Y.), and Grant-in-Aid from the Ministry of Education, Science and Culture of Japan (to H.F. and M.Y.).
Address reprint requests to Shigeru Sassa, MD, PhD, The Rockefeller University, 1230 York Ave, New York, NY 10021.
The publication costs of this article were defrayed in part by page charge payment. This article must therefore be hereby marked “advertisement” in accordance with 18 U.S.C. section 1734 solely to indicate this fact.

This feature is available to Subscribers Only
Sign In or Create an Account Close Modal