Abstract
B-cell chronic lymphocytic leukemia (B-CLL) represents a neoplastic disorder caused primarily by defective programmed cell death (PCD), as opposed to increased cell proliferation. Defects in the PCD pathway also contribute to chemoresistance. The expression of several apoptosis-regulating proteins, including the Bcl-2 family proteins Bcl-2, Bcl-XL, Mcl-1, Bax, Bak, and BAD; the Bcl-2–binding protein BAG-1; and the cell death protease Caspase-3 (CPP32), was evaluated by immunoblotting using 58 peripheral blood B-CLL specimens from previously untreated patients. Expression of Bcl-2, Mcl-1, BAG-1, Bax, Bak, and Caspase-3 was commonly found in circulating B-CLL cells, whereas the Bcl-XL and BAD proteins were not present. Higher levels of the anti-apoptotic protein Mcl-1 were strongly correlated with failure to achieve complete remission (CR) after single-agent therapy (fludarabine or chlorambucil) (P = .001), but the presence of only seven CRs among the 42 patients for whom follow-up data were available necessitates cautious interpretation of these observations. Higher levels of the anti-apoptotic protein BAG-1 were also marginally associated with failure to achieve CR (P = .04). Apoptosis-regulating proteins were not associated with patient age, sex, Rai stage, platelet count, hemoglobin (Hb) concentration, or lymph node involvement, although higher levels of Bcl-2 and a high Bcl-2:Bax ratio were correlated with high numbers (>105/μL) of white blood cells (WBC) (P = .01; .007) and higher levels of Bak were weakly associated with loss of allelic heterozygosity at 13q14 (P = .04). On the basis of measurements of apoptosis induction by fludarabine using cultured B-CLL specimens, in vitro chemosensitivity data failed to correlate with in vivo clinical response rates (n = 42) and expression of the various apoptosis-regulating proteins. Although larger prospective studies are required before firm conclusions can be reached, these studies show the expression in B-CLLs of multiple apoptosis-regulating proteins and suggest that the relative levels of some of these, such as Mcl-1, may provide information about in vivo responses to chemotherapy. In vitro chemosensitivity data, however, do not appear to be particularly useful in predicting responses in B-CLL.
B-CELL CHRONIC lymphocytic leukemia (B-CLL) represents the most common type of leukemia, with approximately 12,000 new cases annually and a prevalence of about 50,000 to 60,000 patients in the United States alone.1 In its classic form, this neoplastic disorder is characterized by the gradual accumulation in the patient of small mature B cells, most of which are G0/G1-phase, nonproliferating cells and which display typical B-cell surface markers (CD19, CD20) in addition to CD5.2-6 B-CLL represents the quintessential example of a malignancy caused by failed programmed cell death (PCD), as opposed to altered cell-cycle regulation. In essentially all self-renewing tissues, new cell production is normally offset by a commensurate amount of cell destruction through PCD. Imbalances in the activities of opposing genes that either promote or block physiological cell death can therefore slow or halt the rate of cell turnover, creating a selective survival advantage for a particular clone that permits expansion, often at the expense of its normal neighbors.7-9
Most B-CLLs have been reported to contain high levels of the anti-apoptotic protein Bcl-2.10-16 The mechanisms responsible for the high amounts of Bcl-2 observed in more than 80% of B-CLLs remain enigmatic, but only rarely do they involve rearrangements of the BCL-2 gene as a result of chromosomal translocations, unlike the follicular B-cell non-Hodgkin's lymphomas (NHL), and may entail BCL-2 gene hypomethylation in its promoter region.11,17,18 Because overexpression of Bcl-2 is so widespread in B-CLL, examination of the relative levels of this anti-apoptotic protein have not been particularly helpful in predicting outcome for patients with this disorder. In this regard, B-CLL remains an incurable disease, perhaps attributable, in large part, to the well-established association of chemoresistance and radioresistance with defects in PCD. B-CLL not only prolong the physiological life span of cells but also render them resistant to the cytotoxic effects of essentially all currently available anticancer drugs.19 The clinical course for patients with B-CLL can be quite variable, with many patients enjoying normal age-adjusted survival but others succumbing to their disease within 1 year of diagnosis.2-6,20 Response rates to single-agent therapy, such as the alkylating agent chlorambucil or the purine nucleoside analogues fludarabine and 2-CdA, vary widely among studies,2-6,20 21 with advanced Rai stage and older age generally associated with worse outcome. However, the biologic basis for the widely different therapeutic responses of B-CLL patients remains largely unknown.
Consideration of Bcl-2 and other apoptosis-regulating proteins may provide insight into the pathogenesis of B-CLL and could potentially assist in predicting clinical outcome. Indeed, Robertson et al22 reported an association between shorter survival and higher levels of Bcl-2 protein in a study of 33 B-CLL patients. However, Bcl-2 was not of prognostic value in some other investigations of B-CLL patients.15,23,24 In this regard, Bcl-2 is only one member of a large family of apoptosis-regulating proteins, with some functioning akin to Bcl-2 as blockers of apoptosis and others as promoters of cell death.7,25 For example, in a recent study of 38 patients with B-CLL, Bcl-2 mRNA alone was not predictive of outcome, but higher ratios of mRNA encoding Bcl-2 relative to one of its antagonists Bax were associated with progressive disease.23 High Bcl-2:Bax protein ratios in B-CLLs have also been observed in previously treated patients, as compared with untreated patients.15,24 Additional studies have also suggested an important role for the Bcl-2:Bax protein ratio in determining in vitro sensitivity to cytotoxic agents but have not correlated these results with clinical responses.10 13
In this report, we evaluated the relative levels of several Bcl-2 family proteins in 58 cases of typical CD5+ B-CLL, including the anti-apoptotic proteins Bcl-2, Bcl-XL, and Mcl-1 and the pro-apoptotic proteins Bax, Bak, and BAD. Moreover, we determined the expression of BAG-1, a protein that interacts with Bcl-2 and Bcl-XL and that enhances the ability of Bcl-2 to prevent apoptosis.26 Finally, the expression of a protease intimately associated with apoptosis, Caspase-3, also known as CPP32, was examined.27,28 This protease exists as an inactive zymogen in cells but frequently becomes activated through proteolytic processing mechanisms during apoptosis, allowing it to cleave a variety of protein substrates that contribute to the apoptotic demise of the cell. The relative levels of pro-Caspase-3 are known to vary in normal B cells, with apoptosis-prone germinal center B cells typically containing high levels of Caspase-3 protein and long-lived mantle zone B cells having little or none of this protease.29Comparisons were made between expression of these apoptosis-regulating proteins and both in vitro and in vivo responses to chemotherapeutic drugs.
MATERIALS AND METHODS
Patient materials.
All 58 B-CLL specimens originated from previously untreated patients enrolled in the Eastern Cooperative Oncology Group (ECOG) trial's Rai stage (1 = stage 0; 22 = stages I/II; 20 = stages III/IV; 15 = unknown), with 53 representing patients enrolled by ECOG in the intergroup study C9011. This trial initially set out to compare outcome in B-CLL patients treated with chlorambucil or fludarabine or with a combination of these drugs.30 The fludarabine plus chlorambucil arm, however, was discontinued because of unacceptable toxicity. Eight of the patient specimens evaluated in this study were derived from this arm and were not included in the correlations with outcome. Another three patients initially enrolled on C9011 were later deemed ineligible; thus, clinical follow-up data were available for only 42 of the patients whose peripheral blood specimens were evaluated for apoptosis-regulatory proteins. These patients display the following characteristics: age (66 median, 60 to 73 interquartile range), sex (33 male; 9 female), hemoglobin (12.2 g/dL median, 10.3 to 14 interquartile range), platelet count (150 median; 98 to 186 interquartile range), white blood cells (WBC) (93.7K median, 49.3 to 169.7K interquartile range), percentage lymphocytes (92% median, 83% to 95% interquartile range), and incidence of involvement of the central nervous system (CNS) (0/41), peripheral nervous system (PNS) (1/40), spleen (31/41), liver (8/41), node (35/41), skin (1/41), gums (0/41), and mediastinal mass (4/41). One half of these 42 patients received fludarabine and one half chlorambucil as their initial therapy. Clinical responses were assessed as described,6 for assigning patients to complete responder (CR), partial responder (PR), and nonresponder (NR) categories, with NR also including patients who progressed while receiving therapy. All samples represented heparinized whole blood obtained before therapy, mixed 1:1 with either Iscove's or Dulbecco's modified essential medium (IMEM or DMEM) and shipped at ambient temperature by overnight mail with processing the next day. Pilot experiments determined that B-CLLs handled in this way remained more than 95% viable and that relative levels of Bcl-2 and several of the apoptosis-regulating proteins studied remained essentially unchanged as compared with blood specimens processed immediately after removal from the patient. Peripheral blood lymphocytes were purified from blood specimens by Ficoll gradient centrifugation. Flow cytometric analysis determined that all specimens contained more than 90% CD5+CD19+ B cells.
Immunoblot assays.
Immunoblot assays were performed as described in detail elsewhere, using the multiple antigen detection (MAD) immunoblotting method previously developed in our laboratory.31 Briefly, lysates were prepared from B-CLLs, normalized for total protein content (12.5 to 50 μg per lane, depending on the experiment), and subjected to sodium dodecyl sulfate-polyacrylamide gel electrophoresis (SDS-PAGE) (12% gel), followed by transfer to nitrocellulose filters. The primary antibodies employed represented rabbit polyclonal antisera raised against either synthetic peptides (Bcl-2, Bcl-XL, Mcl-1, Bax, Bak) or recombinant protein produced in bacteria (Caspase-3) or were murine monoclonal antibodies (MoAbs) raised against recombinant proteins (BAG-1, BAD). The characterization and documentation of the specificity of all antibodies have been reported previously.32-37 Secondary antibodies consisted of horseradish peroxidase (HRP)-conjugated goat anti-rabbit IgG or sheep anti-mouse IgG (Bio-Rad Laboratories, Richmond, CA). Detection was performed by an enhanced chemiluminescence (ECL) method (Amersham, Arlington Heights, IL), followed by colorimetric detection, using SG substrate (Vector Laboratories, Burlingame, CA) as described.31 Lysates from the t(14;18)-containing lymphoma line RS11846 were included on every blot as an arbitrary standard for subsequent normalization of all results, which were quantified by scanning densitometry. Forty of the specimens were analyzed two to three separate times, with less than 20% deviation among the results, implying that the method was reproducible. Comparisons of selected B-CLLs with various concentrations of RS11846 cell lysates verified that the immunoblot assay was operating within the linear range for detection of all antigens studied when using 12.5 to 50 μg per lane of B-CLL lysate. In five cases, only colorimetric data were obtained, rather than ECL-based development of x-ray films, precluding densitometric quantifications. In these instances, the intensity of the bands was scored as either high or low compared with the RS11846 standard, with “high” representing band intensities approximately 50% or more of those obtained for this cell line. RS11846 cells were determined beforehand to contain relatively high amounts of Bcl-2, Mcl-1, Bax, Bak, BAG-1, and Caspase-3 compared with a variety of other human tumor cell lines.31
In vitro chemosensitivity assay.
Cells were cultured at 2 × 10⁶ cells per mL in IMEM with 20% heat-inactivated fetal calf serum (FCS), 1 mmol/Ll-glutamine, and penicillin/streptomycin in 24-well plates (2 mL per well) without or with various concentrations of fludarabine (10−8 to 10−4 mmol/L) (gift of Berlex Laboratories, Richmond, CA) or 2-CdA (10−5 to 10−9 mol/L) (gift from Dennis Carson, San Diego, CA). After 3 days, the percentage of cells with fragmented DNA typical of apoptosis was determined by TUNEL assay,38 using terminal deoxylnucleotidyl transferase (TdT), biotinylated UTP, and fluorescein isothiocyanate-streptavidin as described previously.32 Data were collected by flow cytometry, subtracting the background fluorescence of cells subjected to the same procedure without TdT enzyme addition. The percentage of cells having undergone spontaneous apoptosis was subtracted to determine the net percentage of drug-induced apoptosis. In some cases, cell lysates were prepared for immunoblot analysis at various times after treatment of CLL cells in vitro with fludarabine.
Statistical analysis.
Immunoblot and in vitro chemosensitivity data were compared with clinical responses, Rai stage, laboratory studies, and various patient characteristics. For specimens on which immunoblot analysis was performed two or three times, the mean was employed. In cases in which only colorimetric immunoblot data were available, these patient specimens were omitted for analysis of continuous variables or included as “low” equal to zero and “high” as higher than any of the other measures for nonparametric analysis, with the exception of the Bcl-2:Bax ratio, where they were again omitted from the analysis. The inclusion of these data did not substantially move the median or general weight of the data. Evaluations of the association of immunoblot data with in vitro chemosensitivity data and spontaneous apoptosis TUNEL assay data were performed using the Spearman correlation and Wilcoxon statistics. The association of clinical response (CR, PR, NR) with apoptosis proteins and TUNEL assay data for the 42 patients with outcome data enrolled in C9011 was evaluated by logistic regression. Associations between immunoblot data and clinical response (CR v non-CR) were evaluated by Fisher's exact test, dichotomizing at 1.0 with respect to immunoblot scores, or as continuous variables by logistic regression. A P value of ≤.05 was considered significant in all analyses.
RESULTS
Expression of apoptosis-regulatory proteins in B-CLLs.
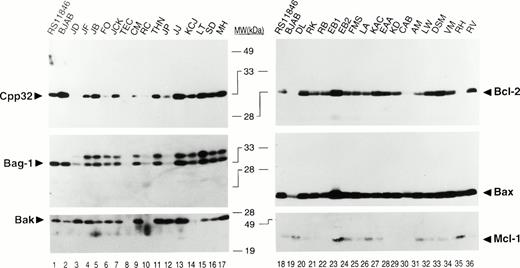
Using antibodies specific for Bcl-2, Bcl-X, Mcl-1, Bax, Bak, BAD, BAG-1, and Caspase-3, we determined the relative levels of these apoptosis-regulatory proteins in 58 cases of B-CLL by immunoblot assay. Among these proteins, Bcl-2, Mcl-1, Bax, Bak, BAG-1, and Caspase-3 were commonly expressed in B-CLLs, whereas the Bcl-X and BAD proteins were not present at detectable levels. Figure 1shows representative immunoblot results for some of these apoptosis-regulating proteins. Note that the expression of all these proteins is variable among B-CLL specimens. These blots also compare the results obtained for a t(14;18)-containing NHL B-cell line RS11846 and an EBV-immortalized B-lymphoblastoid line BJAB. The Bcl-X and BAD proteins were not detected in B-CLLs (Table1).
Representative immunoblot data for apoptosis-regulatory proteins in B-CLLs. Detergent lysates from B-CLLs were normalized for total protein content (25 μg per lane) and subjected to SDS-PAGE/immunoblot assay (12% gels) using various antibodies and a method for sequential detection of multiple antigens from the same blot.31 Representative ECL results are shown for 2 groups of patients (left/right). The t(14;18)-containing B-cell lymphoma line RS11846 and a B-lymphoblastoid line BJAB are shown for comparison. Note that BAG-1 was present as two proteins. Preliminary data suggest that the larger of these may represent a phosphorylated version of the protein (unpublished observations). Both bands were combined for densitometric scanning analysis.
Representative immunoblot data for apoptosis-regulatory proteins in B-CLLs. Detergent lysates from B-CLLs were normalized for total protein content (25 μg per lane) and subjected to SDS-PAGE/immunoblot assay (12% gels) using various antibodies and a method for sequential detection of multiple antigens from the same blot.31 Representative ECL results are shown for 2 groups of patients (left/right). The t(14;18)-containing B-cell lymphoma line RS11846 and a B-lymphoblastoid line BJAB are shown for comparison. Note that BAG-1 was present as two proteins. Preliminary data suggest that the larger of these may represent a phosphorylated version of the protein (unpublished observations). Both bands were combined for densitometric scanning analysis.
Summary of Characteristics of B-CLLs Analyzed
| Apoptosis proteins-150 | N | High (%) | Low (%) | |
| Bcl-2 | 57 | 34 (60) | 23 (40) | |
| Bax | 57 | 27 (47) | 30 (53) | |
| Mcl-1 | 55 | 24 (44) | 31 (56) | |
| Bak | 51 | 27 (53) | 24 (47) | |
| BAG-1 | 51 | 7 (14) | 44 (86) | |
| Caspase-3 | 52 | 18 (35) | 34 (65) | |
| Bcl-X | 29 | 0 (0) | 29 (100) | |
| BAD | 39 | 0 (0) | 39 (100) | |
| Bcl2:Bax ratio | 53 | 33 (62) | 20 (38) | |
| 13q14 LOH-151 | Positive | Negative | ||
| 48 | 15 (31) | 33 (69) | ||
| In vitro chemoresistance-152 | Sensitive | Resistant | ||
| 42 | 29 (69) | 13 (31) | ||
| In vivo chemoresponse-153 | CR | PR | NR | |
| 41 | 7 (17) | 19 (46) | 15 (37) | |
| Rai stage | Rai 0 | Rai I/II | Rai III/IV | |
| 43 | 1 (2) | 22 (51) | 20 (47) |
Data for B-CLL samples and patients are summarized (N = number tested). For 13q14LOH, ex vivo chemosensitivity, spontaneous apoptosis, and Rai stage, the frequency of patients in each response category is indicated, as well as the percentage of patients who were positive for 13q14LOH, exhibited sensitivity to drugs in vitro, had high rates of spontaneous apoptosis, or who had low Rai stage.
Densitometry scores were dichotomized into high- and low-expression groups based on direct comparisons with R11846 cells (“high” ≥1.0 vs “low” <1.0. For Bcl-2, two different cutoffs were employed.
13q14 LOH based on nine microsatellite markers.33
In vitro resistance to fludarabine defined as IC50>10−5 mol/L.
High spontaneous apoptosis defined as 20% or more.
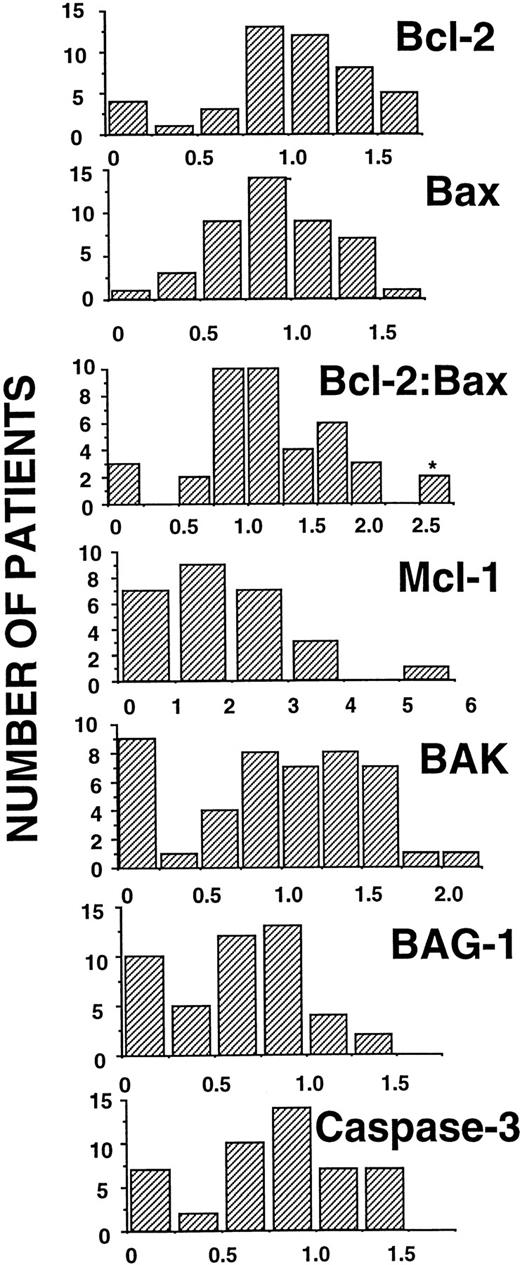
Figure 2 shows the scanning densitometry results for these B-CLL specimens, presenting the data as histograms that indicate the relative frequencies of specimens with various amounts of these apoptosis-regulatory proteins. The results were arbitrarily normalized relative to the RS11846 cell line (assigned a densitometry score of 1.0), included on all blots as an internal standard. Previous studies suggested that the ratio of Bcl-2:Bax mRNA or protein was associated with progressive disease or treatment failure in B-CLL15,23; we therefore examined the Bcl-2:Bax protein ratio as well. For purposes of dichotomizing the data, we arbitrarily set densitometry scores of greater than 1.0 relative to the RS11846 cell standard as “high” amounts of apoptosis-regulatory protein. The rationale for this approach to dichotomizing the data is clear for Bcl-2, because RS11846 cells contain a t(14;18) translocation that activates the BCL-2 gene. These cells were also found to contain relatively high levels of Bax, Bak, Mcl-1, BAG-1, and Caspase-3, as compared with a variety of other hematopoietic and nonhematopoietic cell lines.31 On the basis of this arbitrary cutoff of 1.0 or greater, B-CLLs expressed relatively high amounts of apoptosis-regulatory protein in the following proportions: Bcl-2 34/57 (60%), Mcl-1 24/55 (44%), Bax 27/57 (47%), Bak 27/51 (53%), BAG-1 7/51 (14%), and Caspase-3 18/52 (35%) (Table 1).
Histogram presentation of densitometry data for apoptosis-regulatory protein expression. Histogram representations of immunoblot score data, showing the number of patient specimens (y-axis) versus score (x-axis). Note that for the Bcl-2:Bax ratio, one patient's ratio was 11 (indicated here as 2.5 with an asterisk).
Histogram presentation of densitometry data for apoptosis-regulatory protein expression. Histogram representations of immunoblot score data, showing the number of patient specimens (y-axis) versus score (x-axis). Note that for the Bcl-2:Bax ratio, one patient's ratio was 11 (indicated here as 2.5 with an asterisk).
In vitro chemosensitivity testing of B-CLLs.
In vitro chemosensitivity testing was performed for 42 patient specimens. For these experiments, B-CLLs were cultured in the absence or presence of various concentrations of fludarabine or 2-CdA for 3 days, determined to be the optimal time on the basis of pilot experiments in which time-course analysis of drug-induced apoptosis was performed. Both purine nucleoside analogues induced rapid apoptosis in susceptible B-CLLs, making it possible to subtract spontaneous apoptosis that occurred in cultures from drug-induced cell death. Initially, attempts were also made to explore the sensitivity of B-CLLs to chlorambucil, as the clinical trial C9011 entailed randomization of patients to either fludarabine or chlorambucil monotherapy. However, chlorambucil-induced apoptosis occurred with relatively slow kinetics, necessitating that TUNEL assays be performed at 5 or more days, making it difficult to distinguish spontaneous apoptosis from drug induced. For this reason, chlorambucil in vitro sensitivity testing was abandoned.
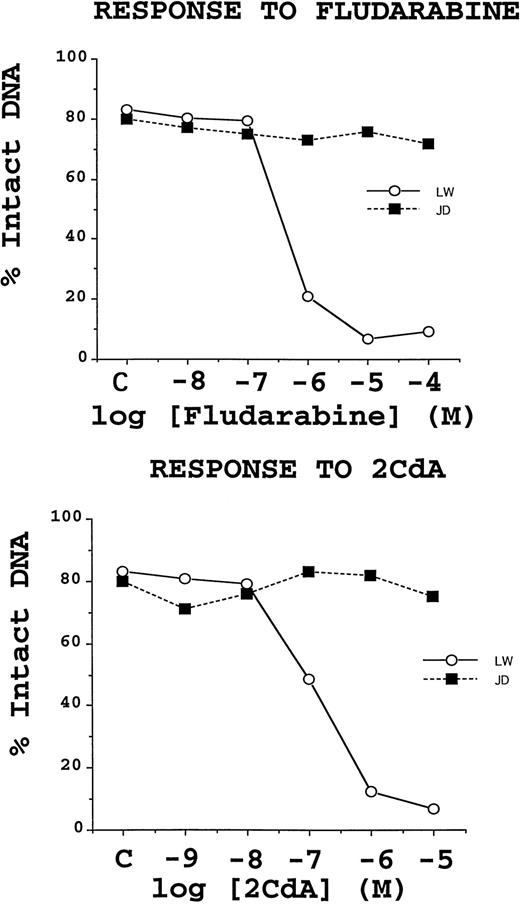
The dose-response curves for B-CLLs cultured with either fludarabine or 2-CdA demonstrated two clear types of cellular behaviors, as shown in Fig 3. Some patients exhibited concentration-dependent inductions of TUNEL positivity, with IC50 values consistently between 10−7 and 10−5 mol/L for fludarabine and between 10−8to 10−6 mol/L for 2-CdA. By contrast, another group of patients' B-CLL cells failed to undergo apoptosis in vitro when cultured with these drugs. Of the 42 specimens for which in vitro chemosensitivity testing was performed, 29 (69%) were sensitive to both fludarabine and 2-CdA, one (2%) was sensitive to fludarabine but not 2-CdA, one (2%) was sensitive to 2-CdA, but not fludarabine, and 11 (26%) were resistant to both drugs in vitro. The co-sensitivity of B-CLLs to fludarabine and 2-CdA was highly significant (P < .0001; McNeman test). In vitro chemosensitivity did not correlate with the levels of any of the apoptosis-regulatory proteins examined in this study.
Representative examples of chemoresistant and chemosensitive B-CLL specimens. TUNEL data, expressed as a percentage of cells with intact DNA (ie, TUNEL negative), shown for two B-CLL specimens, which are representative of the chemoresistant (▪) and chemosensitive (○) phenotypes. B-CLLs were cultured with the indicated concentrations of fludarabine or 2-CdA for 3 days before TUNEL/flow cytometric analysis was performed. Note that the rates of spontaneous apoptosis for these 2 B-CLL specimens were about 20%.
Representative examples of chemoresistant and chemosensitive B-CLL specimens. TUNEL data, expressed as a percentage of cells with intact DNA (ie, TUNEL negative), shown for two B-CLL specimens, which are representative of the chemoresistant (▪) and chemosensitive (○) phenotypes. B-CLLs were cultured with the indicated concentrations of fludarabine or 2-CdA for 3 days before TUNEL/flow cytometric analysis was performed. Note that the rates of spontaneous apoptosis for these 2 B-CLL specimens were about 20%.
Spontaneous apoptosis of cultured B-CLLs correlates with in vitro drug sensitivity.
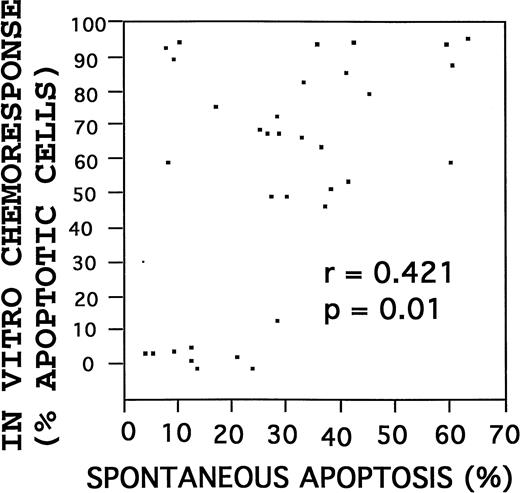
When placed into routine culture, B-CLLs remain in a G0/G1-phase nonproliferative state and begin to die by apoptosis over time. The rate of spontaneous apoptotic cell death was determined for each B-CLL at 3 days after initiation of cultures. Highly variable rates of spontaneous apoptosis were observed among the 42 B-CLLs tested, within a range of 3% to 60%. The rate of spontaneous apoptosis failed to correlate with any of the individual apoptosis-regulatory proteins or with the Bcl-2:Bax ratio. However, higher rates of spontaneous apoptosis were correlated with increased percentages of drug-induced apoptosis, when examined as continuous variables (r = .421; P ≃ 0.01, Spearman correlation) (Fig 4). Similarly, using the in vitro chemosensitivity results to dichotomize the specimens into drug-sensitive (n = 29) and drug-resistant (n = 13) groups based on an IC50 value of less than 10−5 mol/L for fludarabine and an IC50 value of less than 10−6 mol/L for 2-CdA, a strong association was again found between higher rates of spontaneous apoptosis and chemosensitivity, with a median percentage spontaneous apoptotic cells after 3 days in culture of 33% (interquartile range, 22% to 42%) for chemosensitive B-CLLs versus 13% (interquartile range, 9% to 21%) for chemoresistant specimens (P = .003; Wilcoxon test).
Correlation of spontaneous with drug-induced apoptosis. Rates of spontaneous and drug-induced (fludarabine) apoptosis were compared. Correlation by the Spearman method.
Correlation of spontaneous with drug-induced apoptosis. Rates of spontaneous and drug-induced (fludarabine) apoptosis were compared. Correlation by the Spearman method.
Though spontaneous apoptosis rates for B-CLLs in culture failed to correlate significantly with clinical response (n = 42), a tendency was noted for better responses (CR or PR) among those patients whose B-CLLs exhibited higher rates of apoptosis in vitro. For example, the median percentage of B-CLLs having undergone apoptosis after 3 days of culture was approximately 34% for the 26 patients who attained a CR or PR, compared with only about 17% for the 16 patients who failed to respond (NR).
Effects of fludarabine on expression of apoptosis-regulatory proteins.
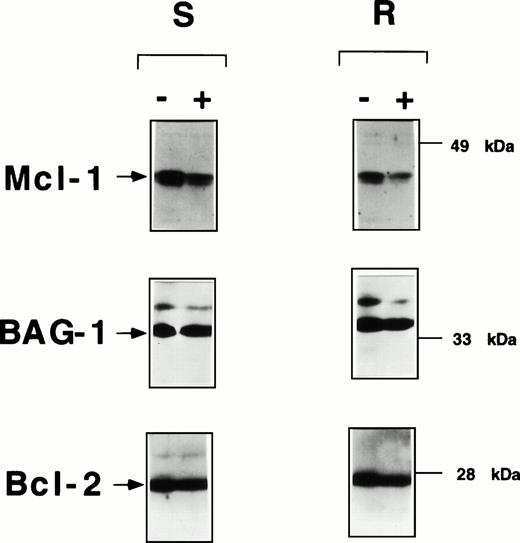
To explore preliminarily whether drug-induced changes in the expression of apoptosis-regulatory proteins correlated with in vitro chemoresistance or chemosensitivity, isolated lymphocytes from specimens representative of 2 resistant and 2 sensitive CLL cases were treated in vitro with 1 μmol/L fludarabine and at various times thereafter (3 hours to 3 days) relative levels of specific proteins were evaluated by SDS-PAGE/immunoblot assay as above. Among the proteins tested, only Mcl-1 displayed changes in its relative levels after exposure of B-CLLs to 1 μmol/L fludarabine undergoing time-dependent decreases in both the drug-resistant and drug-sensitive CLL specimens. Figure 5 presents a typical example at higher concentrations of fludarabine (10 to 100 μmol/L), reductions in BAG-1 protein levels were also seen beginning at about 1 day, but the high percentage apoptosis in cultures of drug-sensitive cells made it difficult to determine whether there was any difference between drug-sensitive and drug-resistant CLL cells (not shown). By contrast, the relative levels of Bcl-2, Bax, and Bak were not significantly altered by 1 to 100 μmol/L fludarabine treatment in vitro, nor were the Bcl-X or BAD proteins induced in these leukemic cells (Fig 5; and data not shown).
Fludarabine induces declines in Mcl-1 protein levels in B-CLLs in vitro. Representative immunoblot data are presented for CLL specimens that exhibited in vitro resistance (IC50 > 10−5 mol/L) (R) or sensitivity (IC50 < 10−5 mol/L) (S) to fludarabine. CLLs were cultured at 2 × 10⁶ cells/mL with or without 1 μmol/L fludarabine, then lysed in 1% Triton X-100–containing solution, and subjected to SDS-PAGE/immunoblot assay after normalization of samples for total protein content (25 μg/lane). The same blot was incubated with antibodies specific for Mcl-1 (top), BAG-1 (middle), and Bcl-2 (bottom).
Fludarabine induces declines in Mcl-1 protein levels in B-CLLs in vitro. Representative immunoblot data are presented for CLL specimens that exhibited in vitro resistance (IC50 > 10−5 mol/L) (R) or sensitivity (IC50 < 10−5 mol/L) (S) to fludarabine. CLLs were cultured at 2 × 10⁶ cells/mL with or without 1 μmol/L fludarabine, then lysed in 1% Triton X-100–containing solution, and subjected to SDS-PAGE/immunoblot assay after normalization of samples for total protein content (25 μg/lane). The same blot was incubated with antibodies specific for Mcl-1 (top), BAG-1 (middle), and Bcl-2 (bottom).
Comparisons of apoptosis-regulatory proteins with Rai stage and other patient characteristics: Association of Bcl-2 and high Bcl-2:Bax ratio with higher WBC.
The relative levels of Bcl-2 family proteins, BAG-1, and Caspase-3 in untreated CLLs were correlated with Rai stage (0 v I/IIv III/IV) and other patient characteristics, using data from the 42 patients with outcome data. No significant correlations were observed between any of the apoptosis-regulatory proteins and Rai stage, sites of disease involvement (CNS, PNS, spleen, liver, node, skin, gums, mediastinal mass), age (≤65 v >65), or sex. Among the laboratory studies, including hemoglobin (≤9 v >9 g/dL), platelet count (<100K v ≥100K), and WBC (<50Kv 50 to 100K v >100K), only higher WBC correlated with higher levels of Bcl-2 (r = .424; P = .01) and higher Bcl-2:Bax ratios (r = .473; P = .007) as determined by the Spearman method.
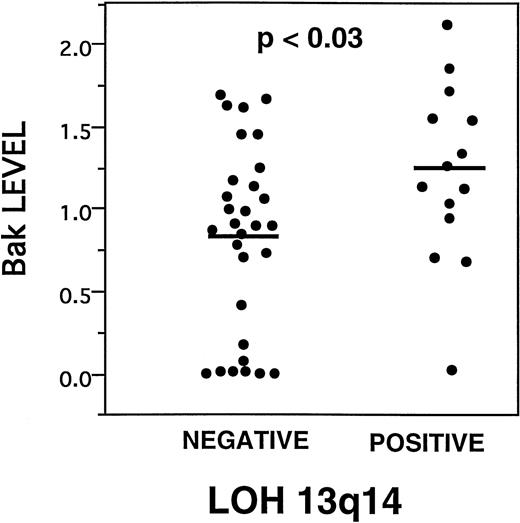
LOH at 13q14 is weakly associated with higher levels of Bak expression.
Deletions at 13q14 represent the most common cytogenetic abnormality associated with B-CLL.3 Recently, we have performed a molecular analysis of allelic loss of heterozygosity (LOH) in the 13q14 area for these B-CLL specimens, using nine microsatellite markers that detect polymorphisms in this chromosomal region.33Comparisons of LOH at 13q14 with the levels of various apoptosis regulatory proteins demonstrated a weak association between higher levels of Bak (Fig 6). The median and mean Bak densitometry scores, respectively, for B-CLLs with 13q14 LOH were 1.39 and 1.27 (interquartile range, .94 to 1.59) compared with .92 and .86 (intraquartile range, .16 to 1.28) for B-CLLs without molecular evidence of LOH (P = .03, Wilcoxon test). Other than higher levels of Bak, however, LOH at 13q14 was not significantly associated with any other apoptosis-regulatory proteins, Rai stage or other study-entry characteristics of the patients, response to chemotherapy in vivo or in vitro, or rates of spontaneous apoptosis.
Higher Bak is associated with LOH at 13q14. Dot histogram representation of Bak immunoblot scores compared with presence (positive) or absence (negative) of LOH at 13q14.33P value is indicated (analysis of variance). Bars = mean immunoblot score.
Higher Bak is associated with LOH at 13q14. Dot histogram representation of Bak immunoblot scores compared with presence (positive) or absence (negative) of LOH at 13q14.33P value is indicated (analysis of variance). Bars = mean immunoblot score.
Correlations of apoptosis regulatory proteins with clinical response to chemotherapy: Associations with Mcl-1 and BAG-1.
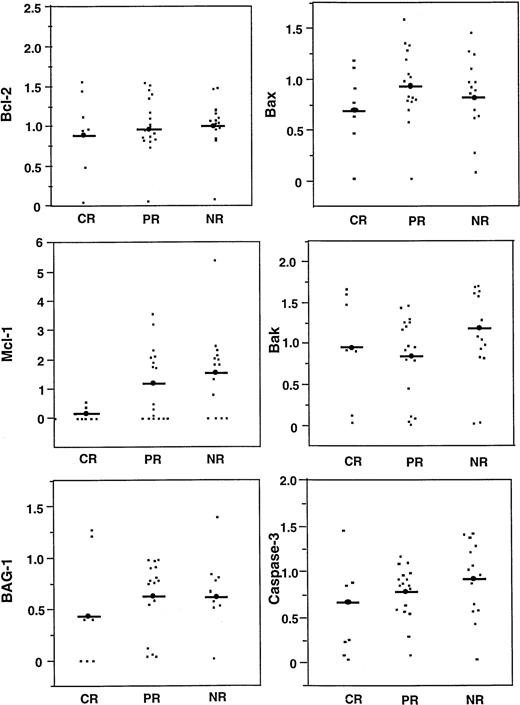
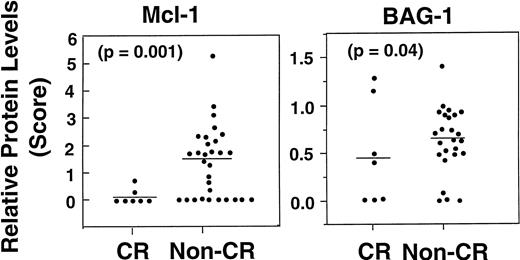
The levels of various apoptosis regulatory proteins were compared with clinical response (CR, PR, NR) (Fig 7; Table2). Mcl-1 protein levels were lower among patients who achieved a CR (median, 0; range, 0 to .67), compared with those who experienced only a PR or NR (median, 1.75; range, 0 to 5.36) (P = .03), when examined as continuous variables and including only quantitative immunoblot data (n = 37) (Fig 8, left). In addition to continuous variable analysis, dichotomization of the Mcl-1 immunoblot data into high (>1.0) and low (≤1.0) expression groups on the basis of comparisons with an arbitrary standard (RS11846 lymphoma cell line) also showed a significant association between higher Mcl-1 protein levels and failure to achieve CR (Table 2). In this case, 0 of 18 patients with higher Mcl-1 levels achieved a CR compared with 7/22 (31%) with lower Mcl-1 levels (P = .01). Thus, higher levels of Mcl-1 were significantly associated with failure to achieve CR among the B-CLLs examined here. These results were not biased by the type of chemotherapy (chlorambucil v fludarabine) received by the patients with low Mcl-1 levels, because 13 of 22 patients whose B-CLLs contained low Mcl-1 received fludarabine compared with 7 of 18 who had high Mcl-1 levels.
Comparisons of apoptosis-regulating proteins with clinical response. Relative levels of Bcl-2, Mcl-1, BAG-1, Bax, Bak, and Caspase-3 (CPP32) was compared for B-CLL patients who achieved CR or PR, or who had no responses or progressed while on therapy (NR). Bars = mean scores.
Comparisons of apoptosis-regulating proteins with clinical response. Relative levels of Bcl-2, Mcl-1, BAG-1, Bax, Bak, and Caspase-3 (CPP32) was compared for B-CLL patients who achieved CR or PR, or who had no responses or progressed while on therapy (NR). Bars = mean scores.
Comparisons of Clinical Response With Immunoblot, 13q14, LOH, Apoptosis, and In Vitro Drug Sensitivity Testing Data
| Marker . | Normal . | Low CR (%) . | High CR (%) . | P . |
|---|---|---|---|---|
| Bcl-2 | 42 | 4/20 (20) | 3/22 (14) | .69 |
| Bax | 42 | 5/22 (23) | 2/20 (10) | .41 |
| Bcl-2:Bax | 35 | 0/15 (0) | 7/24 (29) | .03 |
| Mcl-1 | 40 | 7/22 (32) | 0/18 (0) | .01 |
| Bak | 37 | 4/18 (22) | 3/19 (16) | .69 |
| BAG-1 | 37 | 5/33 (15) | 2/4 (50) | .15 |
| Caspase-3 | 38 | 5/26 (19) | 2/12 (17) | 1.00 |
| LOH | 36 | 5/27 (18) | 2/9 (22) | 1.00 |
| Spontaneous apoptosis | 29 | 1/11 (9) | 5/18 (28) | .36 |
| In vitro drug sensitivity | 31 | 1/9 (11) | 5/22 (23) | .64 |
Association of higher Mcl-1 and higher BAG-1 protein levels with failure to achieve CR. Dot histograms compare Mcl-1 (left) with BAG-1 (right) protein levels for patients who attained a CR versus those who did not (NR, PR, or progression). Bars = mean immunoblot scores. P values are indicated (logistic regression).
Association of higher Mcl-1 and higher BAG-1 protein levels with failure to achieve CR. Dot histograms compare Mcl-1 (left) with BAG-1 (right) protein levels for patients who attained a CR versus those who did not (NR, PR, or progression). Bars = mean immunoblot scores. P values are indicated (logistic regression).
A weak association between worse clinical response to chemotherapy and higher levels of BAG-1 protein was also observed (P = 0.04) (Fig 8, right), when examined as a continuous variable. For example, median BAG-1 protein levels among patients who attained a CR were .42 (range, 0 to 1.2) compared with 0.74 (range, 0 to 1.4) for patients with PR or NR (P = .04, based on univariate logistic regression analysis in which data represented continuous variables and included only samples with quantitative immunoblot data [n = 32]). These results were not biased by the type of chemotherapy (chlorambucilv fludarabine), as 7 of 11 (64%) patients whose BCLLs contained low BAG-1 received fludarabine, as compared with 12 of 26 (46%) which had high BAG-1 (P > .05).
Although the Bcl-2:Bax ratio was not significantly associated with clinical response when examined as a continuous variable, dichotomization into “high” and “low” Bcl-2:Bax groups using t(14;18)-containing RS11846 cells as an arbitrary standard showed an unexpected association between lower Bcl-2:Bax ratios and failure to achieve CR (Table 2). None of the other apoptosis-regulatory proteins exhibited significant associations with CR versus non-CR when examined by this dichotomization method, based on the use of RS11846 cells as an arbitrary standard (Table 2).
DISCUSSION
The preponderance of evidence indicates that B-CLL is caused by dysregulation of PCD. To date, relatively little is known about the expression of various genes that control apoptosis in this disease. In this report, we examined the relative levels in 58 B-CLLs of 8 proteins involved in apoptosis regulation, including the anti-apoptotic proteins Bcl-2, Bcl-X, Mcl-1, and BAG-1 and the pro-apoptotic proteins Bax, Bak, BAD, and Caspase-3. Among these, Bcl-2, Mcl-1, BAG-1, Bax, Bak, and Caspase-3 were commonly expressed in B-CLLs, whereas Bcl-XLand BAD were not. It should be recognized, however, that our analysis was limited to circulating peripheral blood B-CLLs and therefore cannot address this issue of the potential dynamics of apoptosis gene regulation in lymph node, bone marrow, or other tissue compartments. These caveats notwithstanding, based on current dogma that the normal counterpart of CD5+ B-CLLs represents a subtype of mantle zone B-lymphocyte,3 it may be noteworthy that circulating B-CLLs commonly expressed Caspase-3 and that roughly one half contained relatively high levels of Mcl-1. Previous studies have shown that mantle zone B cells typically do not express immunodetectable amounts of either Mcl-1 or Caspase-3.29,34 By contrast, germinal center B cells do express these proteins at high levels. The expression of Mcl-1 and Caspase-3 in B-CLLs may therefore represent examples of aberrant gene expression associated with the pathogenesis of B-CLL. Moreover, the expression of Mcl-1 in B-CLLs appears to be substantial in the sense that (1) Mcl-1 was present at levels equal to, or in excess of, RS11846 and other B-cell lymphoma lines of germinal center origin in approximately 45% of cases of B-CLL; and (2) normal and malignant germinal center B cells contain some of the highest levels of Mcl-1 among a wide variety of human tumor cell lines and normal tissues35 (unpublished data). It should be noted, however, that until more is known about the cell of origin for B-CLL, the significance of Mcl-1 and Caspase-3 expression in B-CLLs should be interpreted with extreme caution.
Overall survival for patients with B-CLL varies widely, making clinical decisions about therapy difficult and prompting the search for new prognostic markers that can provide reliable guidance for individual patients.2-6,20,36 Once B-CLL patients progress to the point that therapy is required, however, the extent and duration of response become prognostically important. The ability to predict clinical responses to conventional chemotherapy could therefore be useful for selecting patients for whom innovative experimental approaches should be considered37 and for balancing efficacy with quality-of-life issues. Although the number of cases of B-CLL examined in this report was relatively small, our data suggest that in vitro chemosensitivity testing of the type performed in this study is not particularly helpful in predicting in vivo responses of patients to monoagent therapy consisting of either fludarabine or chlorambucil. One limitation of the study is that we were unsuccessful in performing adequate in vitro studies of sensitivity to chlorambucil, whereas one half of the patients were treated with this alkylating agent. Nevertheless, when the analysis was limited only to those patients who received fludarabine, as opposed to chlorambucil (n = 21), again no statistically significant correlations were obtained.
Multiple factors could potentially account for the discrepancy between in vitro and in vivo responses to chemotherapeutic drugs, including (1) differences in tissue compartments and local environmental signals that affect chemosensitivity of B-CLLs in peripheral blood, bone marrow, and nodes; (2) sampling bias introduced by basing analyses on peripheral blood drawn at a single time; (3) differences between in vitro and in vivo metabolism of drugs to active or inactive products; (4) differences in the duration of treatment in vitro and in vivo and the kinetics of responses measured in culture versus in the patient; and (5) the possibility that clinical responses of B-CLL cells to fludarabine or chlorambucil may reflect more than merely the efficiency with which these drugs induce apoptosis, such as induction of immune cell-mediated killing in vivo. Regardless, it is interesting that B-CLLs exhibited two clearly different behaviors in vitro (ie, sensitive v resistant) with respect to induction of apoptosis by purine nucleoside analogues, implying either intrinsic or extrinsic (influenced by tissue culture conditions) differences in these two types of leukemia cells. Although these differences were not readily explainable by examination individually of several apoptosis-regulating proteins, it may be that development of more complicated statistical models that simultaneously consider the contributions of multiple anti- and pro-apoptotic proteins would have allowed such relations to be discerned. Thus, the data imply either that no one particular apoptosis-regulating protein is sufficiently dominant to account for these two types of in vitro chemoresponses or that other apoptosis-regulating proteins not examined in this report represent important variables. Of course, these two possibilities are not mutually exclusive.
The observation that higher rates of spontaneous apoptosis in culture correlated with in vitro sensitivity to fludarabine and 2-CdA implies that drug-sensitive B-CLL cells may be generally more easily induced to undergo apoptosis, perhaps because of intrinsic differences in the activities of apoptosis-controlling genes in these cells or differences in their requirements for environment survival factors (eg, cytokines or cell adhesion events), or both. Classic drug resistance mechanisms thus seem unlikely to account for the poor in vitro apoptotic responses to purine nucleosides observed for approximately one third of the B-CLLs studied here, particularly, because the B-CLL specimens were all derived from previously untreated patients. However, in the absence of direct comparisons of apoptosis data with studies of drug uptake, metabolism, and incorporation into DNA or RNA, we cannot be certain of this interpretation. Nevertheless, given that many B-CLLs (as compared with normal B cells) have been reported to be resistant to apoptosis induced by a variety of stimuli, including anti-Fas antibodies and TGF-β,39,40 it could be of interest in future studies to explore whether cross-resistance to several apoptotic stimuli can be used to segregate B-CLLs into apoptosis-sensitive and -resistant subgroups and further to attempt correlating this information with clinical outcome. Of note, unlike a previous study,41 we did not observe significant correlations between higher rates of spontaneous apoptosis and lower Rai stage. Our finding that B-CLL specimens that were resistant to fludarabine in vitro were also almost uniformly cross-resistant to 2-CdA agrees with clinical experience.42
Deletions at 13q14 represent probably the most common cytogenetic abnormality associated with B-CLL.33 Our comparisons of LOH at 13q14 with apoptosis-regulatory proteins revealed a marginal association with higher levels of the pro-apoptotic protein Bak (P = .04). The Bak gene has been mapped to chromosome 1 in humans (D. Tomei, personal communication), indicating that LOH at 13q14 cannot directly explain this correlation. Until the putative B-CLL suppressor gene located at 13q14 is identified, it seems premature to suggest specific mechanisms that might account for the observed association with higher Bak protein levels.
A major goal of this pilot study was to determine whether expression of any of the apoptosis-regulatory proteins described in this report might show promise as a predictor of clinical responses to chemotherapy in previously untreated B-CLL patients. Our analysis of 42 patients points to the need for further exploration of the anti-apoptotic Bcl-2 family protein Mcl-1. Expression of Mcl-1 has not been studied extensively in B cells, but it is induced in normal peripheral blood B cells by interleukin-4 (IL-4), anti-IgM, phorbol ester, and the combination of CD40 ligand and IL-13, all stimuli that prolong B-cell survival in vitro.43 Mcl-1 expression is also induced in B cells by the LMP-1 protein of Epstein-Barr virus (EBV).44Conversely, stimuli that promote apoptosis of normal peripheral blood B cells, such as transforming growth factor-β (TGF-β) and forskolin, have been shown to down-regulate Mcl-1 protein levels.43Compared with Bcl-2, the Mcl-1 protein has generally been less potent as a cell death blocker in gene transfer experiments, but all these studies have been limited to nonlymphoid cells, and hence do not address the issue of cellular context.45-47 Like Bcl-2, the Mcl-1 protein has been shown to be capable of heterodimerizing with Bax, at least in vitro, and can neutralize Bax-mediated cytotoxicity in yeast.47 As with Bcl-2, in vitro binding and yeast two-hybrid experiments also suggest that Mcl-1 can potentially bind to the anti-apoptotic proteins Bcl-2 and Bcl-XL, as well as the Bcl-2 accessory protein BAG-147,48 (unpublished data). Thus, to a great extent, Mcl-1 can probably be viewed as a substitute for Bcl-2. Unlike Bcl-2, however, the Mcl-1 protein appears to localize predominantly to endoplasmic reticulum and nuclear envelope with relatively less associated with mitochondrial membranes.49 Given that most B-CLLs contain high levels of Bcl-2, it is tempting to speculate that the combination of Mcl-1 and Bcl-2 may provide more than additive protection against apoptosis induced by chemotherapeutic drugs in vivo. Alternatively, the in vivo dynamics of Mcl-1 and Bcl-2 gene regulation in B-CLLs may create situations in which either Bcl-2 or Mcl-1 but not both of these anti-apoptotic proteins are present, thus affording B-CLLs that have the capacity to express both genes a greater advantage, when confronted with anticancer drugs. This situation would be analogous to normal B cells in which the mantle zone B cells surrounding germinal centers in the secondary follicles of lymph nodes have been shown to express high levels of Bcl-2, but not Mcl-1, whereas a reciprocal pattern of Mcl-1 and Bcl-2 expression has been documented for germinal center B cells.34
Higher levels of Mcl-1 protein were significantly associated with failure to attain CR, as determined by logistic regression analysis using continuous variable data (P = .001) and Fisher's exact test, for which an arbitrary cutoff of 1.0 relative to the lymphoma cell line RS11846 was used to dichotomize B-CLL patients into “low” and “high” Mcl-1 groups (P = .01). Since Mcl-1 protein levels were not significantly associated with Rai stage, in vitro drug responses, LOH at 13q14, or other variables examined in this report, Mcl-1 status may provide independent prognostic information for patients with B-CLL. However, the sample size of this study was insufficient to perform multivariate analysis. Moreover, the suggestion that high expression of Mcl-1 may correlate with failure to achieve CR in B-CLL should be viewed only as a hypothesis that can now be tested using additional independent data sets.
This caveat is also true for the BAG-1 data presented in this paper, which demonstrated a more marginal but nevertheless statistically significant (P = .04) association with failure to attain CR. An association between higher relative levels of BAG-1 and poorer in vivo responses to chemotherapy is conceptually consistent with data showing that BAG-1 can interact with Bcl-2 and enhance cellular resistance to apoptosis.26
Among the Bcl-2 family proteins evaluated in this report, only Mcl-1 displayed clear changes in its relative levels following exposure of CLLs to clinically relevant concentrations of fludarabine in vitro. The significance of this observation is unclear since similar drug-induced declines in Mcl-1 protein levels were detected in B-CLLs, regardless of whether they exhibited sensitivity or resistance to fludarabine in vitro. Nevertheless, it would be interesting in future studies to evaluate Mcl-1 protein levels in circulating CLL cells before and immediately after initiation of therapy to explore whether it has potential as a surrogate marker of clinical response.
In contrast to Mcl-1 and BAG-1, the association seen for lower Bcl-2:Bax ratios and failure to achieve CR is paradoxical but was only observed when data were dichotomized relative to the arbitrary standard (RS11846 cells) and was not noted when immunoblot data were analyzed as a continuous variable. Moreover, CART analysis50 failed to detect a significant percentage cutoff for dichotomization of Bcl-2:Bax immunoblot data that correlated with clinical response in this study (data not shown). Thus, unlike some previous studies,15,23 24 we failed to detect a correlation of higher Bcl-2:Bax ratios with worse prognostic features, and the only trend in these data was unexpectedly toward better response rates among patients with higher Bcl-2:Bax ratios.
Taken together, therefore, the data presented in this pilot study of previously untreated B-CLL patients demonstrate some of the complexities of apoptosis-regulatory gene expression in this disease. Although highly preliminary, the findings raise the possibility that Mcl-1 and possibly BAG-1 may provide prognostic information about clinical responses to chemotherapy. Additional independent studies involving larger groups of patients are needed to explore this hypothesis.
ACKNOWLEDGMENT
We thank H. Gallant and T. Potter for manuscript preparation.
Supported by National Institutes of Health Grant No. U01-CA-60421 and by an unrestricted educational grant (to S.K.) from Berlex Laboratories.
Address reprint requests to John C. Reed, MD, PhD, The Burnham Institute, Cancer Research Center, 10901 N Torrey Pines Rd, La Jolla, CA 92037.
The publication costs of this article were defrayed in part by page charge payment. This article must therefore be hereby marked "advertisement" is accordance with 18 U.S.C. section 1734 solely to indicate this fact.

This feature is available to Subscribers Only
Sign In or Create an Account Close Modal