Abstract
Although the importance of GATA-1 in both primitive and definitive hematopoietic lineages has been shown in vivo, the precise roles played by GATA-1 during definitive hematopoiesis have not yet been clarified. In vitro differentiation of embryonic stem (ES) cells using OP9 stroma cells can generate primitive and definitive hematopoietic cells separately, and we have introduced a method that separates hematopoietic progenitors and differentiated cells produced in this system. Closer examination showed that the expression of erythroid transcription factors in this system is regulated in a differentiation stage-specific manner. Therefore, we examined differentiation of GATA-1 promoter-disrupted (GATA-1.05) ES cells using this system. Because the GATA-1.05 mice die by 12.5 embryonic days due to the lack of primitive hematopoiesis, the in vitro analysis is an important approach to elucidate the roles of GATA-1 in definitive hematopoiesis. Consistent with the in vivo observation, differentiation of GATA-1.05 mutant ES cells along both primitive and definitive lineages was arrested in this ES cell culture system. Although the maturation-arrested primitive lineage cells did not express detectable amounts of ɛy-globin mRNA, the blastlike cells accumulated in the definitive stage showed β-globin mRNA expression at approximately 70% of the wild type. Importantly, the TER119 antigen was expressed and porphyrin was accumulated in the definitive cells, although the levels of both were reduced to approximately 10%, indicating that maturation of definitive erythroid cells is arrested by the lack of GATA-1 with different timing from that of the primitive erythroid cells. We also found that the hematopoietic progenitor fraction of GATA-1.05 cells contains more colony-forming activity, termed CFU-OP9. These results suggest that theGATA-1.05 mutation resulted in proliferation of proerythroblasts in the definitive lineage.
HEMATOPOIETIC CELLS serve as an important model system to analyze how lineage-specific transcription factors actively contribute to the regulation of the multi-lineage cell differentiation process. A number of transcription factors that regulate hematopoietic cell differentiation processes have been identified and characterized.1-3 We are interested in the regulation of erythroid differentiation and have been analyzing the functional roles of several erythroid transcription factors. The expression of erythroid transcription factors that have been characterized are not restricted to the erythroid lineage, but rather each factor shows a specific expression profile in several tissues or cell types including the erythroid lineage. Transcription factors expressed in erythroid cells include GATA-1, GATA-2, NF-E2, AML1, EKLF, Myb, PU1, rbtn2, and SCL/tal-1.4-12 These transcription factors have been suggested to work through the formation of a protein network and have been shown to be necessary for the development and/or function of erythroid lineage cells.13-22
Recently developed mouse technologies, such as transgenic overexpression or disruption of specific genes in vivo, have been shown to be very powerful for the functional analysis of transcription factors. However, these manipulations often result in embryonic lethality of the genetically engineered mice and thus make it impossible to analyze potential functions at later stages. Furthermore, to introduce a transgene to mice, selection of the vector is always technically intricate, so that even upon successful introduction of a transgene, expression of endogenous functions is artificially changed due to the ectopic overexpression of the transgene. An alternative and supplemental approach is to use cultured cell lines that reflect characteristics of hematopoietic lineages, because cultured cells are easy to manipulate. However, the disadvantage of the use of immortalized cell lines is that they always reflect only restricted aspects of in vivo differentiation processes and sometimes behave differently from their physiological counterparts.
In vitro differentiation of embryonic stem (ES) cells may overcome the detrimental aspects of the above-mentioned methods. Particularly, an advantage of the system is the ability to assess directly properties of manipulated ES cells that have been used to generate gene-disrupted mice. For instance, both knockout and knock-down analyses of the erythroid transcription factor GATA-1 resulted in embryonic lethality due to failure of yolk sac hematopoiesis,5 6 indicating that GATA-1 is necessary for the differentiation of primitive hematopoietic cells. However, because the GATA-1–deficient mice die by 12.5 embryonic days, which is before the full commencement of definitive hematopoiesis, alternative approaches are necessary to investigate definitive hematopoiesis.
Because the GATA-1 gene localizes to the X-chromosome23 and ES cells usually have a male karyotype, homologous recombination needs to be executed in only once to generate ES cells with a homozygous genotype for GATA-1 disruption. Taking advantage of this, several reports have already been published in which the GATA-1–disrupted ES cells were used.24-27 In one report an embryoid body formation method was used, which allowed the investigators to analyze both primitive and definitive hematopoiesis from ES cells in vitro.25 Importantly, GATA-1–null ES cells failed to generate primitive progenitors in that analysis.25 Definitive progenitors, in contrast, were normal in number but underwent developmental arrest and apoptosis at the proerythroblast stage. Arrested GATA-1(−)–definitive proerythroblasts expressed GATA target genes, such as β-major globin mRNA, at approximately normal levels.25 An erythroid cell line (G1E) was also generated from in vitro differentiated GATA-1(−) ES cells.27 G1E cells proliferate as immature erythroblasts yet complete erythroid maturation upon restoration of GATA-1 function, so that rescue of terminal erythroid maturation in G1E cells was used as a cellular assay system in which to evaluate the functional relevance of domains of GATA-1.
Among various ES cell differentiation systems,28-30 the method using OP9 cells has several remarkable advantages, among which is their potential to differentiate along erythroid lineage to finally give rise to enucleated red blood cells. ES cell–derived hematopoietic cells start floating during differentiation and can be obtained with culture media without any protease treatment.31 Therefore, cell-surface markers of the ES cell–derived hematopoietic cells could be analyzed by fluorescence-activated cell sorter (FACS). We also have introduced a method that separates hematopoietic progenitors and differentiated cells produced in this system. These important progress enabled us to assess precisely the function and target genes of GATA-1.
In this study, the GATA-1 knock-down mutant ES cells, which were also referred to as GATA-1.05 mutant ES cells,5 were examined in the OP9/ES cell in vitro differentiation system. The results clearly show that GATA-1 and other erythroid transcription factors are expressed in wild-type ES cell–derived hematopoietic cells, following the in vivo expression profiles. However, maturation of both primitive and definitive erythroid cells is blocked during differentiation of GATA-1.05mutant ES cells, but the timing of the arrest appears to be different. On the other hand, growth of the erythroid progenitors (named as CFU-OP9) was markedly induced by the GATA-1.05 mutation, demonstrating that GATA-1 regulates both proliferation and differentiation of erythroid cells.
MATERIALS AND METHODS
Cell culture.
E14 ES cells were used in this study.32 ES cells were maintained in the undifferentiated condition by using embryonic fibroblasts as feeder cells.33 OP9 cells were cultured as previously described.31,34 ES cells were differentiated in vitro following the method as reported previously,31 with minor modifications. We added 10 μg/mL stem cell factor (SCF; R&D Systems, Minneapolis, MN) and 2 IU/mL erythropoietin (EPO; Chyugai Pharmaceutical, Tokyo, Japan).
Colony assays.
ES-derived hematopoietic cells were cultured in semisolid Iscove’s modified Dulbecco’s medium (IMDM) supplemented with 0.8% methylcellulose, 20% fetal bovine serum (FBS), 1% bovine serum albumin (BSA), and cytokines. Cytokines supplemented for colony-forming unit-erythroid (CFU-E) assay were 2 IU/mL human EPO and for CFU–granulocyte and monocyte (CFU-GM) assay were 100 U/mL murine GM–colony-stimulating factor (GM-CSF; PeproTech, St James’ Square, London, UK), 100 U/mL murine interleukin-3 (IL-3; Genzyme, Cambridge, MA), and 10 ng/mL human IL-6 (PeproTech). Numbers of CFU-E were counted 2 days and those of CFU-GM were counted 7 days after the start of the culture.
Quantitative reverse transcriptase-polymerase chain reaction (RT-PCR) assays.
Total RNA was isolated by single-step RNA extraction system (RNA-zol, Tel-Test, Friendswood, TX). cDNA was synthesized with Superscript reverse transcriptase (Life Technologies, Rockville, MD) and amounts of the cDNAs were adjusted by dilution to produce equal amounts of hypoxanthine guanine phosphoribosyl transferase (HPRT) amplicon. PCR was performed using GeneAmp PCR system 9600 (Perkin-Elmer, Norwalk, CT) on a regimen of 94°C for 20 seconds, ramp time for 1 minute, 55°C for 1 second, and 72°C for 1 minute for cycle number as described in Table 1. The sequence of the primers used in this study is listed in Table1. Each primer set is designed to locate at least one intron between the two primer annealing sites to distinguish RT-PCR amplicon from that originated from genomic DNA template. Table 1 also lists cycle number for each set of primers. To assure linear amplification of test samples, control samples were always monitored, and ranges were determined in which dilution of the control sample results in linear reduction of the signal intensity. The cycle number was set to give rise to the intensity of each test sample always within this range.
Oligonucleotides Primers Used for RT-PCR Analyses
| Gene . | Amplicon Size (bp) . | Sense . | Antisense . | PCR Cycles . | Positive Control . |
|---|---|---|---|---|---|
| β-major globin | 447 | 5′ ATGGTGCACCTGACTGATGCTG 3′ | 5′ GGTTTAGTGGTACTTGTGAGCC 3′ | 30 | BM |
| εy-globin | 419 | 5′ AACCCTCATCAATGGCCTGTGG 3′ | 5′ TCAGTGGTACTTGTGGGACAGC 3′ | 30 | FL |
| c-kit | 458 | 5′ GCTCATAAATGGCATGCTCCAGTGT 3′ | 5′ GAAGTTGCGTCGGGTCTATGTAAAC 3′ | 36 | BM |
| GATA-1 | 263 | 5′ ACTCGTCATACCACTAAGGT 3′ | 5′ AGTGTCTGTAGGCCTCAGCT 3′ | 40 | BM |
| p45 | 288 | 5′ TCAGCAGAACAGGAACAGGT 3′ | 5′ GCTTTGACACTGGTATAGCT 3′ | 36 | BM |
| SCL | 277 | 5′ TAGCCTTAGCCAGCCGCTCG 3′ | 5′ GCGGAGGATCTCATTCTTGC 3′ | 43 | BM |
| EKLF | 360 | 5′ TCGCCGGAGACGCAGGCT 3′ | 5′ CCCAGTCCTTGTGCAGGA 3′ | 43 | BM |
| GATA-2 | 336 | 5′ TGCAACACACCACCCGATACC 3′ | 5′ CAATTTGGACAACAGGTGCCC 3′ | 43 | BM |
| c-myb | 522 | 5′ GAGCTTGTCCAGAAATATGGTCCTAAG 3′ | 5′ GGCTGCCGCAGCCGGCTGAGGGAC 3′ | 36 | BM |
| Nrf2 | 223 | 5′ CGAAAAGGAAAGACAAGAGC 3′ | 5′ TGGGAATGTCTCTGCCAAAA 3′ | 36 | BM |
| GATA-3 | 246 | 5′ TCTCACTCTCGAGGCAGCATGA 3′ | 5′ GGTACCATCTCGCCGCCACAG 3′ | 40 | BW5147 |
| ALAS-E | 581 | 5′ GTCCTGTGGAGGAATTGTGT 3′ | 5′ GTTTTCCATCATCTGAGGGC 3′ | 32 | BM |
| ALAD | 450 | 5′ AAGGAGCCTGAGAGAGTGGGAGCA 3′ | 5′ AGCTGCAGAGCCCTGTTCATCCTT 3′ | 34 | BM |
| PBGD | 431 | 5′ ACAACAGATCCTATTACAGCTTTT 3′ | 5′ AAGGTTTCCAGGGTCTTTCCAATA 3′ | 34 | BM |
| FC | 195 | 5′ TGTGGAGCTGAGAACAT 3′ | 5′ TCACAGCTGTTGGCTGG 3′ | 34 | BM |
| HPRT | 249 | 5′ GCTGGTGAAAAGGACCTCT 3′ | 5′ CACAGGACTAGAACACCTGC 3′ | 36 |
Abbreviations: BM, bone marrow; FL, fetal liver.
Flow cytometry analysis.
Harvested ES cells in floating fraction were washed twice with phosphate-buffered saline (PBS) and concentrated in 50 μL of 4% BSA/PBS solution. First antibody was added to this solution and incubated for 20 minutes on ice. Anti-TER119, –Mac-1, and -B220 monoclonal antibodies (PharMingen, San Diego, CA) were used as the first antibodies. After washing with PBS, fluorescein isothiocyanate–conjugated anti-rat Ig (PharMingen) was added to the suspension of cells. These cells were also stained with 4 μg/mL propidium iodide/PBS and subjected for FACS analysis with FACS Calibur (Becton Dickinson, Franklin Lakes, NJ). Cells lost their viability were counted as propidium iodide–positive cells. These cells were gated out when measuring each first antibody-positive cells.
Measurement of porphyrin content.
A total of 5 × 10⁴ cells in the floating fraction were prepared for porphyrin analysis as described.35Porphyrin fluorescence was measured by a Hitachi F-2000 fluorescence spectrophotometer (Hitachi Ltd, Hitachi, Japan) in comparison with hemin standard solution.
RESULTS
A method to facilitate fractionation of hematopoietic progenitors from differentiated cells.
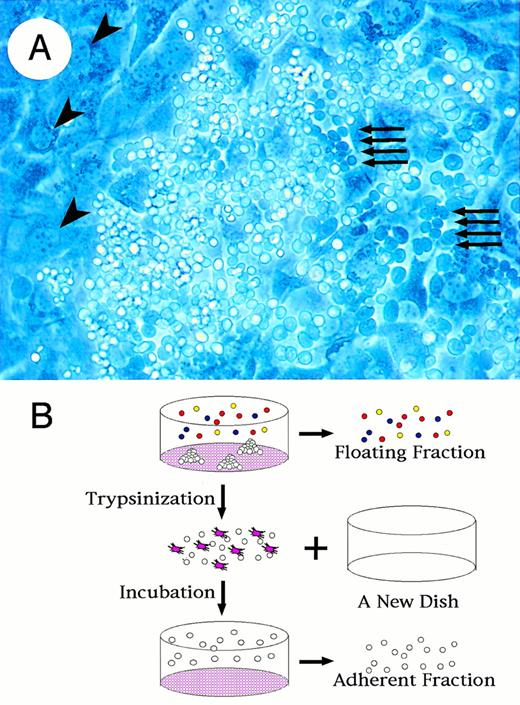
To examine the contribution of transcription factors to hematopoietic cell differentiation processes, we cultured ES cells on OP9 cells.31 During culture in differentiation medium, we found that the ES cells were clustered adhering to and submerging beneath the OP9 cell layer (Fig 1A). The ES cells show a typical cobblestone formation, which is known to be characteristic for early hematopoietic progenitors,36 37indicating that this ES cell differentiation system can represent the early hematopoietic cell differentiation process in addition to the previously identified terminal maturation process of several hematopoietic lineages.
Fractionation of hematopoietic progenitors from differentiated cells in OP9/ES cell differentiation system. (A) Formation of cobblestone is observed with a phase-contrast microscopy at day 14 of ES cell culture. Dark round cells indicated by arrows are hematopoietic progenitors lying beneath OP9 layer. Large irregular-shaped cells indicated by arrowheads are OP9 cells. (B) Schematic presentation of the method to prepare floating and adherent fractions. First, floating fractions are harvested with culture media. Adherent cells are then disaggregated transiently by trypsin and transferred to a new culture dish. After a 1-hour incubation, which makes OP9 cells adhere to the dish, the floating cells are obtained from media (adherent fraction).
Fractionation of hematopoietic progenitors from differentiated cells in OP9/ES cell differentiation system. (A) Formation of cobblestone is observed with a phase-contrast microscopy at day 14 of ES cell culture. Dark round cells indicated by arrows are hematopoietic progenitors lying beneath OP9 layer. Large irregular-shaped cells indicated by arrowheads are OP9 cells. (B) Schematic presentation of the method to prepare floating and adherent fractions. First, floating fractions are harvested with culture media. Adherent cells are then disaggregated transiently by trypsin and transferred to a new culture dish. After a 1-hour incubation, which makes OP9 cells adhere to the dish, the floating cells are obtained from media (adherent fraction).
We designed a method to separate cells submerged beneath or adhering tightly to the OP9 feeder from those loosely adhering to or floating from the OP9 cell layer; we used the quickly adhering nature of the OP9 cells to culture dishes. As summarized in Fig 1B, cells spontaneously floating into the culture supernatant were first collected (“floating fraction”). Then adherent cells including OP9 cells were trypsinized, transferred to a new culture dish, and incubated for 1 hour to let OP9 cells adhere to the culture dish. Floating cells after the incubation were obtained from the resulting culture supernatant. Approximately 90% of OP9 cells were removed through this procedure, with only 0.5% loss of the ES-derived cells (“adherent fraction”).
The adherent fraction contains more progenitors than the floating fraction.
When the number of progenitors in each fraction was measured by means of a colony assay, approximately 10 times more CFU-E and CFU-GM were detected in the adherent fraction than in the floating fraction (Fig 2). Thus, this result shows the successful fractionation of hematopoietic progenitors from differentiated hematopoietic cells derived from the ES cells. The OP9/ES cell differentiation system has been shown to be augmented by the addition of EPO and inhibited by blocking the signaling through c-Kit.38 Therefore, we added EPO and SCF to the culture medium to improve induction efficiency. Whereas the addition of the cytokines did not influence the number of total floating cells and that of dianisidine-positive cells during the first 7 days of culture, by day 14 the numbers of total floating cells and dianisidine-positive cells were both increased to approximately 40 times more than those of the ES cells cultured without the addition of the cytokines (data not shown). Therefore, based on this observation, we used the two cytokines in this study to force the progenitor cells in the adherent fraction to differentiate.
Adherent fraction contains more progenitors than does the floating fraction. Numbers of CFU-E and CFU-GM in the day 11 culture are shown. Gray bar and hatched bar show numbers of hematopoietic colonies in the adherent and floating fractions, respectively.
Adherent fraction contains more progenitors than does the floating fraction. Numbers of CFU-E and CFU-GM in the day 11 culture are shown. Gray bar and hatched bar show numbers of hematopoietic colonies in the adherent and floating fractions, respectively.
Expression profiles of erythroid transcription factors in the differentiation system.
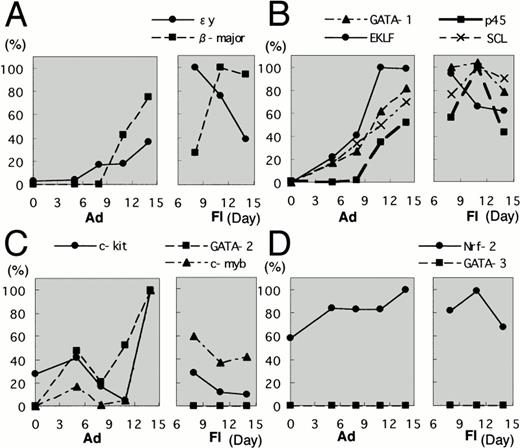
To examine how erythroid differentiation proceeds in the ES cell culture system, adherent and floating fractions were collected at several time points from the in vitro ES cell culture system. Expression levels of mRNA encoding εy- and β-major globins were first measured by RT-PCR. In this and following analyses, amounts of the cDNAs were adjusted by dilution to produce equal amount of HPRT amplicon and, after the adjustment, the relative percentage was calculated based on the maximal gene expression. Both εy- and β-major globin mRNAs were found to be more abundant in the floating fraction than in the adherent fraction (Fig3A). It should be noted that expression of the two globin genes peaked at different time points. In the case of εy-globin, floating cells at day 8 showed peak-level expression and then the expression decreased, whereas the expression of β-major globin increased gradually and reached peak levels at days 11 and 14 (Fig 3A). These data are consistent with previous observations for the OP9 system, in that primitive hematopoiesis appears early at approximately day 8, whereas definitive hematopoiesis appears late at around day 14.38
Expression profiles of erythroid transcription factors in the OP9/ES cell differentiation system. Adherent and floating fractions were collected at time points indicated from the in vitro ES cell culture system. Concentrations of all the prepared cDNAs were adjusted to produce equal amounts of HPRT amplicon. Expression levels of mRNA encoding ɛy- and β-major globins were first measured by RT-PCR (A). The expression profiles of erythroid transcription factors during the differentiation of ES cells were then examined. The expression profiles are categorized into three groups. The first group includes GATA-1, p45, EKLF, and SCL (B); the second group consists of GATA-2 and c-myb (C); and the third group includes Nrf2 and GATA-3 (D). Each group is shown as a pair of boxes; the left box represents the adherent fraction and the right box represents the floating fraction. Highest expression for each factors is set to 100%.
Expression profiles of erythroid transcription factors in the OP9/ES cell differentiation system. Adherent and floating fractions were collected at time points indicated from the in vitro ES cell culture system. Concentrations of all the prepared cDNAs were adjusted to produce equal amounts of HPRT amplicon. Expression levels of mRNA encoding ɛy- and β-major globins were first measured by RT-PCR (A). The expression profiles of erythroid transcription factors during the differentiation of ES cells were then examined. The expression profiles are categorized into three groups. The first group includes GATA-1, p45, EKLF, and SCL (B); the second group consists of GATA-2 and c-myb (C); and the third group includes Nrf2 and GATA-3 (D). Each group is shown as a pair of boxes; the left box represents the adherent fraction and the right box represents the floating fraction. Highest expression for each factors is set to 100%.
We next investigated the expression profiles of erythroid transcription factors during the differentiation of ES cells into hematopoietic cells. Each sample was obtained at the same timing as described above. We found that the expression profiles are categorized into three groups. The first group includes GATA-1, p45, EKLF, and SCL (Fig 3B). mRNAs for these transcription factors were undetectable at day 0, but the expression was gradually increased during cell culture. These mRNA expression levels were more abundant in the floating fraction than in the adherent fraction. Thus, the expression of this group of transcription factors was suggested to increase along with the progress of erythroid differentiation. The results also showed that these factors are expressed in primitive as well as definitive hematopoietic cells.
The second group consists of GATA-2 and c-myb(Fig 3C). The mRNAs for these factors were expressed more abundantly in the adherent fraction than in the floating fraction, and this profile was similar to that of c-kit. In particular, the expression of GATA-2 mRNA is so low in the floating fraction that we could not detect expression in the RT-PCR analysis. Because progenitors are enriched in the adherent fraction, this result shows that both transcription factors are mainly expressed in hematopoietic progenitors.
The third group includes Nrf2 and GATA-3 (Fig 3D). Nrf2 mRNA expression was uniformly observed in both the adherent and floating fractions throughout the differentiation period, so that no correlation of Nrf2 to hematopoietic cell differentiation was found in this ES cell differentiation system. In contrast to Nrf2, GATA-3 mRNA was undetectable in all samples. This is quite intriguing if we consider the fact that GATA-3 is an important transcription factor for T-cell development39,40 and that T-cell differentiation has never been observed in this OP9/ES differentiation system.31 The failure to induce expression of GATA-3 gene may explain why it has, until now, been impossible to differentiate ES cells into T cells.
ES cells with the GATA-1.05/Y genotype differentiate into blastlike cells.
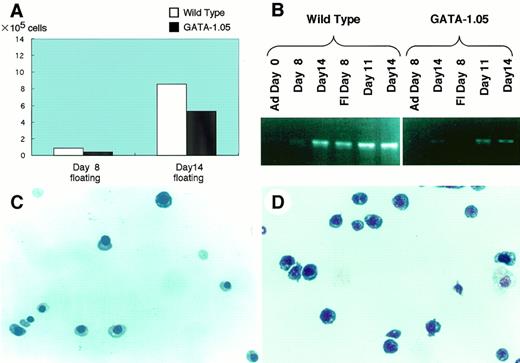
We recently succeeded in making ES cells with a GATA-1 knock-down orGATA-1.05 allele.5 To further dissect the function of GATA-1, we analyzed the GATA-1.05/Y ES cells using the OP9/ES cell in vitro differentiation system. The GATA-1.05mutant ES clones produced slightly decreased numbers of floating cells at both days 8 and 14 (Fig 4A [see page 4113]). In the day 8 floating cells, representing primitive hematopoiesis, GATA-1 mRNA expression was below detection levels even with the sensitive RT-PCR method (Fig 4B). In contrast, GATA-1 mRNA expression was detectable in the definitive lineage (ie, see the day 14 floating cells), although the expression level was significantly lower than that of the wild type. Through quantitative PCR analysis, we found that, compared with wild-type ES cells, only 7.8% of GATA-1 was expressed in the day 14 GATA-1.05 cells (data not shown). Wright-Giemsa staining of the wild-type day 14 floating cells showed erythroid cells at various differentiation stages, including the enucleated mature red blood cell (Fig 4C). Importantly, we found an increased number of blastlike cells. Approximately 80% of cells in the floating fraction from the mutant ES clones are the blastlike cells and the cells appeared morphologically to be proerythroblasts (Fig 4D).
ES cells with GATA-1.05/Y genotype differentiate into blastlike cells. Differentiation of GATA-1.05/Y ES cells were examined using the OP9/ES cell in vitro differentiation system. (A) Numbers of floating cells produced by GATA-1.05mutant ES clones at both day 8 and 14. (B) Quantitative RT-PCR analysis of GATA-1 mRNA expression in the wild-type and GATA-1.05ES cells. (C and D) Wright-Giemsa staining of the wild-type and mutant day 14 floating cells.
ES cells with GATA-1.05/Y genotype differentiate into blastlike cells. Differentiation of GATA-1.05/Y ES cells were examined using the OP9/ES cell in vitro differentiation system. (A) Numbers of floating cells produced by GATA-1.05mutant ES clones at both day 8 and 14. (B) Quantitative RT-PCR analysis of GATA-1 mRNA expression in the wild-type and GATA-1.05ES cells. (C and D) Wright-Giemsa staining of the wild-type and mutant day 14 floating cells.
Previous analysis of GATA-1 knockout ES cells showed that EPO-responsive cells differentiated along the erythroid lineage and died at the proerythroblast stage.25 However, identification of these stages relied solely on morphological observations and no surface marker studies were conducted in that analysis. Because only a small number of ES cell–derived hematopoietic cells could be recovered in the previous method, FACS analysis was technically not feasible. In contrast, the OP9/ES cell differentiation system produces a large quantity of floating cells derived from the ES cells and is, therefore, suitable for FACS analysis.31
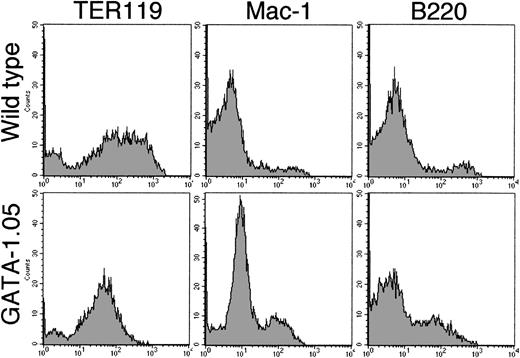
We exploited this improvement and examined the expression of lineage-specific surface antigens on the cells of the day 14 floating fraction from both wild-type and GATA-1.05 mutant ES cells. FACS analysis using three surface antigens showed that cells with TER119 antigen, a late erythroid marker, were detected in both the wild-type and mutant floating fractions. To our surprise, TER119-positive cells occupied 82% of the total GATA1.05mutant floating fraction (Fig 5). This number was similar to that of the blastlike cells observed in the floating fraction from the mutant ES cells (see above). However, the important finding here is that, whereas the wild-type floating cells showed an intensity range of 102 to 103 for the TER119 antigen, the mutant floating cells did not show such strong intensity, indicating that GATA-1.05 mutant definitive cells express a relatively low level of the TER119 antigen. Mac-1 and B220 antigen–positive cells also existed in both the wild-type and mutant floating fractions. Numbers and intensities of the latter two antigen-positive cells were almost similar to those from the wild-type ES clones (Fig 5). Thus, the blastlike cells in the mutant floating fraction are erythroid lineage cells. The differentiation ofGATA-1.05 mutant ES cells along the definitive erythroid lineage reaches the stage at which the TER119 antigen is expressed, albeit at a low level, but the maturation of the cells is arrested at this stage.
FACS analysis of the lineage-specific surface antigens. Cells of day 14 floating fraction from both wild-type andGATA-1.05 mutant ES cells were analyzed with FACS using three surface antigens as indicated in the figure. Note that, whereas the wild-type floating cells showed 102 to 103fluorescence intensity range for TER119 antigen, the mutant floating cells did not show such strong intensity. Upper three histograms show results of wild-type cells, while lower three show results ofGATA-1.05 mutant cells.
FACS analysis of the lineage-specific surface antigens. Cells of day 14 floating fraction from both wild-type andGATA-1.05 mutant ES cells were analyzed with FACS using three surface antigens as indicated in the figure. Note that, whereas the wild-type floating cells showed 102 to 103fluorescence intensity range for TER119 antigen, the mutant floating cells did not show such strong intensity. Upper three histograms show results of wild-type cells, while lower three show results ofGATA-1.05 mutant cells.
Decrease of porphyrin content and mRNAs for heme biosynthesis enzymes in GATA-1.05 mutant hematopoietic cells.
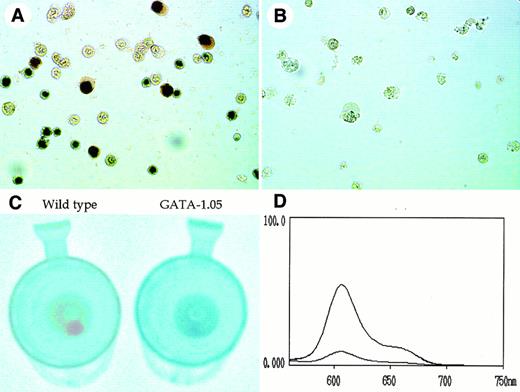
The stage of erythroid cells in the OP9/ES cell differentiation system was monitored not only by the morphological appearance but also by hemoglobin staining using dianisidine. Although approximately 43% of the wild-type cells in the day 8 floating fraction stained positive for dianisidine (Fig 6A), we could not find any dianisidine-positive cells in the GATA-1.05 mutant cells (Fig 6B). This indicates that the mutant ES cells cannot differentiate into mature primitive erythroid cells, being in very good agreement with our previous in vivo analysis showing that primitive erythroid cells were arrested at the immature stage.5
Decrease of porphyrin content in GATA-1.05 mutant hematopoietic cells. (A and B) Dianisidine staining of the wild-type and GATA-1.05 mutant cells in the day 8 floating fraction, respectively. (C) Color comparison of floating cell pellet at day 14. (D) Measurement of the porphyrin content in the cells. The fluorescence spectra in lysate of both wild-type and GATA-1.05 floating fraction showed the specific profile of porphyrins. The spectrum of the higher peak shows wild type and that with the lower peak shows the mutant results.
Decrease of porphyrin content in GATA-1.05 mutant hematopoietic cells. (A and B) Dianisidine staining of the wild-type and GATA-1.05 mutant cells in the day 8 floating fraction, respectively. (C) Color comparison of floating cell pellet at day 14. (D) Measurement of the porphyrin content in the cells. The fluorescence spectra in lysate of both wild-type and GATA-1.05 floating fraction showed the specific profile of porphyrins. The spectrum of the higher peak shows wild type and that with the lower peak shows the mutant results.
In contrast, 67% of wild-type cells and 32% of the GATA-1.05mutant cells in the day 14 floating fraction were positive for dianisidine staining. We suspect that cells containing small amounts of hemoglobin might all be counted as dianisidine-positive, because dianisidine staining is a very sensitive method. Therefore, the considerably high number of dianisidine positive cells in the mutant floating fraction might not reflect the actual difference in expression level of hemoglobin. Indeed, when the colors of floating cell pellets were compared at day 14, the pellet of the mutant cells was apparently white and that of the wild-type cells was red (Fig 6C).
This observation suggested that either globin protein or porphyrin content in the floating fraction of GATA-1.05 might be diminished considerably. Therefore, we measured the porphyrin content in the cells. To this end, an excitation beam of 400-nm wave length was used to emit fluorescence from the cell extracts, and the characteristic pattern of fluorescence spectrum with a peak emission at 600 nm was monitored using a fluorescence spectrophotometer. The fluorescence spectra from lysates of both wild-type andGATA-1.05 floating fractions showed the specific profile of porphyrins (Fig 6D). Importantly, porphyrin content in theGATA-1.05 mutant floating cells was reduced to 13% of that of the wild-type cells. This observation thus shows that heme synthesis is severely affected in the GATA-1.05 mutant definitive erythroid cells and that differentiation of the GATA-1.05 mutant ES clones along the definitive erythroid lineage is arrested before heme/porphyrin synthesis is fully commenced.
Impaired expression of heme biosynthetic enzymes in GATA-1.05 mutant.
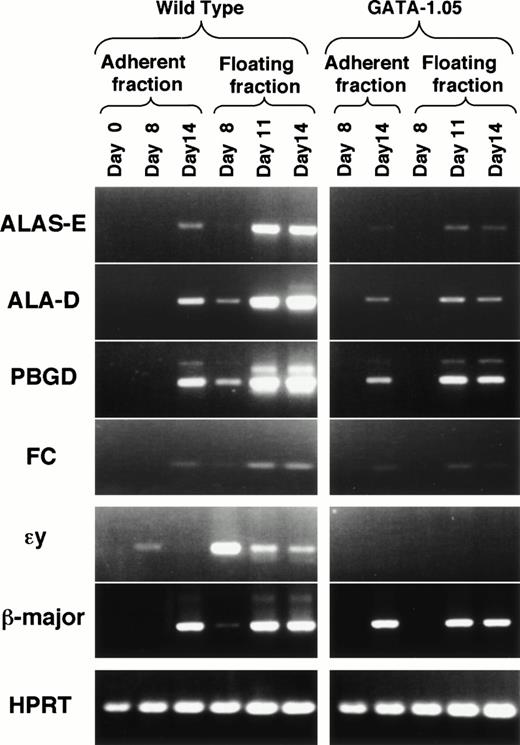
To ask how porphyrin synthesis proceeds in this ES cell differentiation system or how it is affected in the GATA-1.05 mutant cells, we examined expression of mRNAs encoding four heme biosynthetic pathway enzymes in the wild-type and GATA-1.05 mutant hematopoietic cells using RT-PCR. mRNAs for erythroid-specific 5-aminolevulinate synthase (ALAS-E), 5-aminolevulinate dehydratase (ALAD), porphobilinogen deaminase (PBGD), and ferrochelatase (FC), the first three and the last enzymes of this pathway, could not be detected in the uninduced ES cells (Fig 7; day 0 in the adherent fraction). The mRNAs for these enzymes first became detectable in the floating fraction cells by day 8, indicating that these mRNAs are expressed in the primitive hematopoietic cells (Fig 7). Expression of mRNAs for these enzymes was significantly induced in the floating fraction by day 11 and adherent fractions by day 14. These results indicate that the expression of the heme pathway enzymes was induced when hematopoietic progenitor cells committed to and started differentiation along the erythroid lineage.
Impaired expression of heme biosynthetic enzymes inGATA-1.05 mutant. The expression of mRNAs for four heme biosynthetic pathway enzymes were examined in the wild-type andGATA-1.05 mutant hematopoietic cells. Amounts of the cDNAs used for the RT-PCR analyses were adjusted by dilution to produce equal amount of HPRT amplicon. The expression of two β-type globin mRNAs was also examined. ɛy-globin mRNA is expressed only in primitive erythroid cells, whereas β-major globin mRNA is expressed in definitive erythroid cells.
Impaired expression of heme biosynthetic enzymes inGATA-1.05 mutant. The expression of mRNAs for four heme biosynthetic pathway enzymes were examined in the wild-type andGATA-1.05 mutant hematopoietic cells. Amounts of the cDNAs used for the RT-PCR analyses were adjusted by dilution to produce equal amount of HPRT amplicon. The expression of two β-type globin mRNAs was also examined. ɛy-globin mRNA is expressed only in primitive erythroid cells, whereas β-major globin mRNA is expressed in definitive erythroid cells.
In contrast to the expression profiles in the wild-type ES cells, expression of these mRNAs was significantly decreased in theGATA-1.05 mutant floating fraction cells. In day 8 floating fraction of the GATA-1.05 mutant cells, mRNAs for the four heme biosynthetic enzymes were all below detection level. In day 14 mutant floating fraction, the relative expression levels of ALAS-E, ALAD, PBGD, and FC mRNAs were 2.2%, 9.4%, 25.9%, and 10%, respectively, of the wild-type ES-derived cells (Fig 7). The decrease of heme pathway enzymes resulted in the reduction in porphyrin content (see Fig 6D). These observations unequivocally show that the heme pathway enzyme genes are regulated, either directly or indirectly, by GATA-1, and that one of the major contributions of GATA-1 to the erythroid differentiation process is to activate the expression of heme biosynthetic pathway enzymes.
Expression of two β-type globin mRNAs was examined in parallel. While εy-globin mRNA is expressed only in primitive hematopoiesis and behaves as a marker gene for primitive hematopoiesis, β-major globin mRNA is expressed in definitive hematopoietic cells. InGATA-1.05 mutant cell differentiation, the expression of εy-globin mRNA was not detectable at any time. Expression of β-major globin mRNA also was not observed at day 8. This is consistent with the observation that GATA-1 expression was not detectable during primitive hematopoiesis. On the other hand, β-major globin mRNA expression was not so severely affected in the mutant floating fraction at day 14 (69% of wild type). This was an unexpectedly high level of expression because GATA-1 was expressed at only 7.8% of the normal level and porphyrin was accumulated at 13% in the GATA-1.05 mutant cells. These data indicate that the expression of heme biosynthetic enzyme genes depends more profoundly on GATA-1 than does the β-major globin gene.
GATA-1.05 mutant erythroid cells cease differentiation without losing viability.
Data obtained thus far indicate that the GATA-1.05 mutant cells in the day 14 floating fraction have already committed to the definitive erythroid lineage, but further maturation was arrested. In this regard, there existed a possibility that erythroid cells all died after certain stages of differentiation, so that mature erythroid cells were not detected in this experiment. Indeed, erythroid cells derived from GATA-1 knockout ES cells were reported to undergo apoptosis after the proerythroblast stage in a different ES cell differentiation system.37 Therefore, we examined viability of the cells in the floating fraction by two independent methods, ie, trypan blue dye exclusion assay and propidium iodide staining. In the former method, more than 90% of both the wild-type and mutant cells were counted as viable cells. In the latter method, 79% of the wild-type and 82% of the mutant cells were also found to be viable (Table 2). These results indicate that the prominent increase of immature erythroid cells in the GATA-1.05mutant is not caused by death or disappearance of differentiated cells, but rather is caused by maturation arrest of erythroid cells.
GATA-1.05 mutant hematopoietic cells grow rapidly after replating.
Because fetal liver cells from the GATA-1.05/Y mice did not form erythroid colonies efficiently in a standard colony assay,5 an alternative approach was necessary to assess the colony-forming activity of GATA-1.05 hematopoietic progenitors. In this regard, the adherent fraction cells of the OP9/ES cell differentiation system are found to contain hematopoietic progenitors, which form colonies on the OP9 feeder cell layer (see Fig 1). It has already been shown that the hematopoietic progenitors in the OP9/ES cell culture system have the ability to form colonies when replated onto the OP9 layer, and the number of these replating colonies tightly correlates with those of hematopoietic cells finally obtained.31
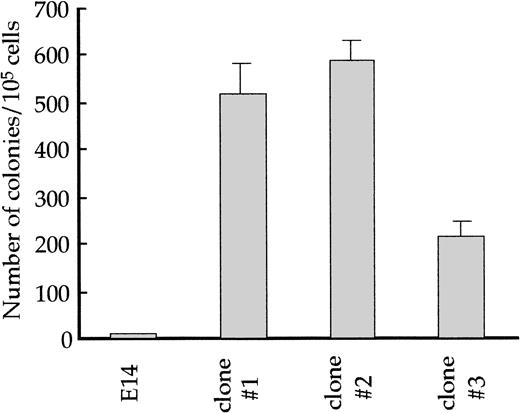
To investigate the nature of the GATA-1.05 hematopoietic progenitors, the adherent fraction cells were isolated at day 14 of the culture and seeded onto another OP9 layer after dilution. Colonies were found to be formed after 3 days in culture, and we referred to the progenitors as CFU-OP9 in this study. The CFU-OP9 number ofGATA-1.05 mutant and wild-type cells were counted at this stage. To our surprise, whereas the wild-type adherent fraction cells produced only 9 ± 1 CFU-OP9/105 cells, theGATA-1.05 mutant cells produced more than 200 CFU-OP9/105 cells (Fig 8). This result thus indicates that the cells in the day 14 adherent fraction of the GATA-1.05 mutant contain a dramatic increase in CFU-OP9 progenitors compared with wild type, and it also suggests that GATA-1 deficiency promotes the growth of immature hematopoietic cells.
Replating efficiency of wild-type and GATA-1.05mutant ES cell–derived hematopoietic progenitors. The adherent fraction cells contain hematopoietic progenitors that can form colonies on the OP9 feeder layer (CFU-OP9). The adherent fraction cells at day 14 were isolated and seeded on another OP9 layer. After 3 days in culture, colonies formed on OP9 were counted from three independentGATA-1.05 mutant ES cell lines and wild-type ES cells.
Replating efficiency of wild-type and GATA-1.05mutant ES cell–derived hematopoietic progenitors. The adherent fraction cells contain hematopoietic progenitors that can form colonies on the OP9 feeder layer (CFU-OP9). The adherent fraction cells at day 14 were isolated and seeded on another OP9 layer. After 3 days in culture, colonies formed on OP9 were counted from three independentGATA-1.05 mutant ES cell lines and wild-type ES cells.
Erythroid transcription factor expression in GATA-1.05 mutant hematopoietic cells.
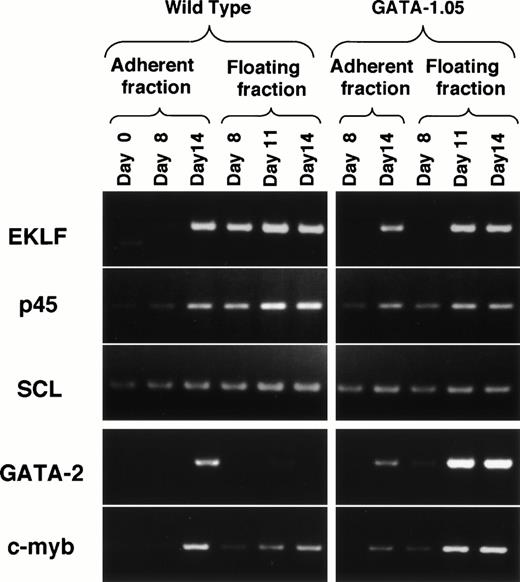
The GATA-1.05 mutation probably also introduced perturbation into the transcription factor regulatory network. Therefore, we analyzed the consequence of the perturbation on expression of other erythroid-specific transcription factors and the following observations are important. First, the expression of EKLF was not observed in the mutant day 8 floating fraction cells (Fig9). This is in sharp contrast to the situation with wild-type ES cells (Fig 9; see also Fig 3B). Similarly, the expression of p45 and SCL in the same fraction decreased to 50% and 70%, respectively. As the expression level of GATA-1 is practically undetectable in primitive hematopoietic cells of the GATA-1.05 mutant, this observation suggests that GATA-1 is essential for the expression of the EKLF gene in the primitive erythroid cells.
Expression of erythroid transcription factors in the wild-type and GATA-1.05 mutant hematopoietic cells. To understand the consequence of the perturbation introduced by theGATA-1.05 mutation, expression of mRNAs for five erythroid transcription factors was monitored by RT-PCR analysis.
Expression of erythroid transcription factors in the wild-type and GATA-1.05 mutant hematopoietic cells. To understand the consequence of the perturbation introduced by theGATA-1.05 mutation, expression of mRNAs for five erythroid transcription factors was monitored by RT-PCR analysis.
Secondly, the expression of GATA-2 was induced markedly in the day 11 and 14 floating fraction of GATA-1.05 mutant cells, whereas the expression was undetectable in the wild-type floating fraction. Increase of GATA-2 mRNA in GATA-1–deficient cells has also been reported in a different ES cell differentiation system.25c-myb expression also was increased in this fraction. It should be noted that the day 14 floating fraction of GATA-1.05 mutant contains approximately eightfold more blastlike cells than the wild-type fraction. Therefore, we normalized the increase of GATA-2 using the c-myb datum, assuming that the increase in c-myb expression might reflect the enrichment of proerythroblasts. Even after the normalization, the GATA-2 expression was increased more than 100-fold in the GATA-1.05 mutant floating fraction than in the same fraction of wild type. Thus, this result suggests that GATA-2 gene expression is induced in each cell in the absence of GATA-1.
DISCUSSION
In vitro ES cell differentiation is powerful in analyzing mechanisms of hematopoiesis. Of the various ES cell differentiation systems available to date, the OP9 system has a unique feature in that mature hematopoietic cells can be obtained as floating cells in culture media.31 Detachment of the cells from the OP9 feeder cell layer is most likely caused by the maturation of the cells, because the cells adherent to the OP9 feeder layer are immature progenitors. Applying the OP9 system to the GATA-1.05 mutant ES cells, we have examined the consequence of GATA-1 deficiency in the differentiation of both primitive and definitive erythroid lineages and of perturbation of the transcription factor regulatory network generated by the mutation. The results unequivocally showed that the GATA-1 deficiency results in maturation arrest in both the primitive and definitive erythroid lineages, although the timing of the arrest is distinct in each lineage. In contrast, the replating activity of the ES cell–derived hematopoietic progenitor, which we refer to as CFU-OP9, is stimulated more than 20-fold by the GATA-1.05 mutation, suggesting that loss of GATA-1 favors growth of progenitor cells. Thus, GATA-1 appears to regulate both growth and differentiation of erythroid lineage cells during in vitro ES cell differentiation.
The OP9/ES cell differentiation system allows us to analyze the consequences of artificial gene manipulation in hematopoiesis even if the loss of expression of a particular gene results in embryonic lethality. GATA-1.05/Y mutant mice die due to the lack of primitive hematopoiesis,5 so that the precise assessment of the contribution of GATA-1 to the definitive lineage requires an in vitro system like that presented here. In addition, because of the nature of the system, detailed expression of the GATA-1 gene can be examined in primitive and definitive hematopoietic lineages. Results of the latter analysis clearly indicate that the GATA-1.05mutation completely abolished (or knocked out) GATA-1 gene expression in the primitive lineage and enfeebled (or knocked down) the expression in the definitive lineage. As the GATA-1.05 mutation was generated in ES cells by insertion of the neomycin-resistance gene in front of the erythroid-specific promoter/first exon (IE promoter/exon), we suspect that interference by the strong MC-1 promoter perhaps caused the disruption of the IE promoter activity. Although the reason for the difference in severity of the disruption in the primitive and definitive lineages remains to be clarified, we recently found that GATA-1 gene expression in the two hematopoietic lineages is regulated by two distinct regulatory regions41 and we suspect that this might be related to the emergence of the two different phenotypes.
We found in this study that the GATA-1.05 mutant ES cells can differentiate along the primitive and definitive lineages and finally give rise to the floating fraction. However, maturation of the ES-derived progenitors ceased at proerythroblast stage and no further maturation of the blasts was observed. Because this observation is quite consistent with the previous report using GATA-1 gene knockout ES cells,25 we conclude that the GATA-1.05 mutation is similar to the null mutation of the GATA-1 gene in this respect and that the residual amount of GATA-1 in our GATA1.05 system cannot induce further maturation of the ES cells. The important finding here is that, while the expression of TER119 erythroid-specific surface antigen and porphyrin accumulation are detected in the definitive erythroblasts of the wild type, expression of these erythroid markers was also detectable, albeit weakly, in the GATA-1.05 ES-derived cells. These results suggest that commitment of hematopoietic stem cells to the erythroid lineage occurs without GATA-1, but GATA-1 is necessary for the progenitors to further differentiate along this lineage.
Proerythroblasts from the GATA-1.05 ES cells showed viability essentially similar to those from the wild-type ES cells. Thus, significant cell death including apoptosis was suggested not to occur in GATA-1.05 cells during the differentiation culture. In contrast, GATA-1–null ES cells were previously reported to have decreased viability due to apoptosis after the proerythroblast stage.27 One plausible explanation for this difference is that the residual 7.8% GATA-1 in our GATA-1.05 system may be sufficient to prevent apoptosis of differentiation-arrested blasts, but the amount of GATA-1 is not sufficient to drive erythroid differentiation of the cells. An alternative explanation is that the presence of the OP9 cell layer may affect the fate of arrested progenitor cells.
Erythroid progeniors derived from the GATA-1–null ES cell are reported to express globin mRNAs at an approximately similar level to that of erythroid cells derived from wild-type ES cells.25Consistent with the observation, our present analysis shows that the expression of β-major globin gene is not so significantly affected by the GATA-1.05 mutation. These observations raise a question as to why the differentiation of erythroid cells is arrested in theGATA-1.05 mutant erythroid cells. In this analysis we found that the expression of four heme biosynthetic enzyme genes is severely affected by the GATA-1.05 mutation. The impairment is so severe that porphyrin content in GATA-1.05 mutant cells is decreased to approximately 13% of that in wild-type ES cell–derived hematopoietic cells (Fig 6D). These observations show that one of the major contributions of GATA-1 to the erythroid differentiation process is to activate the expression of heme biosynthetic pathway enzymes. There also exists a possibility that the decrease of intracellular heme concentration may in turn cause the arrest of erythroid differentiation.
We also found that the GATA-1.05 mutation augmented the proliferative capacity to the progenitors that are still adherent to the OP9 feeder layer. The proliferative capacity (ie, CFU-OP9) has been examined by a replating assay (Fig 9) in which the lack of GATA-1 appears to induce the proliferation of progenitors. Consistent with this observation, forced expression of GATA-1 in NIH3T3 cells was reported to slow down cell-cycle progression.42If seen from a different standpoint, the proliferation of progenitors should decrease in parallel with the cell undergoing differentiation. The consequence of the lack of GATA-1 in the GATA-1.05/ES cell differentiation system seems to correlate well with these physiological phenomena (see also reference 43). Thus, the function of GATA-1 is suggested to redirect erythroid progenitors from proliferation to differentiation.
The expression of mRNAs encoding erythroid transcription factors were examined in the OP9/ES cell differentiation system. The results indicate that expression of mRNAs for GATA-1, SCL, EKLF, and p45 was induced during erythroid differentiation of wild-type ES cells and the highest expression levels of these mRNAs were observed in the floating fraction. In contrast, mRNAs for GATA-2 and c-myb showed their peak expression at the adherent stage and their expression level was decreased when cells floated from the feeder layer. We also found that the expression of EKLF mRNA heavily depends on the presence of GATA-1 in primitive hematopoiesis, whereas GATA-2 mRNA is strongly suppressed by GATA-1 in definitive hematopoiesis. These findings strongly argue for the notion that the expression of EKLF and GATA-2 genes are regulated by GATA-1. Consistent with these results, EKLF gene expression was shown to be regulated through a GATA sequence in the promoter in a transient transfection assay.44 A hypothesis that emerged from these results was that the erythroid transcription factors form a regulatory network, in which multiple factors interact with each other to form a protein complex on regulatory regions45 and also that the same factors crossregulate each other. Apparently these transcription factors seem to regulate the proliferation and differentiation of the erythroid lineage cells with various positive and negative feedback pathways and/or cascades. To further analyze these transcription factor regulatory networks, it is necessary to manipulate expression of the gene by targeted mutagenesis to examine the expression level of various transcription factors in the ES cell differentiation system characterized here.
ACKNOWLEDGMENT
We are grateful to Drs Shigeru Sassa for advice on porphyrin measurement, Hiroaki Kodama for advice on OP9 cells, and Jorg Bungard and Roger Patient for critical reading of the manuscript.
Supported in part by Grants-in-Aid from the Ministry of Education, Science, Sports and Culture, Japanese Society for Promotion of Sciences (JSPS) and CREST.
The publication costs of this article were defrayed in part by page charge payment. This article must therefore be hereby marked “advertisement” in accordance with 18 U.S.C. section 1734 solely to indicate this fact.
REFERENCES
Author notes
Address reprint requests to Masayuki Yamamoto, MD, PhD, Institute of Basic Medical Sciences, University of Tsukuba, 1-1-1 Tennoudai, Tsukuba 305-8575, Japan; e-mail: masiya@md.tsukuba.ac.jp.


This feature is available to Subscribers Only
Sign In or Create an Account Close Modal