Abstract
A spontaneously metastasizing, well-defined mouse lymphoma was chosen as an in vivo model to study the effect of tumor-host interaction on gene expression in liver sinusoidal endothelial cells. Forty-nine bovine aortic endothelial cell (BAEC) genes, recently isolated by a differential screening approach of a cDNA library enriched for tumor necrosis factor- (TNF-) suppressed genes, were investigated. Four of these genes were finally selected because they were affected differentially by host immuno-competence, TNF-, and tumor cells. Sequence analysis showed them to encode the bovine polyubiquitin (A4), elongation factor 1 (B2), the acidic ribosomal phosphoprotein PO (C3), and the ribosomal protein S2 (E10). Gene expression was analyzed by dot-blot or Northern blot analysis. TNF- and tumor cell conditioned supernatant suppressed the genes additive in BAEC but not in other endothelial cells except for bovine capillary endothelial cells. Ex vivo–isolated liver endothelial cells of tumor-bearing syngeneic DBA/2 mice showed strong downregulation of these four genes in comparison to normal control values. In contrast, endothelial cells of tumor-bearing immuno-incompetent Balb/c (nu/nu) mice showed no downregulation but upregulation of these genes. Consistently, all four genes were also downregulated when BAEC were incubated with supernatants derived from ex vivo–isolated liver metastases from immuno-competent but not from -incompetent mice. Thus, the expression of a group of genes involved in protein translation and processing was more profoundly altered in endothelial cells in vivo than in vitro, suggesting that microenviromental factors and cell-cell and cell-matrix interactions play an important role.
© 1998 by The American Society of Hematology.
VASCULAR ENDOTHELIAL CELLS exert a variety of functions which go far beyond the original hypothesis of an “inert barrier.”1-3 They can participate in immune reactions by affecting adherence and other functions of immuno-competent cells. Endothelial cell products such as platelet-derived growth factor induce T-cell synthesis of interleukin-2 (IL-2), while suppressing synthesis of IL-4, -6, and interferon-γ.4 Vascular endothelial cell growth factor (VEGF) enhances leukocyte functional antigen-1 and very late antigen-4–dependent natural killer (NK) cell adhesion to intercellular adhesion molecule-1 and vascular adhesion molecule-1 on vascular endothelial cells.5 Basic fibroblast growth factor in contrast inhibits NK cell adhesion through the regulation of these adhesion molecules on tumor vasculature.5 Hence, some angiogenic factors facilitate lymphocyte recognition of angiogenic vessels, while others protect vessels from cytotoxic lymphocytes.5 These findings suggest that the interaction of endothelial cells with other cells such as lymphocytes or tumor cells can not only be viewed under the aspect of gene induction, but also gene suppression. Gene suppression by mediators of the immune response has received only little attention.
Tumor necrosis factor-α (TNF-α), known to be angiogenic in vivo, is one of the cytokines most extensively studied in cultured endothelial cells. Many genes induced by TNF-α have been described, including vasoconstrictors, leukocyte adhesion molecules, procoagulant receptors, and others.6-15 We have recently used a differential screening approach to isolate cDNAs suppressed by TNF-α in cultured bovine aortic endothelial cells (BAEC).16 About 0.25% of all mRNA species present in cultured endothelial cells were found to be suppressed by TNF-α, indicating that gene suppression may be an important feature of cytokine-endothelial cell interaction.
Very few data are available with respect to the in vivo response of endothelial cells to a metastasizing tumor cell line and the role of the host immune status in regulating endothelial cell properties. For the present study a model of ex vivo–isolated liver sinusoidal endothelial cells was established. A previously well-defined mouse tumor was chosen which metastasizes spontaneously to the liver.17 Liver sinusoidal endothelial cells were isolated ex vivo from normal or tumor-bearing immuno-competent (DBA/2) or -incompetent [Balb/c (nu/nu)] mice. In preliminary experiments, 49 of the above-mentioned TNF-α suppressed genes were tested. Of these, four genes were chosen for further analysis because they were affected by tumor cells and host immune status. The expression of these four genes was strongly affected in vivo by microenvironmental factors like tumor-derived factors and by cell-cell interactions like tumor-host interactions. According to the analysis, the liver endothelial cell response (gene expression phenotype) of late-stage tumor-bearing nude mice differs strikingly from that of immuno-competent mice which survive about twice as long. In vitro, a less prominent change in gene expression of the selected genes was detected after incubation of BAEC with supernatants derived from ex vivo–isolated late-stage liver metastases of immuno-competent DBA/2 and immuno-incompetent Balb/c (nu/nu) mice. Downregulation of the four selected genes by TNF-α and conditioned ESbl-lacZ tumor cell supernatant was detected in vitro in BAEC. Gene expression after incubation with TNF-α and/or tumor cell supernatant was also investigated in other cultured endothelial cells. The sequences of the cDNAs which will be shown revealed that the genes are involved in protein translation and processing.
MATERIALS AND METHODS
Cell lines and in vitro assays.
BAEC and human umbilical vein endothelial cells (HUVEC; kindly provided by Dr P. Quehenberger) cultured as described previously.18,19 Bovine adrenal cortex endothelial cells (ACE) were isolated and characterized as described.20Experiments were performed with quiescent cells that had been confluent for 2 days.
The mouse endothelial cells TC10 were cultured as described.21 Mouse endothelioma cells (FN1) were kindly provided by Dr M. Clauss and cultured in Dulbecco’s modified Eagle’s medium (GIBCO-BRL, Eggenstein, Germany) supplemented with 10% fetal calf serum (FCS; Boehringer, Ingelheim, Germany), 1% nonessential amino acids (Bio Whittaker, Ingelheim, Germany), 1% sodium pyruvate (Bio Whittaker, Ingelheim, Germany), 0.4% mercaptoethanol, and 1% penicillin/streptomycin.
DBA/2 derived and with the β-galactosidase gene (lacZ) transduced ESbL lymphoma cells (clone L-CI.5s) (ESbL-lacZ) were cultured as described.17 After 24 hours of incubation, tumor cell supernatant (TS) was collected and incubated with the different endothelial cells for 8 hours. Supernatants derived from tumor and sinusoidal cells of metastatic livers at the late stage of tumor growth were incubated with BAEC for 8 hours.
Human recombinant TNF-α was added at a saturating dose of 1 nmol/L (1 × 10⁸ U/mg; Knoll AG, Ludwigshafen, Germany) for 8 hours.
Mice and tumor cell inoculation.
Euthymic DBA/2 mice and athymic nude mice [Balb/c (nu/nu)] were obtained from Iffa Credo (Lyon, France) and used at 6 to 12 weeks of age. ESbL-lacZ cells were washed in phosphate-buffered saline (PBS) (137 mmol/L NaCl, 2.7 mmol/L KCl, 1.5 mmol/L KH2PO4, 8.1 mmol/L Na2HPO4) and adjusted to the appropriate concentration. For standard injection, 104 cells were injected intradermally at the shaved flank of anesthesized (Rompun [0.1%]: Ketanest [0.25%]: PBS diluted 1:1:3 [volume]) animals.
Isolation of tumor and sinusoidal cells from metastatic livers.
Cell isolation was performed as described.22 Briefly, livers from anesthetized tumor-bearing mice were washed in situ by perfusion through the portal vein at 37°C with 10 mL α-modified Eagle’s medium (α-MEM) containing 15 mmol/L N-(2-hydroxyethyl)-piperazino-N’-2-ethanol sulfonic acid (HEPES) at a flow rate of 3 mL/min. Tissue digestion was performed during perfusion with 10 mL of α-MEM/HEPES containing 0.05% pronase E (Boehringer Mannheim, Mannheim, Germany) at 1 mL/min and then with 15 mL of the same medium containing 0.03% pronase E, 0.05% collagenase A (from Clostridium histolyticum; Boehringer Mannheim). After perfusion, livers were minced and stirred in 13 mL α-MEM/HEPES containing 0.04% pronase E, 0.04% collagenase A, and 0.0004% DNase (Sigma Chemical Co, St Louis, MO) at 37°C for 10 minutes. The cell suspension was then filtered through a nylon gauze and centrifuged at 300g for 10 minutes. To remove cell debris and erythrocytes, the cell pellet was centrifuged at 1,400g for 15 minutes in α-MEM/HEPES containing 17.5% (wt/vol) metrizamide (Sigma), followed by washing of the top layer with α-MEM/HEPES at 300g for 10 minutes.
In some experiments, tumor and sinusoidal cells were isolated from metastatic livers at a late stage of tumor growth and metastasis (ie, day 28 in immuno-competent DBA/2 mice and day 12 in immuno-incompetent Balb/c [nu/nu] mice) and cultured at 37°C for 1 and 5 days in complete RPMI. At these time points, supernatants were collected for the incubation with BAEC.
FDG-staining and flow cytometric analysis of tumor cells.
Quantitation of liver metastasis was performed at the single-cell level by staining with fluorescein β-galactosidase (FDG; Molecular Probes, Eugene, OR) as described.17 Isolated cells, 1 × 10⁶, were washed in PBS supplemented with 5% FCS and incubated in 100 μL 5% FCS at 37°C for 10 minutes. One hundred microliters of prewarmed FDG in H2O was added to the cell suspension, and the mix was briefly vortexed and then incubated for 1 to 4 minutes at 37°C (hypotonic shock). Ice-cold 5% FCS/PBS, 1.8 mL, was then added, and the cells were kept for 10 minutes on ice and then stained with 1.5 μmol/L propidium iodide. Flow cytometry was performed using a FACScan (Becton Dickinson, Heidelberg, Germany) with 30,000 cells/sample. Cells were simultaneously measured for forward angle light scatter (FSC) and integrated side scatter (SSC), as well as green (FL1) and red (FL3) fluorescences (expressed as logarithm of the integrated fluorescence light). Recordings were made only on propidium iodide–negative (viable) cells. Data were expressed as percentage of positive cells.
Isolation of liver endothelial cells.
After isolation of liver sinusoidal endothelial and tumor cells, they were cultured on type 1 collagen-coated plastic Petri dishes in α-MEM supplemented with 10% FCS at 37°C in a 5% CO2incubator. Two hours later supernatants were collected and adherent cells (sinusoidal endothelial cells) were scraped off with a rubber spatula, counted, pelleted, snap frozen in liquid nitrogen, and kept at −70°C for RNA studies. The same procedure was used for isolation of endothelial cells from normal (non–tumor-bearing) mice. Purity of endothelial cell populations was evaluated by phase contrast microscopy, mannose-receptor expression, and measurement of the mitochondrial activity, as described.23 24
RNA preparation.
Cultured BAEC were washed three times with 0.9% sodium chloride (NaCl) solution at 4°C before the guanidine isocyanate solution was added. Subsequently total RNA was extracted using a procedure of guanidinium isocyanate lysis followed by ultracentrifugation through cesium chloride, as described.25
Pellets of ex vivo–isolated liver sinusoidal endothelial cells were homogenized with 0.2 mL RNA-Clean TM (Angewandte Gentechnologie Systeme GmbH, Heidelberg, Germany) per 2 × 10⁶ cells. Total RNA extraction was performed by the chloroform/phenol technique. The RNA was precipitated with isopropanol, the pellet washed in ethanol, dried under vacuum, and resuspended in diethyl pyrocarbonate–treated water. The quantity of RNA was measured by absorbance at 260 nm. Poly (A) + RNA was isolated using an mRNA purification kit (Qiagen GmbH, Hilden, Germany).
Dot-blot analysis.
The filters for dot hybridization were prepared essentially as described by Kafatos et al.26 Plasmid pBluescript SK containing cDNA inserts of 49 independent BAEC genes, suppressed after incubation with 1 nmol/L TNF-α for 6 hours in BAEC, and several control genes6,10,27 28 were used to prepare the filters. The cDNA for the housekeeping gene glyceraldehyde-3-phosphate dehydrogenase (GADPH; American Type Culture Collection [ATCC], Rockville, MD) was used to standardize the hybridized cDNAs. The vector pBluescript SK served as a control for background signals. One microgram of linearized plasmid was denatured in 0.4 mol/L NaOH at room temperature for 30 minutes and chilled on ice. The solution was then brought to 10× SSC (1.5 mol/L sodium chloride, 0.15 mol/L sodium citrate, pH 7.0) (4°C) and blotted on Hybond N membranes (Amersham Buchler, Braunschweig, Germany), using a 96-well manifold apparatus (Bio-Rad Laboratories GmbH, München, Germany).
Poly(A) + RNA was used to synthesize radioactive-labeled cDNA probes using Moloney-murine leukemia virus reverse transcriptase (GIBCO-BRL) and [α-32P]dCTP (Redivue; Amersham Buchler, Braunschweig, Germany). Prehybridization was performed in 5× SSPE (1× SSPE contains: 180 mmol/L NaCl, 10 mmol/L Na3PO4, 1 mmol/L EDTA, pH 7.7), 0.5% sodium dodecyl sulfate (SDS), 5× Denhardt’s solution,250.02 mg/mL salmon sperm DNA (Sigma-Aldrich, Deisenhofen, Germany), and 50% formamide at 42°C for 2 hours. The filters were hybridized at 42°C for 24 hours with 1 × 10⁶ cpm/mL for experiments with ex vivo–isolated liver sinusoidal endothelial cells. Washing was performed once in 1× SSC (150 mmol/L NaCl, 15 mmol/L sodium citrate)/0.1% SDS at room temperature for 15 minutes, in 0.1× SSC/0.5% SDS at 65°C for 20 minutes, and the filters were subsequently exposed to AGFA Curix 1.000G x-ray films (Sigma, München, Germany) with an intensifying screen at −80°C for 1 to 4 days.
Northern blot analysis.
Total RNA per lane, 12.5 μg, was separated on 1.1% agarose gels containing 6.4% formaldehyde. The integrity of RNA was checked by ethidium bromide staining of the 18S and 28S ribosomal RNA. After electrophoresis, RNA was transferred overnight by capillary blotting in 20× SSC to Hybond N nylon membrane (Amersham Buchler). Hybridization (using 3 to 4 × 10⁶ cpm labeled probe per mL hybridization solution) and washing were performed as described for dot-blot analysis. Selected cDNAs were labeled with the random primer labeling system (Promega, Heidelberg, Germany). The filters were stripped and rehybridized against human GAPDH to standardize the amount of RNA loaded.
Densitometric quantitation.
Gene expression levels were quantified by densitometry of autoradiograms using the Adobe Photoshop Program and the SCAN analysis program from Macintosh (München, Germany). Each relative expression value represents the ratio between the densities of specific mRNA transcripts to GAPDH transcripts. Measurable background signals were not detected for the vector pBluescript SK for dot blots. Therefore, the background signals were not included in the calculation.
Sequencing.
The four selected genes were used for dideoxy sequencing with the Sequenase Version 2.0 Kit (Amersham Buchler) and [α-35S]dATP (Redivue; Amersham Buchler). The clones were partially sequenced from both ends, using −40 and reverse primers for the pBluescript SK vector (Stratagene, Heidelberg, Germany). At least 200 bp from both ends were used to search for similarities to previously published genes with BLASTN of the HUSAR sequence analysis program package (Version 4.0; Genetics Computer Group, Inc, Heidelberg, Germany). Full-length cDNA sequences were obtained for three unpublished bovine sequences. Automatic sequencing was performed commercially by MWG-Biotech (Ebersberg, Germany). The bovine full-length sequences were analyzed with the HUSAR sequence analysis program package (Version 4.0). The applications BLASTN, MAP, and FASTA29 were used.
Statistical analysis.
The relative densitometry units resulting from autoradiograms of Northern blots or dot blots were statistically analyzed using the paired t-test (see Figs 3 and 4) and the Wilcoxon rank sum test (see Figs 2, 5, and 6). For the statistical analysis untreated controls of one experiment representing the relative densitometry units of the selected four genes were considered to be one group and were compared with the corresponding treated group. A probability P < .05 was considered statistically significant.
RESULTS
Effect of tumor growth on expression of multiple genes in liver sinusoidal endothelial cells.
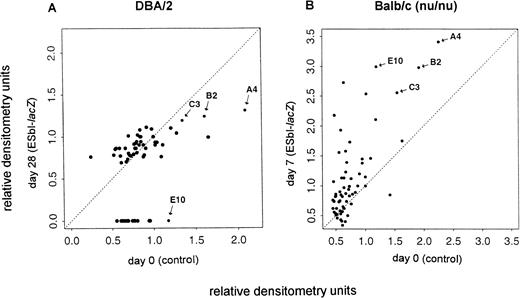
Forty-nine genes isolated from a subtractive cDNA library of BAEC,16 representing genes suppressed by TNF-α, were used to identify their potential relevance in vivo upon tumor growth and liver metastasis. Gene expression was tested in four independent experiments of carefully ex vivo–isolated endothelial cells. The relative densitometry units of the 49 genes and of several control genes6,10,27 28 expressed in endothelial cells of tumor-bearing mice (y-axis) were compared with those of normal control mice (x-axis). Representative data of the mRNA expression levels (relative densitometry units) are shown for immuno-competent DBA/2 mice in Fig 1A and for immuno-incompetent Balb/c (nu/nu) mice in Fig 1B. Dots around the diagonal represent genes without expression changes. In late-stage metastases of immuno-competent DBA/2 mice (A) a number of genes were downregulated (below the diagonal), whereas in respective immuno-incompetent nude mice (B) expression levels of several genes were upregulated (above the diagonal). Four genes that were reproducibly affected by tumor growth and host immuno-competence in repeated experiments were selected and they are labeled as A4, B2, C3, and E10 in Fig 1. Many other genes (those along the diagonal line) were not significantly affected by tumor growth in vivo, indicating selectivity as to the kinds of genes affected.
Analysis of the effect of tumor growth on the expression of multiple genes in liver sinusoidal endothelial cells in vivo. Gene expression was analyzed by dot-blot mRNA analysis in cells from tumor-bearing immuno-competent DBA/2 (A) and from immuno-incompetent Balb/c (nu/nu) (B) mice. The relative densitometry units were calculated from the autoradiograms such as shown in Figs 3 and 4. They represent the ratio between the density of the specific mRNA transcript to the GAPDH transcript as described in Materials and Methods. The expression levels at day 0 (control, x-axis) were plotted versus those obtained at the indicated days after tumor inoculation (ESbl-lacZ, y-axis). Dots around the diagonal represent genes without expression changes, whereas dots below (suppression) or above (induction) the diagonal represent genes with altered expression within the experiments. Representative data from two in vivo experiments for immuno-competent DBA/2 and immuno-incompetent Balb/c (nu/nu) mice are shown. For further analysis selected genes are labeled (A4, B2, C3, and E10).
Analysis of the effect of tumor growth on the expression of multiple genes in liver sinusoidal endothelial cells in vivo. Gene expression was analyzed by dot-blot mRNA analysis in cells from tumor-bearing immuno-competent DBA/2 (A) and from immuno-incompetent Balb/c (nu/nu) (B) mice. The relative densitometry units were calculated from the autoradiograms such as shown in Figs 3 and 4. They represent the ratio between the density of the specific mRNA transcript to the GAPDH transcript as described in Materials and Methods. The expression levels at day 0 (control, x-axis) were plotted versus those obtained at the indicated days after tumor inoculation (ESbl-lacZ, y-axis). Dots around the diagonal represent genes without expression changes, whereas dots below (suppression) or above (induction) the diagonal represent genes with altered expression within the experiments. Representative data from two in vivo experiments for immuno-competent DBA/2 and immuno-incompetent Balb/c (nu/nu) mice are shown. For further analysis selected genes are labeled (A4, B2, C3, and E10).
TNF-α and tumor cell supernatant exert a suppressive effect in vitro on gene expression by BAEC.
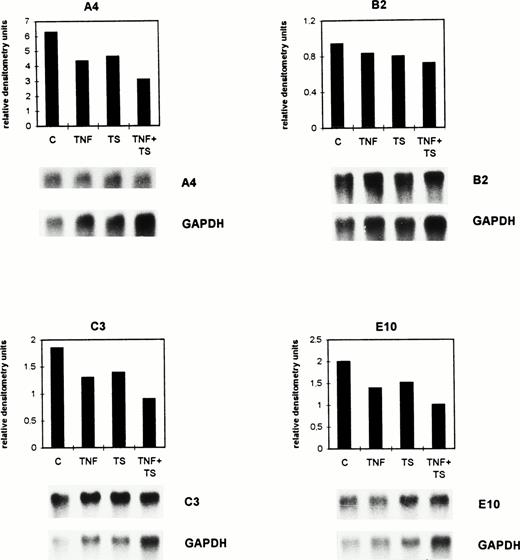
Confluent bovine aortic endothelial cell monolayers were incubated for 8 hours with either 1 nmol/L TNF-α (TNF, a saturating dose as shown in previous experiments) or tumor cell supernatant (TS) of the well-characterized highly metastatic ESbL-lacZ lymphoma cells17 or with both factors together (TS + TNF). Expression of the genes A4, B2, C3, and E10 was investigated by Northern blot analysis.
The size of the detected mRNAs in cultured BAEC was determined based on 18S and 28S ribosomal RNA. The molecular weights of the bands recognized by the cDNA probe A4 are 4.2 kb (minor transcript) and 1.2 kb (major transcript). The weakly detectable 4.2-kb mRNA of the clone A4 is not shown in Fig 2. The mRNAs recognized by the other cDNAs have a size of 1.8 kb for B2, 1.05 kb for C3, and 0.9 kb for E10.
TNF- and tumor cell supernatant exert suppressive effects in vitro on the expression of selected genes by BAEC. Confluent BAEC were cultured for 8 hours either without (C) or with 1 nmol/L TNF- (TNF) and/or with lymphoma cell conditioned supernatant (TS). The mRNA expression was detected by Northern blot analysis for the genes A4, B2, C3, and E10. The autoradiograms depicted below the histograms were quantitated by densitometry as described in the legend to Fig 1 and in Materials and Methods. Histograms for the calculated relative densitometry units (y-axis) for the single genes are shown. The bar graphs represent different treatments. The differences seen between C and the TNF + TS group were significant (P = .015, Wilcoxon rank sum test).
TNF- and tumor cell supernatant exert suppressive effects in vitro on the expression of selected genes by BAEC. Confluent BAEC were cultured for 8 hours either without (C) or with 1 nmol/L TNF- (TNF) and/or with lymphoma cell conditioned supernatant (TS). The mRNA expression was detected by Northern blot analysis for the genes A4, B2, C3, and E10. The autoradiograms depicted below the histograms were quantitated by densitometry as described in the legend to Fig 1 and in Materials and Methods. Histograms for the calculated relative densitometry units (y-axis) for the single genes are shown. The bar graphs represent different treatments. The differences seen between C and the TNF + TS group were significant (P = .015, Wilcoxon rank sum test).
As shown in the histograms of Fig 2, gene A4 was downregulated from 6.29 (C) to 4.35 (TNF), 4.65 (TS), and 3.1 (TNF + TS) relative densitometry units. Gene B2 was downregulated from 0.94 (C) to 0.83 (TNF), 0.8 (TS), and 0.72 (TNF + TS) relative densitometry units. The calculated relative densitometry units for C3 are 1.85 (C), 1.3 (TNF), 1.39 (TS), and 0.9 (TNF + TS). Gene E10 was downregulated from 2 (C) to 1.39 (TNF), 1.52 (TS), and 1.01 (TNF + TS) relative densitometry units. The mRNAs of the four selected genes were similarly suppressed by TNF and TS. A stronger suppression was detected for TNF and TS together.
The mean of the densitometry units of the four selected genes was 2.77 (C), 1.97 (TS), 2.09 (TNF), and 1.43 (TS + TNF). The differences in the TNF- and TS-treated groups in comparison with the controls only indicated trends (P = .14 for TNF and P = .23 for TS), while those between the C and the TNF + TS group were significant (P = .015) when using the Wilcoxon rank sum test. The same results were obtained when performing dot-blot analysis. Thus, dot-blot analysis had a similar sensitivity as Northern blots and could therefore be used in further experiments with ex vivo–isolated endothelial cells when amounts of isolated RNA were small.
The results represented in Fig 2 show that metastatic tumor cells secrete factors modulating gene expression in BAEC. The finding that TS when given together with a saturating dose of TNF-α had a stronger suppressive effect on the expression of the four genes suggests that TS and TNF are not identical and that there is more than one factor that can negatively affect gene expression. Addition of VEGF and TNF-α did not have an effect like TS (data not shown), suggesting that it is not VEGF in TS causing the observed effect.
Endothelial cells ex vivo from livers of tumor-bearing syngeneic DBA/2 mice show downregulation of gene expression.
To investigate the functional significance of the observed suppression of gene expression in BAEC after treatment with TNF-α and/or with lymphoma cell conditioned supernatant, we checked the expression of the same genes in liver sinusoidal endothelial cells isolated directly ex vivo from either normal mice (control) or from mice 28 days after intradermal injection of ESbL-lacZ lymphoma cells. At day 28 the mice carry large primary tumors and have macroscopic liver metastases.17 The isolated endothelial cells had a purity of 95% and contained less than 5% of other sinusoidal cells.23 24
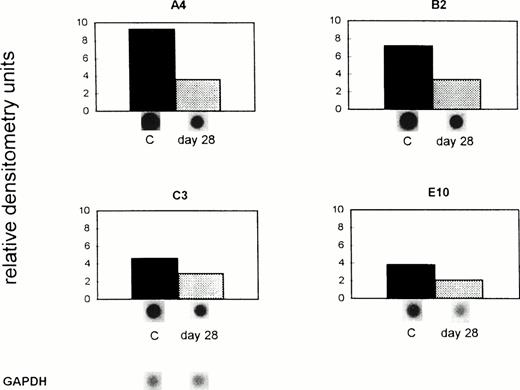
As shown in Fig 3 by dot-blot analysis, the mRNA expression of A4, B2, C3, and E10 was reduced in liver sinusoidal endothelial cells from tumor-bearing animals in comparison with the control group. The mRNA expression of these genes in control (untreated) mice remained unchanged during the 28 days of the experiment (data not shown). Gene A4 was downregulated from 9.3 (C) to 3.6 (day 28) relative densitometry units, gene B2 from 7.2 (C) to 3.4 (day 28) units, gene C3 from 4.6 (C) to 2.9 (day 28), and C3 from 3.8 (C) to 2.1 (day 28) units. The difference in the expression of all four genes, shown as relative densitometry units in Fig 3, between the mean of the controls (6.23) and the mean of tumor-bearing hosts (3.0) was significant at P = .044 (paired t-test). Thus, there was, in immuno-competent mice, a prominent suppressive effect in vivo on the four endothelial genes during massive invasion of the liver with metastatic syngeneic lymphoma cells.
Downregulation of gene expression in ex vivo–isolated liver endothelial cells from tumor-bearing immuno-competent mice. ESbL-lacZ lymphoma cells were injected intradermally into syngeneic DBA/2 mice. Twenty-eight days later, endothelial cells were isolated using liver perfusion and differential adhesion to collagen pretreated Petri dishes. Then mRNA was extracted from control (C) and tumor-bearing mice (day 28), and dot-blot analysis performed and evaluated as described in the legend to Fig 1 and in Materials and Methods. The pBluescript SK DNA which was used as vector gave no densitometric signal. The difference in the expression of all four genes between C and the day 28 tumor-bearing immuno-competent host was significant (P = .044, paired t-test).
Downregulation of gene expression in ex vivo–isolated liver endothelial cells from tumor-bearing immuno-competent mice. ESbL-lacZ lymphoma cells were injected intradermally into syngeneic DBA/2 mice. Twenty-eight days later, endothelial cells were isolated using liver perfusion and differential adhesion to collagen pretreated Petri dishes. Then mRNA was extracted from control (C) and tumor-bearing mice (day 28), and dot-blot analysis performed and evaluated as described in the legend to Fig 1 and in Materials and Methods. The pBluescript SK DNA which was used as vector gave no densitometric signal. The difference in the expression of all four genes between C and the day 28 tumor-bearing immuno-competent host was significant (P = .044, paired t-test).
Endothelial cells ex vivo isolated from livers of tumor-bearing Balb/c (nu/nu) mice show upregulation of gene expression.
To investigate to what extent the reduced gene expression observed in sinusoidal endothelial cells from metastatic livers of syngeneic DBA/2 mice was a direct effect from the tumor as shown in vitro (Fig 2) or was dependent on host immuno-competence, we performed an analogous experiment in nude mice lacking mature T lymphocytes. Gene expression in liver sinusoidal endothelial cells was tested again in cells ex vivo isolated from the final phase of tumor growth and metastasis (day 7 after tumor cell inoculation). It was previously shown that in this final phase the load of liver metastases is comparable to that of DBA/2 immuno-competent mice at day 28 after tumor cell inoculation.17
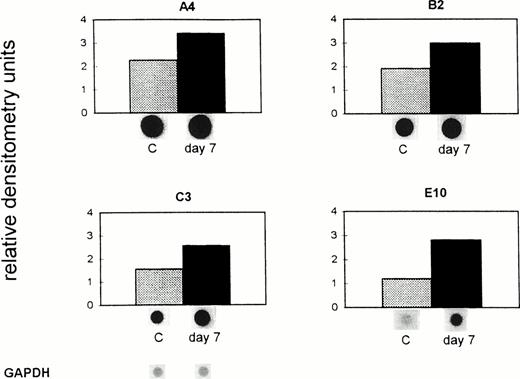
Data presented in Fig 4 show an increased mRNA expression of the four analyzed genes in tumor-bearing nude compared with the control mice. The mRNA expression of these genes in control (untreated) mice remained unchanged during the 7 days of the experiment (data not shown). Gene A4 was upregulated from 2.3 (C) to 3.4 (day 7) relative densitometry units, the gene B2 from 1.9 (C) to 3.0 (day 7) units, C3 from 1.6 (C) to 2.6 (day 7), and E10 from 1.2 (C) to 3.0 (day 7) units. The difference in the expression of all four genes, shown as relative densitometry units in Fig 4, between the mean of the controls (1.73) and the mean of the tumor-bearing hosts (2.94) was significant (P = .003, pairedt-test). A similar upregulation of the expression of these genes was found in endothelial cells isolated from nude mice at day 12 after tumor inoculation. Thus, expression of the investigated genes in ex vivo–isolated liver sinusoidal endothelial cells from tumor-bearing nude mice was significantly higher than in non–tumor-bearing mice. This suggests an inductive effect in vivo during massive invasion of the liver with metastatic lymphoma cells in the absence of mature T lymphocytes.
Upregulation of gene expression in ex vivo–isolated liver endothelial cells from tumor-bearing immuno-incompetent mice. ESbL-lacZ lymphoma cells were injected intradermally into BALB/c (nu/nu) mice. Seven days later, endothelial cells were isolated from control (C) and tumor-bearing mice (day 7) and analyzed as described in the legend to Fig 3 and in Materials and Methods. The pBluescript SK DNA (vector), which was used as a control, gave no nonspecific background signals. The difference in the expression of all four genes between C and the day 7 tumor-bearing immuno-incompetent host was significant (P = .003, paired t-test).
Upregulation of gene expression in ex vivo–isolated liver endothelial cells from tumor-bearing immuno-incompetent mice. ESbL-lacZ lymphoma cells were injected intradermally into BALB/c (nu/nu) mice. Seven days later, endothelial cells were isolated from control (C) and tumor-bearing mice (day 7) and analyzed as described in the legend to Fig 3 and in Materials and Methods. The pBluescript SK DNA (vector), which was used as a control, gave no nonspecific background signals. The difference in the expression of all four genes between C and the day 7 tumor-bearing immuno-incompetent host was significant (P = .003, paired t-test).
Supernatants of tumor and sinusoidal cells from late-stage metastatic livers alter gene expression in BAEC.
To determine whether the microenvironment of the tumor (sinusoidal cells) or the tumor cells were responsible for the upregulation or downregulation of the above genes, sinusoidal and tumor cells from metastatic livers were reisolated at day 28 from DBA/2 and at day 12 from Balb/c (nu/nu) mice after tumor injection. FDG staining and FACS analysis showed that the number of tumor cells 24 hours after isolation was 73% in DBA/2 mice and 76% in Balb/c (nu/nu) mice. Five days later in culture, 97.7% and 98%, respectively, of the cells were tumor cells. Supernatants derived from the reisolated cells were incubated for 8 hours with BAEC (Fig 5). Afterwards, total RNA was isolated, and Northern blots were performed and analyzed by densitometry. As shown in Fig 5, the mRNA expression of A4, B2, C3, and E10 was reduced in comparison to the control group in BAEC when incubated with supernatants derived from ex vivo–isolated liver metastasis from immuno-competent DBA/2 mice. Gene A4 was downregulated from 1.49 to 1.13 and 1.3 (day 1 and 5, respectively) relative densitometry units, gene B2 from 0.57 to 0.4 and 0.44, gene C3 from 0.33 to 0.19 and 0.20, and gene E10 from 0.26 to 0.17 and 0.15. The mean of the relative densitometry units of all four genes for control (C) was 0.66, for treatment with DBA/2-derived supernatants from day 1 (S1) 0.47 and from day 5 (S5) 0.52. Differences were statistically significant (P < .001, Wilcoxon rank sum test). In contrast, when BAEC were incubated with supernatants derived from ex vivo–isolated metastases from immuno-incompetent nude mice, there was only a slight downregulation of the expression of these genes. These results suggest that the microenvironment of the tumor (sinusoidal cells) is responsible for the alteration of gene expression in BAEC and that within the sinusoidal cell population, T cells seem to be important, because supernatants derived from isolated cells from nude mice were inactive.
Supernatants of tumor and sinusoidal cells isolated from metastatic livers of immuno-competent DBA/2 and immuno-incompetent Balb/c (nu/nu) mice at a late stage of tumor growth alter gene expression in BAEC. Supernatants of the re-isolated and cultured cells were collected at day 1 (S1) and day 5 (S5). BAEC were incubated with the supernatants for 8 hours and total RNA was extracted. BAEC incubated in the culture medium of the tumor cells served as control (C). The mRNA expression of the genes A4, B2, C3, and E10 was analyzed by Northern blot hybridization as described in the legend to Fig 2. The bar graphs represent different treatments, with the corresponding autoradiograms of the hybridization signals depicted below the histograms. The differences in the expression of all four genes between C and the DBA/2-derived supernatants were significant (P< .001, Wilcoxon rank sum test).
Supernatants of tumor and sinusoidal cells isolated from metastatic livers of immuno-competent DBA/2 and immuno-incompetent Balb/c (nu/nu) mice at a late stage of tumor growth alter gene expression in BAEC. Supernatants of the re-isolated and cultured cells were collected at day 1 (S1) and day 5 (S5). BAEC were incubated with the supernatants for 8 hours and total RNA was extracted. BAEC incubated in the culture medium of the tumor cells served as control (C). The mRNA expression of the genes A4, B2, C3, and E10 was analyzed by Northern blot hybridization as described in the legend to Fig 2. The bar graphs represent different treatments, with the corresponding autoradiograms of the hybridization signals depicted below the histograms. The differences in the expression of all four genes between C and the DBA/2-derived supernatants were significant (P< .001, Wilcoxon rank sum test).
Gene expression response to TNF-α and TS in endothelial cells of other vessel origin and species.
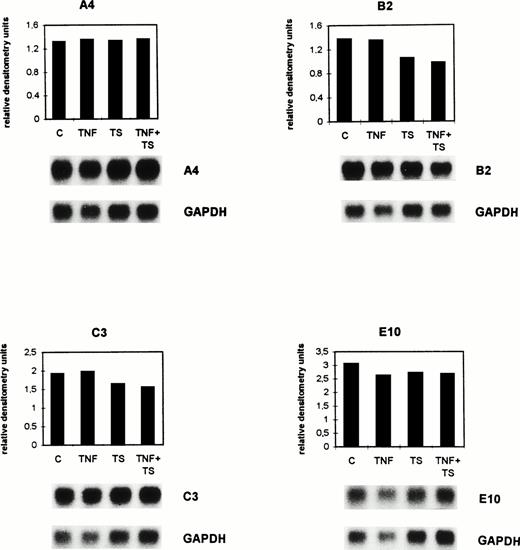
We also investigated endothelial cells of other vessel origin and species with regard to expression of the four genes after incubation with TNF and/or tumor cell supernatant (TS). No significant changes were observed when fetal human endothelial cells (HUVEC), mouse endothelial cells (TC10), and murine endothelioma cells (FN1) were incubated for 8 hours with TNF and/or TS. Figure 6 shows the results obtained from Northern blot analysis of bovine capillary endothelial cells (ACE). Although the expression level of A4 was not affected, B2 was downregulated from 1.37 (C) to 1.06 (TS) and 0.98 (TNF + TS) relative densitometry units, and C3 from 1.94 (C) to 1.64 (TS) and 1.56 (TNF + TS) relative densitometry units. Gene expression was not affected by TNF-α alone. E10 was only slightly downregulated. The mean of the densitometry units of the three genes B2, C3, and E10 was 2.11 (C), 1.8 (TS), and 1.74 (TNF + TS). The difference between C and the TNF + TS group was significant (P = .027, Wilcoxon rank sum test). Nevertheless, the effects seen are minor.
Gene expression of A4, B2, C3, and E10 in cultured bovine capillary endothelial cells after TNF- and tumor cell supernatant is different from BAEC. Confluent ACE were cultured for 8 hours either without (C) or with 1 nmol/L TNF- (TNF) and/or with lymphoma cell conditioned supernatant (TS). The mRNA expression was analyzed by Northern blots described in the legend to Fig 2 and in Materials and Methods. The differences in the expression of B2, C3, and E10 between C and the TNF + TS group were significant (P = .027, Wilcoxon rank sum test).
Gene expression of A4, B2, C3, and E10 in cultured bovine capillary endothelial cells after TNF- and tumor cell supernatant is different from BAEC. Confluent ACE were cultured for 8 hours either without (C) or with 1 nmol/L TNF- (TNF) and/or with lymphoma cell conditioned supernatant (TS). The mRNA expression was analyzed by Northern blots described in the legend to Fig 2 and in Materials and Methods. The differences in the expression of B2, C3, and E10 between C and the TNF + TS group were significant (P = .027, Wilcoxon rank sum test).
Sequence analysis of the four studied bovine genes.
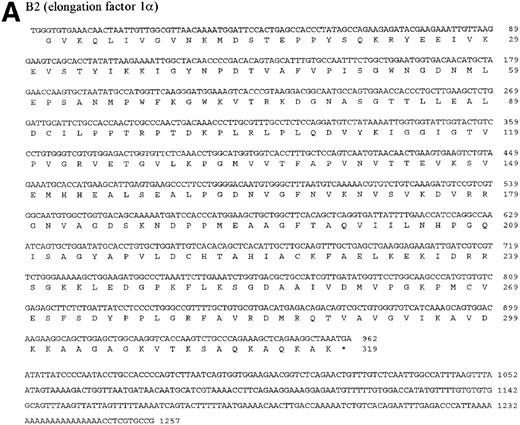
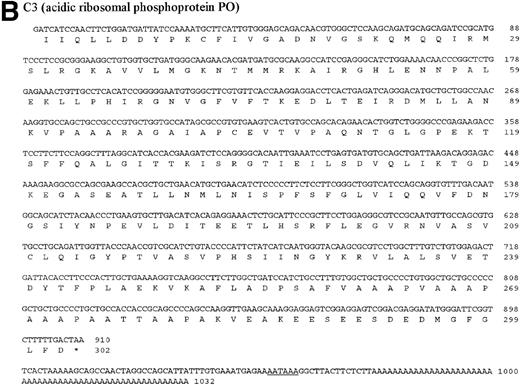
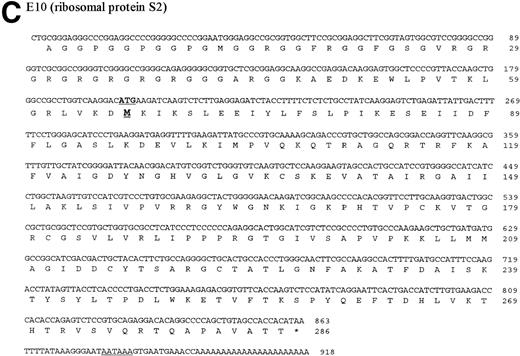
The four genes investigated in detail show differential regulation during the process of metastasis in liver sinusoidal endothelial cells in immuno-competent and immuno-incompetent animals. With regard to the direction of regulation (upregulation or downregulation), the four genes behaved similarly, suggesting common regulatory response elements. The four investigated genes were then sequenced. The DNA and protein sequences of the genes B2, C3, and E10 are new and are presented in Fig 7A through C. The gene A4 was identified as an already published sequence of the bovine polyubiquitin (accession number BTPOLYUB) and, therefore, is not shown. The sequence analysis with the HUSAR program package showed that B2 codes for the bovine elongation factor 1α, C3 for the bovine acidic ribosomal phosphoprotein PO, and E10 for the bovine ribosomal protein S2 (LLRep3 protein). The bovine elongation factor 1α (B2) cDNA shares 91% homology with the human DNA sequence and 100% homology with the protein sequence.30 The predicted bovine protein sequence lacks 149 amino acids at the amino terminus in comparison with the human protein sequence. The acidic ribosomal phosphoprotein P0 (C3) shows 93% identity with the human cDNA sequence, 98.3% identity at the protein level,31 and the predicted bovine protein lacks 16 amino acids at the amino terminus in comparison with the human protein sequence. The ribosomal protein S2 (E10) shows 88% homology with the rat cDNA sequence and 98.3% homology with the rat protein sequence,32 and the bovine protein sequence lacks 7 amino acids at the amino terminus. The DNA and protein sequence of the human LLRep3 gene,33 another member of this gene family, which codes for the ribosomal protein S2,32 is completely included within the identified bovine sequence of E10.
DNA and protein sequence of the cDNAs B2, C3, and E10. The clones B2, C3, and E10 were commercially sequenced and compared to published sequences using the application BLASTN of the HUSAR program package (Version 4.0). The bovine cDNAs represent partial sequences of the elongation factor 1 (B2, A), the acidic ribosomal phosphoprotein PO (C3, B) and the ribosomal protein S2 (E10, C). Within the sequence of the ribosomal protein S2 the sequence of LLRep3 is included. The start codon (ATG) and the first Methionin (M) of the LLRep3 sequence are underlined and enlarged. The cDNA sequences were submitted to GenBank and the accession numbers are AF013213 (B2), AF013214 (C3),AF013215 (E10). The open reading frames of the cDNA sequences were translated into the deduced amino acid sequences and placed under the corresponding DNA sequence. The numbering starts with the first nucleotide or amino acid. The potential polyadenylation signal sequences are underlined.
DNA and protein sequence of the cDNAs B2, C3, and E10. The clones B2, C3, and E10 were commercially sequenced and compared to published sequences using the application BLASTN of the HUSAR program package (Version 4.0). The bovine cDNAs represent partial sequences of the elongation factor 1 (B2, A), the acidic ribosomal phosphoprotein PO (C3, B) and the ribosomal protein S2 (E10, C). Within the sequence of the ribosomal protein S2 the sequence of LLRep3 is included. The start codon (ATG) and the first Methionin (M) of the LLRep3 sequence are underlined and enlarged. The cDNA sequences were submitted to GenBank and the accession numbers are AF013213 (B2), AF013214 (C3),AF013215 (E10). The open reading frames of the cDNA sequences were translated into the deduced amino acid sequences and placed under the corresponding DNA sequence. The numbering starts with the first nucleotide or amino acid. The potential polyadenylation signal sequences are underlined.
DISCUSSION
In cultured BAEC we previously identified 49 genes that were suppressed by TNF-α.16 To test the possible relevance of these genes in vivo in pathological or physiological situations, we decided to investigate the influence of a tumor and its metastases on the gene expression of liver sinusoidal endothelium. For this purpose we established a technique of direct ex vivo isolation of liver sinusoidal endothelial cells of high purity from normal and tumor-bearing mice. After in situ enzyme perfusion, dissociation and selective in vitro adhesion to collagen-coated Petri dishes, maximally 1 to 2 × 10⁶ endothelial cells could be isolated per organ allowing only semiquantitative dot-blot hybridization. The isolated endothelial cells had a purity over 95% according to the parameters described in Materials and Methods. From cell-culture experiments, which allow us to isolate relatively large amounts of RNA, we performed Northern blot and dot-blot analysis and obtained comparable results. For experiments with ex vivo–isolated cells with limiting amounts of RNA, the methodology had to be restricted to dot blot. The recently developed ex vivo cell isolation technology allowed us to study the endothelial response of the liver as an important target organ of metastases.
Of the previously isolated 49 TNF-α suppressed genes, four genes (A4, B2, C3, and E10) were selected because of their altered expression in livers of tumor-bearing immuno-competent and immuno-incompetent hosts in comparison to normal mice (Fig 1). In cultured BAEC the four genes were not only suppressed by saturating amounts of TNF-α but also by tumor-cell–conditioned supernatant (Fig 2). Both factors together had a stronger suppressive effect, indicating that in tumor supernatant factors other than TNF-α exist, which can affect endothelial gene expression in vitro. Thus, tumor cell products as well as mediators of the host immune response such as TNF-α were found to affect the expression of the four genes studied in BAEC. Expression of these genes was also investigated in other cultured endothelial cells. The genes B2 and C3, but not A4, were also downregulated by tumor cell supernatant in bovine capillary endothelial cells (ACE) (Fig 6). Expression of A4, B2, C3, and E10 was not affected by TNF-α and/or tumor cell supernatant in human HUVEC cells or murine TC10 and FN1 endothelial cells. The results obtained in endothelial cells of different vessel origin or from different species thus indicate that the observed downregulation in BAEC is not a general phenomenon in all endothelial type cells.
In vivo in mice we found an even more prominent suppression of these four genes (Fig 3) than in cultured BAEC (Fig 2). However, this observation required an immuno-competent host. In immuno-incompetent Balb/c (nu/nu) mice, expression of these genes was upregulated in liver endothelial cells of tumor-bearing compared with non–tumor-bearing animals (Fig 4). The results corroborate our previous observations: (1) that the pattern and load of spontaneous liver metastasis depends on the host immune status,17 (2) that liver endothelial cells participate in T-cell–dependent host resistance to lymphoma metastasis by production of nitric oxide in vivo,23 and (3) that dynamic expression changes in vivo of adhesion and costimulatory molecules determine load and pattern of lymphoma liver metastasis.22 Thus, gene expression of liver endothelial cells in tumor-bearing animals with liver metastasis is under control of tumor cells and tumor-mediated immune reactions.
Incubation of cultured BAEC with supernatants derived from reisolated and cultured sinusoidal and tumor cells from DBA/2 late-stage metastatic livers resulted in partial suppression of the four genes A4, B2, C3, and E10 (Fig 5). The strongest downregulation was observed using supernatant conditioned by 73% tumor cells and 27% sinusoidal cells from immuno-competent mice. Gene expression was not significantly altered using supernatants from immuno-incompetent mice. Therefore, the tumor and its microenvironment, in particular T cells, seem to be responsible for the observed downregulation of the four genes in murine liver endothelial cells (Fig 3) and in cultured BAEC (Fig 5).
Alteration in the expression of the genes A4, B2, C3, and E10 was more prominent in vivo, shown in ex vivo–isolated liver endothelial cells (Figs 3 and 4), than in cultured BAEC and other endothelial cells using TNF-α and different conditioned supernatants (Figs 2, 5, and 6). Therefore, not only the secreted mediators of the tumor and its microenvironment seem to be responsible for the changes in gene expression; other conditions of the in vivo situations such as cell-cell contacts and cell contacts with the extracellular matrix may also be important for expression changes of the four investigated genes.
There is not much known about the molecular regulation of gene expression of the four described genes. Within the murine elongation factor 1α promotor three p53-responsive elements were found,34 whereas five Sp1 sites and one Ap-1 site were found within the first intron of the human gene.35 Further studies are required to understand the molecular mechanism of downregulation of the genes.
Sequence analysis of the four genes revealed their identity (Fig 7). They encode bovine polyubiquitin (A4), elongation factor 1α (B2), acidic ribosomal phosphoprotein P0 (C3), and ribosomal protein S2 (E10). Database analysis showed the bovine genes to be newly cloned homologues to previously isolated human or rat genes. The homology to the human DNA sequence is 91% for the elongation factor 1α (B2) and 93% for acidic ribosomal phosphoprotein P0 (C3). The ribosomal protein S2 (E10) shows 88% homology with the rat cDNA sequence. The cloned bovine polyubiquitin sequence (A4, only partially sequenced) is identical with an already published bovine sequence.
Interestingly, all four genes are involved in protein translation and processing. Polyubiquitin (A4) is an important ubiquitous molecule involved in a variety of cellular processes including cell cycle, stress response, protein folding and translocation, protein tagging for nonlysosomal degradation, DNA repair, transcription, and apoptosis.36-39 Elongation factor 1α (B2) is a guanosine triphosphate (GTP)-binding protein that catalyzes the binding of aminoacyl-transfer RNAs to the ribosome in the protein synthesis process40 and was also identified as microtubule-severing protein.34 Multiple phosphorylated forms of the acidic ribosomal phosphoprotein PO (C3) were found to be located within the large subunit (60S) of eukaryotic ribosomes. They form a pentameric complex with the ribosomal proteins P1 and P2 in the ribosome, which interacts with the elongation factors 1α and 2.41 The ribosomal protein S2 (E10) belongs to a highly conserved repetitive mammalian gene family designated LLRep3.33 It participates in aminoacyl-transfer RNA binding to the ribosome and this potentially affects the fidelity of the mRNA translation.32
In addition, ubiquitin,42 elongation factor 1α,43-45 the acidic ribosomal phosphoprotein PO,46,47 and the ribosomal protein S248,49 have been shown to be upregulated in tumor cells. This appears to be the first report on upregulation and downregulation of these genes in normal cells, namely liver sinusoidal endothelial cells. If one assumes that upregulation of these genes in different cultured tumor cells and in vivo in tumor models are of importance for the survival of tumor cells, then it is intriguing to speculate on our observation that the same genes are differentially regulated in ex vivo–isolated liver sinusoidal endothelial cells of liver tumor-bearing mice, depending on their immune status. The four genes were upregulated in liver endothelial cells of Balb/c (nu/nu) mice (Fig 4), but downregulated in the respective cells from immuno-competent mice, which survived twice as long (Fig 3). Thus, upregulation of these genes seems to correlate with tumor cell growth, both in vitro and now also in vivo, in this liver metastasis model.17 In the context of immune response influences it is noteworthy that ubiquitin has been shown to be involved in antigen presentation.50 Further studies are required to provide evidence for a causal relationship between upregulation of these genes in endothelial cells and facilitation of tumor metastasis on one hand and downregulation of these genes and retardation of liver metastasis formation.
While using the ex vivo isolation technique of liver endothelial cells, it was possible to study the influence of microenvironmental factors, immune response, and cell-cell and cell-matrix interactions on endothelial gene expression in vivo. The effects observed in freshly ex vivo–isolated cells were more profound than those obtained in tissue culture experiments. This study exemplifies how the combination of techniques of molecular biology, cell biology, immunology, and cancer research allows for the unraveling of complex in vivo phenomena, such as metastasis formation, at the molecular level.
B.L. and M.R. contributed equally to this work.
Supported by a grant from the Dr Mildred Scheel Stiftung (no. 10-0980-Schi2, M.R. and V.U.), the Schilling Stiftung (P.P.N.), a grant of the Deutsche Forschungsgemeinschaft (to P.P.N.) and the Sonderforschungsbereich 405 supported by the Deutsche Forschungsgemeinschaft (P.P.N.).
Address reprint requests to Volker Schirrmacher, PhD, Tumor Immunology Program, German Cancer Research Center, Im Neuenheimer Feld 280, 69120 Heidelberg, Germany; e-mail: V.Schirrmacher@dkfz-heidelberg.de.
The publication costs of this article were defrayed in part by page charge payment. This article must therefore be hereby marked "advertisement" is accordance with 18 U.S.C. section 1734 solely to indicate this fact.


This feature is available to Subscribers Only
Sign In or Create an Account Close Modal