Abstract
E-cadherin gene is often termed a “metastasis suppressor” gene because the E-cadherin protein can suppress tumor cell invasion and metastasis. Inactivation of the E-cadherin gene occurs in undifferentiated solid tumors by both genetic and epigenetic mechanisms; however, the role of E-cadherin in hematologic malignancies is only now being recognized. E-cadherin expression is essential for erythroblast and normoblast maturation, yet expression is reduced or absent in leukemic blast cells. This study examined the messenger RNA (mRNA) and protein expression of the E-cadherin gene in bone marrow and blood samples from normal donors and patients with leukemia. We found that all normal donor samples expressed E-cadherin mRNA, whereas both samples of acute myelogenous leukemia and chronic lymphocytic leukemia had a significant reduction or absence of expression. However, normal blast counterparts expressed only a low level of E-cadherin surface protein. Sodium bisulphite genomic sequencing was used to fully characterize the methylation patterns of the CpG island associated with the E-cadherin gene promoter in those samples with matched DNA. All of the normal control samples were essentially unmethylated; however, 14 of 18 (78%) of the leukemia samples had abnormal hypermethylation of the E-cadherin CpG island. In fact both alleles of the E-cadherin gene were often hypermethylated. We conclude the E-cadherin gene is a common target for hypermethylation in hematologic malignancies.
The E-cadherin gene (E-cad) on chromosome 16q22.1 encodes a protein product important in the maintenance of the epithelial phenotype mediated by a Ca++-dependent, homotypic cell-cell adhesion (reviewed in reference 1). The gene has been termed a “metastasis suppressor” gene, because the E-cadherin protein can suppress tumor cell invasion and metastasis.2E-cad gene expression is reduced or silenced in carcinomas of the breast3 and liver4 and many cell lines including those from colon, stomach, and prostate.5 These carcinomas are generally poorly differentiated, and reduced E-cad gene expression has been shown to correlate with disease aggressiveness in prostate or breast cancer.2 E-cadherin recently was found to have an unexpected role in hematopoiesis, the E-cadherin protein being functionally involved in the maturation of erythroid progenitors.6 Leukemic blasts, however, had no detectableE-cad gene in acute lymphoblastic leukemia (ALL), chronic myeloblastic leukemia (CML), and acute myeloblastic leukemia (AML).7
The underlying mechanism of reduced or absent E-cad gene expression in solid malignancies is not clear; however,trans-acting pathways,8 allelic loss, 9chromatin rearrangement,10 mutation,11 and hypermethylation3-5,12 of the cytosine residues in the CpG-rich promoter regions (CpG islands) have all been implicated. Normal cytosine methylation patterns are established early in development by the processes of demethylation and de novo methylation primarily at the cytosines of CpG dinucleotides (reviewed in reference 13). These methylation patterns are faithfully maintained through subsequent cell division by the DNA methyltransferase enzyme (DNA MTase).14 Changes in DNA cytosine methylation patterns are common in solid and hematologic malignancies, with both hypomethylation and hypermethylation15,16 and a concurrent increase in the levels of DNA MTase.17 It is the aberrant hypermethylation of CpG islands that is of particular interest to cancer biology because there is a strong association with gene inactivation.18 Although most CpG dinucleotides in a normal cell are methylated, the CpG dinucleotides comprising CpG islands are essentially unmethylated in all tissues,19 but appear to become hypermethylated in specific tumor suppressor genes in most malignancies including leukemia.15 18
Because changes in methylation patterns are common in leukemia, we determined the role that DNA methylation might play in the reduction ofE-cad gene expression in leukemic blast cells. In this report, we confirm a reduction or silencing of the expression levels of E-cad mRNA in blood and bone marrow from patients with leukemia when compared with normal donors. We also determined the detailed methylation patterns of 29 CpG sites in the E-cad gene CpG island using the technique of sodium bisulphite genomic sequencing,20-22 and show that bi-allelic hypermethylation of the E-cad gene CpG island is common in leukemia.
Materials and methods
Tissue samples
Blood samples obtained by venous aspiration or bone marrow samples obtained by aspiration were collected from patients presenting with either AML, ALL, or CLL. Lymphocytes were isolated from the blood samples by a Ficoll-Paque gradient as per manufacturer's instructions (Amersham Pharmacia Biotech AB, Uppsala, Sweden), and bone marrow cells were collected by centrifugation following lysis in hypotonic lysis buffer. The proportion of marrow blasts, where known, was more than 70%. The bone marrow used as a normal control was aspirated from the sternal cavity from patients undergoing cardiac surgery who had given prior informed consent, and the normal blood was obtained from regular donors to the blood bank. The study was approved by the Ethics Committee of Royal Prince Alfred Hospital. DNA and RNA were isolated using TriZOL reagent (Gibco-BRL, Life Technologies, Gaithersburg, MD).
mRNA expression analysis (reverse transcriptase-polymerase chain reaction [RT-PCR])
Complementary DNA (cDNA) was reverse transcribed from 1 to 2 μg of total RNA in a 25-μL reaction using AMV reverse transcriptase (Promega, Madison, WI) as per the manufacturer's instructions. The reaction was primed with 0.5 to 1 μg of random hexamers (Boehringer, Mannheim, Germany). Both E-cadherin and transferrin receptor RT-PCR reactions used the same cDNA synthesis. The PCR reactions were performed in volumes of 25 μL consisting of 200 μmol/L dNTPs, 100 ng primers, 1.75 mmol/L or 2.0 mmol/L MgCl2 (for E-cadherin and transferrin receptor, respectively), 1.0 μCi [33P]-α dATP, and 2 units AmpliTaq DNA polymerase (Perkin-Elmer, Norwalk, CT) with 1 μL (transferrin receptor) or 2 μL (E-cadherin) of cDNA in the manufacturer's buffer (Perkin-Elmer). Transferrin receptor was amplified to control for RNA integrity. The primers used for the amplification of transferrin receptor mRNA were Trans5′ (1764-1786): CTGTTGTATACGCTTATTGAGAA and Trans3′ (2064-2086): CTAACCCATGATGTTGAATTGAA; the primer coordinates in parentheses refer to accession number X01060. The primers for the amplification ofE-cad gene mRNA were Ecad3 (2071-2094): GGTGGGTGACTACAAAATCAATCT, and Ecad2 (2357-2380): TTCTCCGCCTCCTTCTTCATCATA, accession number Z13009. Reactions were performed in a Hybaid DNA Thermal Cycler (Ashford, UK) under the following conditions: E-cadherin—96°C/4 minutes for 1 cycle; 95°C/60 seconds, 62°C/90 seconds, 72°C/90 seconds for 5 cycles; 95°C/60 seconds, 64°C/60 seconds, 72°C/60 seconds for 25 cycles; 72°C/180 seconds for 1 cycle. Transferrin receptor: 96°C/4 minutes for 1 cycle; 95°C/60 seconds, 60°C/90 seconds, 72°C/90 seconds for 5 cycles; 95°C/60 seconds, 60°C/60 seconds, 72°C/60 seconds for 25 cycles; and 72°C/180 seconds for 1 cycle. Products were electrophoresed on a 6% acrylamide gel, dried, and exposed to a PhosphorImager (Molecular Dynamics, Sunnyvale, CA).
Surface expression analysis (FACS)
To determine the extent to which normal counterpart cells express E-cadherin protein, 1 mL normal mononuclear bone marrow cells separated by centrifugation through Ficoll-Paque or 5 mL normal blood was analyzed. The cells were incubated with 20 μL rabbit polyclonal anti-E-cadherin antibody (Santa Cruz Biotechnology, Santa Cruz, CA) according to the manufacturer's directions, and visualized by adding 2 μL of sheep antirabbit fluorescein isothiocyanate (FITC)-labeled monoclonal antibody (Silenus, Hawthorn, Australia). The cells were labeled with 10 μL phycoerythrin-labeled murine monoclonal anti-CD34 antibody (Becton Dickinson, Mountain View, CA) according to the manufacturer's directions, and a second tube was labeled using 20 μL phycoerythrin-labeled murine monoclonal anti-glycophorin A antibody (DAKO, Carpinteria, CA). Flow cytometric data were acquired on a Coulter EPICS-XL-MCL flow cytometer (BeckmanCoulter, Hialeah, FL).
Methylation analysis
Bisulphite genomic sequencing was used to determine the methylation pattern of the E-cadherin CpG island. The bisulphite reaction was carried out for 16 hours at 55°C on 1 to 2 μg of Hind III digested patient DNA in 18 μL, under conditions described in Clark et al.21 Following bisulphite conversion, the DNA was ethanol precipitated, dried, and resuspended in 100 μL TE (10 mmol/L Tris-HCl, pH 8; 1 mmol/L EDTA) and stored at −20°C.
The CD34+ cells were isolated from normal bone marrow and peripheral blood using Dynabeads M-450 Rat antimouse IgG1 magnetic beads (Dynal, Carlton, Australia), according to the manufacturer's instructions (direct technique). A total of 3.75 μg murine monoclonal anti-CD34 antibody (Becton Dickinson) was conjugated to 200 μL Dynabeads, and 100 μL was added to each bone marrow and peripheral blood sample. The CD34+ cells were lysed while still conjugated to the Dynabeads by the addition of 200 μL cell lysis buffer (100 mmol/L Tris-HCl, pH 8, 3% sodium dodecyl sulfate (SDS), 50 mmol/L EDTA, 200 μg/mL Proteinase K) and an 18-μL aliquot was treated with sodium bisulphite as outlined above.
A nested PCR was performed using the following primers: outer1 (791-820): ATTTAGTGGAATTAGAATAGTGTAGGTTTT; outer2 (1139-1165): CTACAACTCCAAAAACCCATAACTAAC; inner1M13 (841-858): TGTAAAACGACGGCCAGTTTAGTAATTTTAGGTTAGAGGG; inner2 (1139-1165): CTACAACTCCAAAAACCCATAACTAAC; accession number L34545. The incorporation of the (−21)M13 universal primer sequence into the inner primer enabled direct sequencing of the PCR product.
The nested PCR amplifications were performed on 2 μL of bisulphite-treated genomic DNA in a reaction mix containing 200 μmol/L of each of the 4 dNTPs and 2 U AmpliTaq DNA polymerase (Perkin-Elmer). The reactions were performed in 50-μL reactions containing 67 mmol/L Tris, 16.6 mmol/L ammonium sulfate, 1.7 mg/mL bovine serum albumin, 10 mmol/L β-mercaptoethanol in TE buffer (10 mmol/L Tris-HCl, pH 8.0; 0.1 mmol/L EDTA) and 300 ng of each primer. Reactions were cycled in a Hybaid DNA Thermal Cycler using the following cycling conditions: 96°C/3 minutes for 1 cycle; 95°C/1 minute, 55°C/2 minutes, 72°C/3 minutes for 5 cycles; 95°C/1 minute, 55°C/2 minutes, 72°C/2 minutes for 23 cycles; and 72°C/4 minutes for 1 cycle. The primers used were shown to amplify methylated and unmethylated DNA without notable bias under these PCR conditions.23
Direct sequencing
The PCR products were purified using a WIZARD PCR clean-up column (Promega), and direct PCR sequencing reactions were performed using a PRISM Dye Primer Cycle sequencing kit (−21M13 Fwd) with AmpliTaq FS (Perkin-Elmer) and electrophoresed using an automated 373A DNA Sequencer (ABI). Sequencing reactions were performed as recommended by the manufacturer. The amount of methylcytosine of each CpG dinucleotide was quantitated by comparing the peak height of the cytosine signal with the peak height of the cytosine plus thymine signal.
Statistical analysis
Statistical analysis was performed using InStat v2.02 (Macintosh), applying a nonparametric unpaired 2-tailed test.
Results
E-cad gene expression
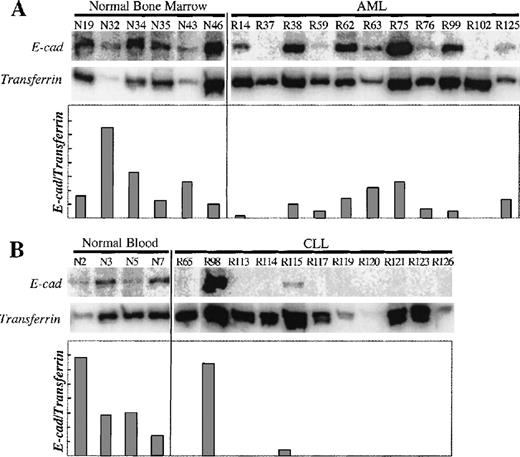
To determine the expression levels of E-cad gene mRNA in normal and leukemic cells, we used RT-PCR, coamplifying transferrin receptor (CD71) cDNA as a control for RNA integrity and cDNA synthesis. The transferrin receptor gene was chosen because it is widely expressed on hematopoietic progenitors,24 and therefore any differential E-cad gene expression would be the result of selective E-cad gene silencing. As shown in Figure1, all the normal bone marrow and blood controls expressed E-cadherin mRNA, whereas both AML and CLL samples showed an overall reduction or absence of expression.
Expression analysis of the E-cad gene.
(A) E-cadherin and transferrin receptor RT-PCR products were amplified from bone marrow samples from normal donors and patients with AML. (B) E-cadherin and transferrin receptor RT-PCR products were amplified from blood samples from normal donors and patients with CLL. E-cadherin PCR product is 310bp, and the transferrin receptor PCR product is 323 bp. The sample numbers are labeled above each lane (R, leukemic patient; N, normal sample). The relative amount of E-cadherin expression versus transferrin receptor expression (E-cad/transferrin) is expressed in the graph.
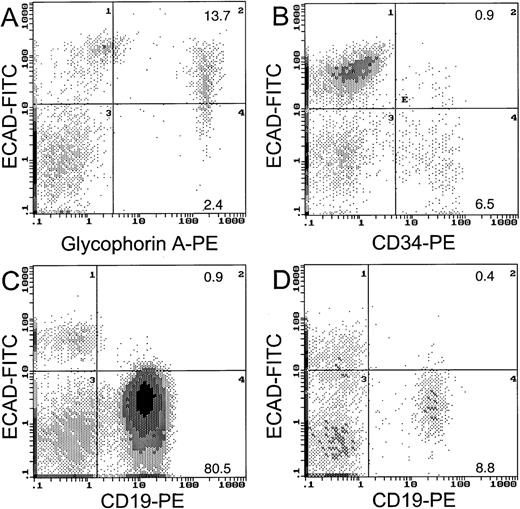
To clarify whether the normal counterparts of leukemic cells express E-cadherin protein on the cell surface, we assayed protein expression in CD34+ cells by flow cytometry. Figure2 shows that of the CD34+ cells in the normal bone marrow, 12% expressed E-cadherin protein on the cell surface. We found that the majority (85%) of the glycophorin A-positive cells (erythroid cells) coexpressed E-cadherin protein, similar to the findings of Buhring and coworkers.7It is likely that the erythroid component contributed to the high level of E-cadherin mRNA expression in unseparated normal marrow cells, although a low proportion of the normal blast counterparts did express E-cadherin protein. Only a small proportion of CD19+lymphocytes from normal (4%) or CLL blood (1%) expressed E-cadherin protein on the cell surface (Figure 2). The substantial E-cad gene mRNA expression in the Ficol-separated fraction of normal blood may have been due to contaminating monocytes.
Two-color FACS analysis for E-cadherin cell surface protein.
Coexpression of E-cadherin is shown for glycophorin A cells from normal bone marrow (A), CD34 cells from normal bone marrow (B), CD19 cells from CLL blood (C), and CD19 cells from normal blood (D).
Two-color FACS analysis for E-cadherin cell surface protein.
Coexpression of E-cadherin is shown for glycophorin A cells from normal bone marrow (A), CD34 cells from normal bone marrow (B), CD19 cells from CLL blood (C), and CD19 cells from normal blood (D).
Methylation profile of the E-cadherin gene CpG island
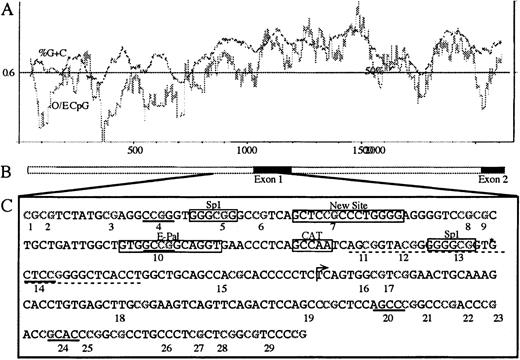
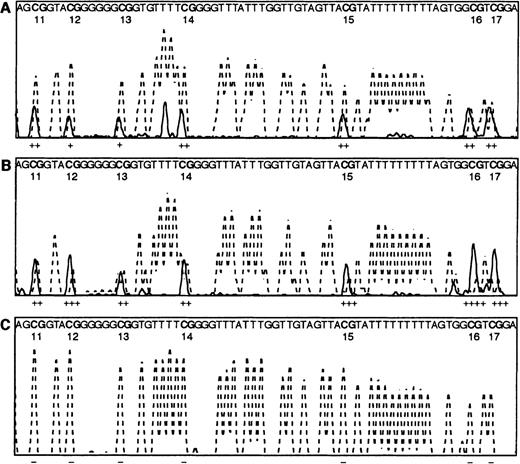
We determined the methylation profile of the E-cad gene CpG island from patient samples and normal controls that had matched DNA, to look for a possible mechanism that was responsible for the reduction in E-cadherin expression. The E-cad gene has an associated CpG island that incorporates the promoter, exon 1, and part of intron 1.25 The CpG island also contains the −191 minimal promoter region important to E-cad gene expression,5 and other transcription-enhancing factors such as Sp1, E-Pal, and GC region10 (Figure3). It is known that artificial methylation of the Hpa II sites, within this CpG island, is sufficient to inhibit transcription.5 However, previous studies have used methylation specific PCR (MSP) and Southern blot analysis that do not give information on individual CpG sites.26,27 We have determined the methylation status of 29 CpG sites located within the CpG island by bisulphite genomic sequencing to see if any CpG sites were preferentially methylated, particularly those comprising transcription factor binding sites. To estimate the methylation levels at each CpG site, within the population of molecules amplified, we used direct PCR sequencing. Examples of the direct sequencing profiles, containing the cytosine versus thymine tracks used for quantitation, are shown in Figure 4. It is important in quantitative analysis to ensure that both methylated and unmethylated molecules amplify in proportion. Therefore, PCR conditions were optimized to ensure representative amplification of methylated and unmethylated molecules in the PCR product, as shown in Figure4A.23
Map of the E-cad gene.
(A) CpG island plot across the 5′ promoter region through to exon 2 (compiled from Genbank accession numbers L34545, L36526, and L34937). The dark line is the %G+C, and the lighter line is the observed/expected CpG density (O/E CpG). (B) Schematic representation of the gene, where the black boxes represent the coding regions of exon 1 and exon 2. (C) The E-cad gene DNA sequence analyzed by bisulphite genomic sequencing from bases 863-1138 (L34545), incorporating 29 CpG sites. CpG dinucleotides are numbered below each site. The Hpa II sites are underlined with a solid line, and the GC region is underlined with a dotted line. Other features are boxed and labeled. An arrow represents the transcription start site between CpG sites 15 and 16. The identified polymorphism (A or T), after bisulphite sequencing, is at coordinate 862, and is immediately 5′ to CpG site 1. Bisulphite sequencing of this region identified an additional thymine at *, which is not present in the published sequence (L34545).
Direct PCR bisulphite sequencing profiles.
Electrophoretograms of the CpG region of the E-cad gene from CpG dinucleotides 11-17 show the T peaks (dotted line) and C peaks (solid line) only. Note the sequence given within each panel is that of the bisulphite-converted DNA, except for the CpG dinucleotides that are shown as CG. The estimated amounts of methylcytosine, calculated by measuring the peak height of the cytosine over the peak heights of the cytosine plus thymine, are shown under each dinucleotide, where − indicates 0% methylation, + 1% to 25% methylation, ++ 26% to 50% methylation, +++ 51% to 75% methylation, and ++++ 76% to 100% methylation. (A) 50% methylated control PCR reaction, as described in Warnecke et al.23 (B) AML patient R99, with methylation throughout the region. (C) Normal bone marrow control N43, with no methylation evident throughout the region.
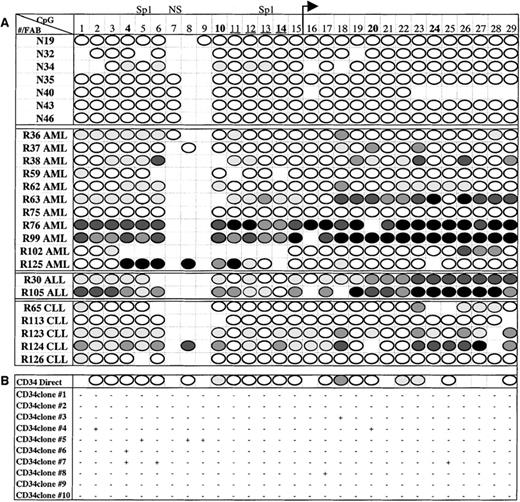
Six normal, 10 AML, and 4 CLL samples that had been assessed forE-cad gene expression by RT-PCR also had matched DNA that was available for methylation analysis. In addition, N40 (normal), R36 (AML), R124 (CLL), and 2 ALL patients who did not have corresponding RNA were analyzed for DNA methylation. Of the 7 normal bone marrow samples, only 1 (N34) of 7 (14%) had any detectable methylation; however, the methylation was at a low level (< 25%) and was restricted to only 5 of the 29 CpG sites (Figure5A). Moreover, the CD34+ cells isolated from normal bone marrow were essentially unmethylated as shown by direct PCR sequencing (Figure 5B). To determine if there was a low level of methylation in individual molecules, the PCR fragment from the CD34+ cells was cloned and sequenced. Four of the 10 molecules sequenced showed no evidence of methylation, whereas the other molecules showed methylation at 1 to 3 individual CpG sites; however, these sites varied between molecules (Figure 5B).
Methylation maps of E-cad gene CpG island.
(A) Summary of the direct PCR sequencing analysis for normal and leukemic samples. The sample number and leukemia subtype (FAB classification) are in the left column, and the CpG sites are numbered across the top row. ◍ represents up to 25% methylation, ◍ represents 26% to 50% methylation, ◍ represents 51% to 75% methylation, • represents 76% to 100% methylation, and ○ represents no methylation, as determined by direct PCR sequencing. Absence of a score indicates that the methylation at that site was unable to be determined due to enzyme stoppage in the sequence. (B) Methylation results for CD34+ cells. The top row represents the direct sequencing results, followed by the methylation patterns for 10 cloned molecules. + indicates a methylated CpG site and − indicates an unmethylated CpG site.
In contrast to the normal samples, 14 of 18 (78%) samples from patients with leukemia displayed extensive methylation across theE-cad gene CpG island (Figure 5A). A hypermethylated phenotype was found in cells from all leukemic subtypes, including 9 of 11 (82%) AML patients, 2 of 2 (100%) ALL patients, and 3 of 5 (60%) CLL patients, with extensive hypermethylation spanning the E-cadgene CpG island. The methylation patterns were heterogeneous, ranging from limited methylation in some patients (eg, R36, R37, R62, and R102) to methylation in each determinable CpG site (R76 and R99). The methylation patterns were not restricted to Hpa II or transcription factor sites, but rather encompassed the entire region analyzed.
Bi-allelic E-cadherin methylation
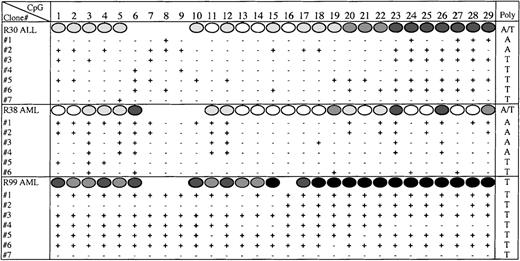
In some patient samples, the degree of methylation at individual CpG sites was high (50%-100%) in particular in the 3′ region that corresponds to exon 1 and the core of the CpG island. This high degree of methylation reflected either that the methylation was bi-allelic, or that 1 allele was deleted. To address whether methylation of theE-cad gene was bi-allelic we identified an informative polymorphism (T or A) within the sequenced region. Approximately 50% of the normal and leukemia patients were heterozygous for the polymorphism. We cloned and sequenced the PCR products from 2 patients who were heterozygous for the polymorphism, AML patient (R38) and ALL patient (R30). Figure 6 shows that methylation across the E-cad gene CpG island was bi-allelic for both R38 and R30 because the clones containing either the T or A polymorphism were methylated. In addition, the degree of methylation, as well as the methylation profile, appeared to be similar for each allele. Although only a small number of clones were analyzed, the level of methylation reflected the direct sequencing methylation estimates. We also cloned and sequenced the PCR product from an AML patient (R99) who was homozygous for the polymorphism (Figure 6). All the molecules sequenced from R99, except for 1, were heavily methylated. Because the methylation profiles from most of the molecules were similar, it is unclear whether R99 had lost 1 allele, or whether hypermethylation was also bi-allelic.
Bi-allelic methylation of E-cadherin.
The methylation status at each CpG site (1-29), as determined by cloning and sequencing the PCR products amplified from bisulphite-treated DNA from R30, R38, and R99. The direct sequence methylation estimates are shown above (Figure 5). The polymorphism (A or T) identified in each molecule is given in the last column.
Discussion
The E-cad gene is important in the metastatic potential of tumors as its expression confers “metastasis suppressing” properties to the malignant cells.1 DiminishedE-cad gene expression is associated with poorly differentiated aggressive carcinomas and is a prognostic marker of poor clinical outcome in some tumors. The role of E-cadherin in hematopoiesis and leukemia is not clear. Although E-cadherin protein is mainly found on the cell surface of epithelial cells, it has also been established that colony-forming units–erythrocytes (CFU-E), normoblasts, and erythroblasts express E-cadherin.6,7Indeed erythroid progenitor cells are dependent on E-cad gene expression for maturation.6 Our data show that a small proportion of normal CD34 progenitor cells express E-cadherin on the cell surface, similar to the results of others.6,7 However, cells from patients with acute leukemia and CLL show reduced or absent E-cadherin mRNA expression. Normal CD34+ stem cells circulate continuously in the blood,28 29 as do most leukemic cells, and it is conceivable that this ability to leave the marrow microenvironment could be related to decreased E-cadgene expression.
Reduced E-cad gene expression could be mediated by a number of mechanisms including mutation, loss of heterozygosity,trans-acting pathways, chromatin rearrangement, or DNA hypermethylation of the CpG island. Alterations in DNA methylation patterns are commonly found in essentially all cancers, often with concomitant changes in gene expression.18 Changes in methylation patterns are common in leukemia16 and leukemic blast cells have an elevated expression of DNA MTase.17 In this study, we analyzed E-cad gene methylation across 29 CpG sites in the CpG-rich promoter region using sodium bisulphite analysis. We found hypermethylation in DNA from 78% of patients with leukemia, including both acute and chronic types (AML, ALL, and CLL). The methylation profile across the CpG island was heterogeneous, with no single CpG site consistently methylated. The transcription enhancing elements Sp1, E-Pal, and the GC box did not appear to differ in the amount of de novo methylation with respect to the rest of the CpG island. This is similar to the methylation patterns we have characterized for other genes in both cancer and normal cells30-32 and supports the idea that it is not the methylation of critical CpG sites in vivo that is important for gene silencing. Furthermore, the density of methylation in the CpG island also did not appear to be linked to gene expression because a small number of patient samples had absent (eg, R113) or limited (eg, R126) E-cadherin expression without corresponding methylation of the CpG island promoter. These results support the possibility that gene silencing is a precursor to aberrant CpG island methylation in cancer.
The mechanism of CpG island methylation in cancer is unclear. Graff et al26 have reported that E-cad gene CpG island methylation is initiated from flanking methylated Alu sequences, where the methylation spreads into the body of the gene. Because the methylation pattern found in our study was heterogeneous, it is not clear if the methylation has spread from the ends of the CpG island or was initiated within the CpG island. Our data support initiation of methylation from within the CpG island because some samples had no methylation in the beginning of the island that flanks the Alu sequences but moderate methylation within the body of the CpG island, whereas other samples were extensively methylated throughout the region. In addition, a low level of methylation was found to exist at individual CpG sites in some molecules in the normal CD34+counterparts. This raises an interesting possibility that in leukemia the hypermethylation of the E-cad gene CpG island may be triggered by a combination of elevated expression of DNA MTase17 and a low level of methylated CpG sites in the CpG island. These CpG sites could act as seeds to aid methylation expansion across the CpG island. The hypermethylated foci are found scattered in different positions throughout the island in different samples possibly reflecting the distribution of the initial CpG sites that were methylated in the normal cell.
The results of this study have given an insight into the E-cadgene expression in hematopoiesis and hypermethylation in leukemogenesis. The E-cadherin protein was expressed at only low levels in normal CD34+ and CD19+ cells, despite theE-cad gene CpG island being essentially unmethylated. In contrast, hypermethylation in the E-cad gene CpG island was common in leukemic cells and was frequently found to be methylated on both E-cad gene alleles. Therefore, there must be a mechanism common in the genesis of leukemia that renders the E-cad gene CpG island promoter region susceptible to hypermethylation.
Acknowledgments
We thank Cheryl Paul for the automated sequencing, and Dr Doug Millar and Dr Alpha Yap for advice and helpful discussions.
J.R.M. is funded by the Anthony Rothe Memorial Trust postgraduate scholarship and an Anthony Rothe Memorial Trust grant.
Reprints:Susan J. Clark, CSIRO Molecular Science, Sydney Laboratory, PO Box 184, North Ryde, NSW 1670, Australia; e-mail:susan.clark@molsci.csiro.au.
The publication costs of this article were defrayed in part by page charge payment. Therefore, and solely to indicate this fact, this article is hereby marked “advertisement” in accordance with 18 U.S.C. section 1734.

This feature is available to Subscribers Only
Sign In or Create an Account Close Modal