Abstract
The antiapoptotic proteins, Bcl-2 and Bcl-XL, are expressed in most cases of acute myeloid leukemia (AML) and may contribute to drug resistance in AML. We tested the hypothesis that down-regulation of Bcl-2 alone by antisense oligodeoxynucleotides (Bcl-2-AS) induces apoptosis, even in the presence of other antiapoptotic genes. We tested Bcl-2-AS in myeloid leukemic HL-60 cells, in Bcl-2 and Bcl-XL overexpressing HL-60-DOX cells, and in primary AML samples. Down-regulation of Bcl-2 by Bcl-2-AS reduced the viability of HL-60 cells and, less effectively, HL-60-DOX cells and increased ara-C cytotoxicity in both cell lines. Incubation of primary AML blasts with Bcl-2-AS decreased Bcl-2 expression in CD34+ blast cells after induction of apoptosis and enhancement of ara-C cytotoxicity in 11 of 19 primary AML samples. In 8 samples in which Bcl-2-AS did not induce apoptosis, baseline Bcl-2 levels were found to be strikingly high. The expression of other antiapoptotic proteins (Bcl-XL, Bag-1, A1, and Mcl-1) did not prevent Bcl-2-AS–induced apoptosis. Bcl-2-AS also inhibited colony formation of AML progenitor cells. Low concentrations of Bcl-2-AS induced significant increases in S-phase cells (P = .04). Results establish Bcl-2 as a critical target for AS strategies in AML in which the baseline levels predict response to Bcl-2-AS. Bcl-2 exerts both antiapoptotic and antiproliferative functions in AML. Because early normal hematopoietic stem cells do not express Bcl-2, Bcl-2-AS therapy should be highly selective for AML cells.
Physiologic cell death (apoptosis) is controlled by an intrinsic genetic program that is remarkably conserved in evolution. All currently available cytotoxic drugs induce tumor death by triggering apoptosis. However, many tumors have defects in the regulation of genes that control apoptosis. This may contribute to their growth and also render them resistant to chemotherapeutic agents. Members of the Bcl-2 family regulate a distal step in the cell death pathway. Although its mechanism of action is still unclear, Bcl-2 appears to function as a suppressor of cell death that can be triggered by a variety of signals. In gene transfection experiments, overexpression of Bcl-2 and its homolog Bcl-XL can render neoplastic cells resistant to the induction of apoptosis by a variety of chemotherapeutic drugs.1-5
Likewise, down-regulation of the Bcl-2 protein has been shown to reverse chemoresistance in several experimental systems.6-9In acute myeloid leukemia (AML), high Bcl-2 levels are associated with resistance to chemotherapy, decreased rates of complete remission, and shortened survival.10-14
Recently, it was demonstrated that Bcl-2 not only inhibits apoptosis but also restrains cell cycle entry15-17 and that these 2 functions can be genetically dissociated.18 This antiproliferative effect could provide additional cytoprotection because proliferating cells are more vulnerable to apoptotic stimuli. Therefore, agents that can overcome the inhibitory effects of Bcl-2 on cell cycle entry could be a useful adjunct to currently available chemotherapeutic drugs.
Inhibiting the function of Bcl-2 might have a more pronounced effect on neoplastic cells than on normal cells, that is, the loss of cell cycle control mechanisms drives cells into the cell cycle, despite drug-induced damage.19 Inactivation of the G1cell cycle checkpoint occurs when p53 is inactivated, either by mutation or deletion.20 Cells, then, do not arrest and repair DNA damage but proceed through the cell cycle and undergo programmed cell death. It is known that the most primitive hematopoietic precursors express Bcl-XL but not Bcl-2.21,22 Bcl-2 is universally expressed in AML progenitors cells, and a subset of patients with AML have higher levels of expression than normal CD34+ cells.10,14Results from our group and others indicate that retinoids down-regulate the expression of Bcl-2, and can enhance the effect of chemotherapy in vitro.22,23 Recent data suggest the ability of all-trans retinoic acid to inactivate Bcl-2 by phosphorylation.24Antisense oligodeoxynucleotides targeted against Bcl-2 have been used to induce apoptosis of malignant cells or to sensitize them to conventional chemotherapeutic drugs,6-8 and the first clinical study of Bcl-2 antisense therapy in patients with recurrent non-Hodgkin's lymphoma was recently reported.25 Other studies suggest that liposomal delivery of oligodeoxynucleotides may circumvent the poor cellular uptake and delivery of antisense oligodeoxynucleotides alone.26 We have recently demonstrated that the p-ethoxy modification of phosphodiesters enhances nuclease resistance and increases incorporation efficiency into liposomes.27 Experimental animal models indicate a lack of significant adverse effects such as autoimmunity and organ toxicity. Liposomal oligodeoxynucleotides are mainly distributed to the liver, spleen, and bone marrow, which are the major organs of leukemic manifestation.28 Thus, liposomal delivery of anti-Bcl-2 oligodeoxynucleotides (Bcl-2-AS) in combination with chemotherapeutic agents and biologic response modifiers may potentially be used as novel treatment modalities for hematologic malignancies.
In this study, we used liposomally delivered Bcl-2-AS to induce down-regulation of the Bcl-2 protein in AML cells. Similar approaches in different tumor models have resulted in decreased cell survival,29,30 the induction of apoptotic cell death,31 and increased drug sensitivity in vitro and in vivo.6,32 Because other antiapoptotic proteins are expressed in AML,22,33 we wished to investigate whether Bcl-2 was critical for AML survival and if apoptosis could be induced, in particular, despite high levels of antiapoptotic Bcl-XL, which is expressed in most AML.22,34 35 Also, we wished to investigate what levels of cellular Bcl-2 are critical for the survival and chemoresistance of primary AML cells.
Materials and methods
Cell lines
We used 2 AML cell lines, HL-60 and the 60-doxorubicin-resistant subline/HL-60-DOX.36 Both express Bcl-2, but HL-60-DOX cells were previously found by us to express significantly higher amounts of both antiapoptotic proteins, Bcl-2 and Bcl-XL.37 Cell lines were cultured in RPMI medium supplemented with 10% heat-inactivated fetal calf serum (FCS) at 37°C under 5% CO2 in a humidified incubator.
Subjects
Samples of bone marrow or peripheral blood for in vitro studies from newly diagnosed or recurrent AML with a high (more than 40%) blast count were obtained under informed consent according to institutional guidelines. Mononuclear cells were separated by Ficoll-Hypaque (Sigma Chemical, St Louis, MO) density-gradient centrifugation.
Preparation of liposomal oligodeoxynucleotides
P-ethoxy oligodeoxynucleotides (ODN) (Oligos Etc, Willsonville, OR) were chosen because this modification makes ODN nuclease resistant and can be efficiently incorporated into liposomes. Liposomal oligodeoxynucleotides were prepared as previously described.38 Briefly, ODN dissolved in DMSO were added to phospholipids (Avanti Polar Lipids, Alabaster, AL) in the presence of excess tert-butanol. The mixture was frozen in a dry ice/acetone bath, lyophilized overnight, and finally hydrated with 0.9% normal saline at a final oligodeoxynucleotide concentration of 0.1 mmol/L. For Bcl-2-AS, we used a sequence, which is complimentary to the Bcl-2 translation initiation site (5′-CAGCGTGCGCCATCCTTCCC-3′).39Scrambled sequence (nonsense, NS) oligodeoxynucleotides (5′-TCGCCACTCGATCCTGCCCG-3′) and empty liposomes were used as controls.
Suspension culture of leukemic cells
HL-60 and HL-60-DOX cells were cultured at 2.5 × 10⁴ cells/mL, and AML mononuclear cells were seeded at 5 × 10⁵ cells/mL. Cells were cultured in complete media (RPMI supplemented with 10% fetal calf serum [FCS]) in the presence or absence of liposomal Bcl-2-AS or NS at an appropriate concentration (see below). Empty liposomes were also included as controls. Granulocyte colony-stimulating factor (G-CSF) (200 U/mL) was added to cultures of fresh AML cells. In previous studies, we demonstrated that G-CSF and granulocyte-macrophage colony-stimulating factor (GM-CSF) support proliferation and block spontaneous apoptosis of AML blasts without affecting average Bcl-2 expression levels.40 For protein and apoptosis studies, a final concentration of 8 μmol/L ODN was used. These studies were repeated 3 times.
For cytotoxicity studies, 1 μmol/L ara-C was added to the cultures. After 72 hours, viable cells were counted with the trypan blue-dye exclusion method using a hematocytometer, and the viability of the leukemic cells was determined by the 3-(4,5-dimethylthiazol-2-yl)-5-(3-carboxymethoxyphenyl)-2-(4-sulphenyl)-2H-tetrazolium (MTS) assay as described below.
Quantitation of viability (MTS assay)
To determine cell viability, leukemic cells were seeded at a density of 2.5 × 10³ cells per well in 96-well plates (Costar, Cambridge, MA). Six hours later, liposomal Bcl-2-AS, NS, or empty liposomes were added to the cells at a final concentration of 2 to 20 μmol/L. After 5 days of culture, cell viability was measured using the Cell Titer 96 AQ Non-Radioactive Cell Proliferation Assay (Promega, Madison, WI). This assay is based on the ability of viable cells only to reduce MTS to formazan, which can be measured with a spectrophotometer at an absorbance of 490 nm. MTS solution (2 mL) was mixed with 100 μL of phenazine methosulfate (PMS) immediately before being added to the cells in the culture plate. The MTS/PMS solution (20 μL) was than added to each well to maintain a ratio of 20 μL MTS/PMS to 100 μL medium. After 1 hour, the reduction product was measured at an absorbance of 490 nm and compared with a standard curve.
Quantitation of Bcl-2 protein by flow cytometry
The cellular content of Bcl-2 was measured in conjunction with the CD34 antigen in AML blast cells. Briefly, after staining with phycoerythrin (PE)-conjugated anti-CD34 monoclonal antibody (HPCA-2; Becton Dickinson, San Jose, CA), cells were washed twice and fixed in 1% formaldehyde (Sigma) for 15 minutes on ice, followed by permeabilization with 0.1% Triton X in phosphate-buffered albumin (1% albumin, 0.1% NaN3) for 10 minutes at 4°C. Cells were then washed in cold phosphate-buffered saline (PBS) before being added to 10 μL of fluorescein isothiocyanate (FITC)-conjugated anti-Bcl-2 or isotype IgG1 monoclonal antibody (DAKO, Carpinteria, CA). Dead cells were eliminated by gating, based on their scatter (high side scatter and/or low forward scatter) characteristics, and Bcl-2 expression was measured selectively on live cells. The intensity of Bcl-2–associated fluorescence was measured on a logarithmic scale. Bcl-2 was quantitated using Quantum Simply Cellular microbeads with QuickCal Software (Flow Cytometry Standard, Triangle Park, NC), as previously described,41 42 and expressed as the antibody-binding capacity (ABC), which is an estimate of the number of antibody molecules bound per cell. A FACScan flow cytometer (Becton Dickinson) equipped with an argon laser (488 nm) was used to measure fluorescence. For each sample, 10 000 cells were analyzed; cells were live-gated for CD34 positivity. Data were analyzed using Lysys software (Becton Dickinson).
Detection of apoptotic cells and cell kinetics studies
Cell cycle kinetics were determined by staining cells with acridine orange for cellular DNA and RNA content, followed by flow cytometric analysis. This method is able to discriminate cells in G0, G1, S, and G2M phases and determines the mean RNA content per cell during each phase of the cell cycle.43A minimum of 30 000 cells were analyzed and the percentage of cells in the S-phase was determined using ModFit software (Verity Software House, Inc, Topsham, ME).
Detection of apoptotic cells based on DNA fragmentation
Aliquots (80 μL) of cells were mixed with 100 μL of solution containing 0.1% (vol/vol) Triton X-100, 0.05 mol/L HCl, 0.15 mol/L NaCl, and 8 μg/mL acridine orange (Polysciences, Warrington, PA). The cell fluorescence was measured within 5 minutes of staining, using the logarithmic scale of the FACScan flow cytometer with a 488-nm excitation of a 15-mW argon laser and filter settings for green (530 nm) (DNA) and red (585 nm) (RNA) fluorescence. Ten thousand events were stored in the list mode for analysis. The percentage of cells in the “sub G1 region” defined the proportion of apoptotic cells in the tested populations. Cell debris was defined as events in the lowest 10% range of fluorescence and eliminated from analysis.
Acute myeloid leukemia blast colony assay
A previously described method was used to assay AML blast colony formation.44,45 Bone marrow mononuclear cells containing more than 80% blasts from the bone marrow of patients with AML were incubated for 24 hours in Iscove's modified Dulbecco medium (IMDM) supplemented with 10% FCS and 50 ng/mL recombinant human GM-CSF (Immunex Inc, Seattle, WA). Bcl-2-AS was added at the initiation of cultures at concentrations of 4, 6, 8, and 12 μmol/L. Untreated cells and cells that were incubated for 24 hours in the presence of 12 μmol/L NS and empty liposomes were used as controls. After extensive washing, 1 × 10⁵ AML cells were plated in 0.8% methylcellulose in IMDM with 10% FCS and 50 ng/mL GM-CSF. Duplicate cultures were incubated in 35-mm petri dishes for 7 days at 37°C in a humidified atmosphere of 5% CO2 in air. AML blast colonies were microscopically evaluated on day 7. A blast colony was defined as a cluster of 40 or more cells. Individual colonies were plucked, smeared on glass slides, and stained to confirm leukemic cellular composition. As previously described, the AML blast colonies grown in this assay contained only blasts and no normal progenitors.46
In 4 experiments, 2 × 10⁵ CD34+ cells isolated from normal bone marrow (n = 2) or G-CSF–stimulated peripheral blood (n = 2) were plated in methylcellulose after 24 hours of preincubation with Bcl-2-AS (4, 6, 8, and 12 μmol/L) and 6 or 12 μmol/L of NS and empty liposomes as described above. Colony-forming unit–granulocyte macrophage (CFU-GM) and colony-forming unit–eosinophil (CFU-E) were microscopically evaluated on day 14 of culture.
Western blot analysis
Cells were lysed in protein lysis buffer. An equal amount of protein lysate was placed on 8% SDS-PAGE for 2 hours at 100 V, followed by transfer of the protein to a Nytran membrane (S&S, Heween, NH). Immunoblotting was performed at room temperature for 2 hours with 5% milk before incubation with the first antibody in 1:1000 dilution for another 2 hours, followed by 3 washings in phosphate-buffered saline (PBS). The procedure was repeated for the secondary antibody. Blots were then soaked in ECL buffer for 1 minute and exposed to ECL films. Polyclonal rabbit antibodies to Bcl-2, Bcl-XL, Bax, Bak, A1, Mcl-1,47-49 and a murine monoclonal antibody to Bag-150 were used at 1:1000 dilution (kindly provided by Dr J.C. Reed).
Statistical analysis
The statistical analysis was performed using the 2-tailed Student t test and the Spearman rank correlation coefficient. Statistical significance was considered when P < .05. Unless otherwise indicated, average values were expressed as mean ± SEM. The chi-square test was used to compare effects of Bcl-2-AS on AML cells in vitro with several clinical features of AML.
Results
Basal levels of Bcl-2 and Bcl-XL expression in leukemic cell lines
The level of protein expression was examined in the HL-60 myeloid cell line and its drug-resistant counterpart, HL-60-DOX, by quantitative flow cytometry and Western blot analysis. As shown in Figure 1A, HL-60-DOX cells express significantly higher levels of Bcl-2 than the parental HL-60 cells. Using a series of calibrated FITC microbeads (see “Materials and methods”), the antibody-binding capacity per cell was calculated. HL-60 cells had 49 × 103 ABC per cell and HL-60-DOX had 86 × 103 ABC per cell. By Western blot analysis, HL-DOX cells overexpressed both Bcl-2 and Bcl-XL(Figure 1B).
Bcl-2 expression in HL-60 and HL-60-DOX cells.
(A) Flow cytometry shows that HL-60-DOX cells have a significantly higher Bcl-2 expression than HL-60 cells (P = .02). (B) HL-60-DOX and HL-60 cell lysates were Western blotted and probed with Bcl-2 and Bcl-XL polyclonal antibodies. Loading of lanes was controlled with actin, demonstrating that equivalent amounts of protein were blotted (results not shown). Antimouse peroxidase and enhanced chemiluminiscence were used to detect immunoreactive bands.
Cytotoxic effects of Bcl-2-AS on HL-60 and HL-60-DOX cell lines
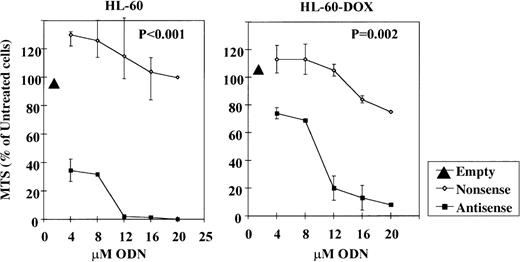
The effect of Bcl-2-AS on the growth of leukemic cell lines was tested using the MTS viability assay. Leukemic cells were incubated with increasing concentrations of Bcl-2-AS or NS for 5 days (Figure2). The viability of HL-60 cells was effectively reduced by Bcl-2-AS in a dose-dependent fashion (IC50 = 4 μmol/L). NS exhibited only a modest effect with all concentrations used. HL-60-DOX–resistant cells with a higher Bcl-2 and Bcl-XL content required a higher concentration of Bcl-2-AS to achieve equivalent toxicity (IC50 = 10 μmol/L), but were not protected by Bcl-XL. Empty liposomes did not inhibit cell growth under similar conditions, and NS only affected cell viability of HL-60-DOX cells when used in concentrations greater than or equal to 16 μmol/L. Interestingly, antisense oligonucleotides targeting the Bcl-XL translation initiation site were much less effective in killing HL-60 cells, with IC50 = 10 μmol/L in 2 independent experiments (unpublished observations).
Effect of Bcl-2-AS on the viability of HL-60 and HL-60-DOX cells as determined by MTS assay.
The viability of HL-60 cells and HL-60-DOX–resistant cells was effectively reduced by Bcl-2-AS in a dose-dependent fashion (IC50 = 4 and 10 μmol/L, respectively). NS and empty liposomes (EL) did not effect the cell viability.
Bcl-2-AS induces apoptosis of leukemic cells.
To investigate the mechanism of dose-dependent inhibition of cell growth, apoptotic cells were identified by flow cytometry based on differential staining with acridine orange (“sub G1region”). HL-60 and HL-60-DOX cells were treated with 8 μmol/L Bcl-2-AS or NS for 5 days. After permeabilization, cells were stained with acridine orange and analyzed by flow cytometry in 3 independent experiments. The number of apoptotic HL-60 and HL-60-DOX cells increased to 24.3% ± 5.1% and 25.3% ± 3.2%, respectively, after treatment with Bcl-2-AS, compared with treatment with NS (HL-60, 12.6% ± 4.8%; HL-DOX, 3.9 ± 0.9,P = .01) and control cultures (HL-60, 5.8% ± 1.7%; HL-DOX, 2.3% ± 0.6%, P = .005).
Bcl-2-AS reduces Bcl-2 protein levels in leukemic cells.
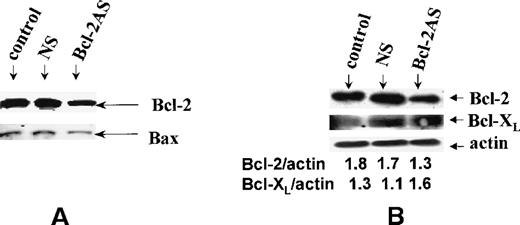
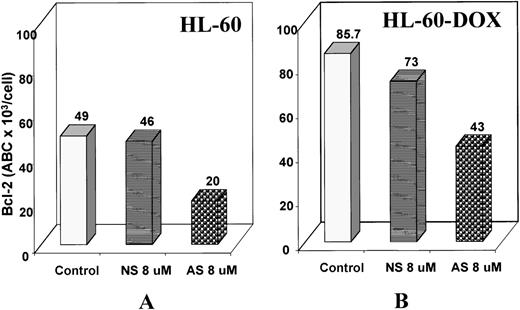
To examine the postulated sequence-specific down-regulation of target protein, we used Western blot analysis and flow cytometry to determine Bcl-2 protein levels after treatment with Bcl-2-AS in leukemic cell lines. Western blot analysis of HL-60 cells after 5 days of treatment with 8 μmol/L Bcl-2-AS (Figure 3A) demonstrated that the Bax protein was equally expressed in treated and untreated cells, whereas expression of the Bcl-2 protein decreased in cells treated with Bcl-2-AS but not in those treated with NS. By flow cytometry, Bcl-2 levels in HL-60 cells decreased slightly on day 3 of incubation with 8 μmol/L Bcl-2-AS and decreased further on day 5 (Figure 4A). Bcl-2 levels were quantitated using microbeads with QuickCal Software and were expressed as antibody-binding capacity (ABC). In HL-60 cells, Bcl-2 expression decreased from 49 × 103 on day 0 to 30 × 103 ABC per cell on day 3, and to 20 × 103 ABC per cell on day 5. In HL-60-DOX cells treated with Bcl-2-AS, Bcl-2 decreased from 85.7 × 10³ on day 0 to 43.4 × 10³ ABC per cell on day 5 (Figure 4B). In cells treated with NS, only an insignificant decrease was observed on day 5 (HL-60, 46 × 103 ABC per cell; HL-60-DOX, 73 × 103 ABC per cell). Importantly, Bcl-2-AS decreased viability and down-regulated Bcl-2 levels in Bcl-XL–-overexpressing HL-DOX cells. Interestingly, an increase in Bcl-XL expression was observed (Figure 3B).
Expression of Bcl-2 in HL-60 cells.
(A) Bcl-2 expression of HL-60 cells after treatment with 8 μmol/L of Bcl-2-AS for 5 days. Although the level of Bax expression is unchanged, Bcl-2 is decreased in cells treated with Bcl-2-AS. (B) Expression of Bcl-2 and Bcl-XL in HL-60-DOX cells by Western blot analysis. Ratios to actin shown were obtained by densitometry.
Effect of Bcl-2-AS on Bcl-2 expression of HL-60 and HL-60-DOX cells.
Bcl-2 protein expression of HL-60 (A) and HL-60-DOX (B) was analyzed by flow cytometry as described above after gating on live cells. The relative channel number was measured from the upper limit of the negative control. The relative channel number of a series of calibrated FITC microbeads having levels of fluorescence intensity ranging from 8.857 × 10³ to 206.086 × 10³antibody-binding capacity (ABC) of equivalent soluble fluorochrome per bead was calculated (FCSC Quantum; Becton Dickinson) and a standard curve constructed. The relative channel number and the antibody-binding capacity per cell for the test samples were calculated using this standard curve. Results demonstrate lower Bcl-2 expression of cells treated with 8 μmol/L of Bcl-2-AS for 5 days.
Bcl-2-AS enhances ara-C induced cytotoxicity.
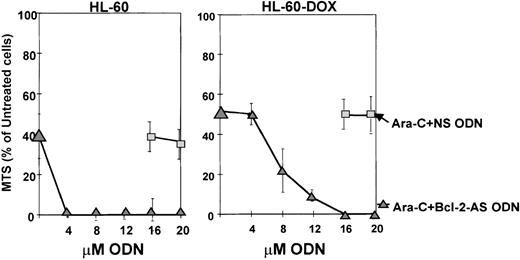
We then evaluated the sensitivity of HL-60 and HL-60-DOX cells to the combination of Bcl-2-AS with ara-C. HL-60 cells were more sensitive to 1 μmol/L ara-C (38.9% ± 4.2 viable cells, MTS assay) than HL-60-DOX cells (51.7% ± 3.5 viable cells). As shown in Figure5, the combination of ara-C with Bcl-2-AS for 72 hours significantly enhanced killing of HL-60 sensitive and resistant cells by Bcl-2-AS. Treatment with NS had no effect on viability, whereas the combination of ara-C and Bcl-2-AS in HL-60 cells significantly reduced the amount of Bcl-2-AS necessary to reach maximal cytotoxicity from 12 to 4 μmol/L. In HL-60-DOX cells with higher baseline levels of Bcl-2, Bcl-2-AS alone was not able to eliminate all viable cells, regardless of the dose. In contrast, the combination of ara-C and Bcl-2-AS exhibited maximal cytotoxicity at 16 μmol/L. NS did not enhance cytotoxicity of ara-C, even at high levels.
Bcl-2-AS increased sensitivity to ara-C in both HL-60 and in HL-60-DOX cells.
Combined effect of Bcl-2-AS and ara-C on the growth of leukemic cell lines was tested using the MTS assay after 72 hours of treatment. Note that higher concentrations of Bcl-2-AS were required in HL-DOX cells because they expressed higher levels of Bcl-2.
Bcl-2-AS reduces viability of AML blasts in vitro.
Effect of Bcl-2-AS on the cell growth of leukemic blasts in vitro was investigated in samples from patients with AML by cell count with trypan blue-dye exclusion. The patients' characteristics are shown in Table 1. In the majority of the patients, a decrease in cell numbers was documented after 5 days of culture in the presence of 8 μmol/L Bcl-2-AS, compared with the number of cells in culture after 5 days without oligodeoxynucleotides (2.3 ± 0.3 × 10⁵ cells/mL vs 3.6 ± 0.4 × 10⁵ cells/mL;P < .001). In contrast, very little toxicity was observed in cultures with NS (3.1 ± 0.3 × 10⁵cells/mL).
Clinical data for patients with acute myeloid leukemia
| N . | Age (y) . | Sex . | Cytogenetic abnormality . | FAB category . | Source % of blasts . | Response . |
|---|---|---|---|---|---|---|
| 1 | 34 | M | Relapsed M0 | Diploid | PB 93% | Failure |
| 2 | 81 | M | M0 | Diploid | BM 80.4% | CR |
| 3 | 46 | F | M1 relapse | Diploid | PB 95% | CR |
| 4 | 73 | M | Sec M4Eo (RA) | Inv16 | BM 46% | Death during induction |
| 5 | 62 | M | M0 | Diploid | BM 95% | CR |
| 6 | 70 | F | Sec M2 (MDS) | −5, −7, del7 | BM 81.3% | Resistant |
| 7 | 66 | M | Sec AML (CT for leiomyosarcoma) | t(9;11) | BM 89% | CR |
| 8 | 72 | M | Sec M2 (CT for prostate Ca) | Diploid | BM 84% | CR |
| 9 | 72 | M | MDS-AML M4 | Del 5q | BM 65% | No follow-up |
| 10 | 73 | M | Sec M1 (prostate Ca) | Diploid | PB 59% | Primary resistant |
| 11 | 75 | M | M4Eo | Inv16 | BM 40.8% | Failure |
| 12 | 49 | F | M1 relapse | Diploid | BM 90.4% | Primary resistant |
| 13 | 49 | F | Sec M4 (breast Ca) | Diploid | BM 56% | CR |
| 14 | 22 | F | M1 | Iso17Q,10Q | BM 90% | CR |
| 15 | 45 | F | M4 | t(1;16), t(2;3) | BM 64% | CR |
| 16 | 32 | M | 2d relapse M0 | Diploid | BM 70.4% | CR |
| 17 | 75 | M | M4Eos | +8, inv16 | BM 72% | CR |
| 18 | 59 | F | M2 | Diploid | BM 86% | Failure |
| 19 | 82 | M | Sec M1 (MDS) | Diploid | BM 81% | Refused treatment |
FAB, French-American-British classification; PB, peripheral blood; BM, bone marrow; CR, complete remission; sec, secondary; RA, refractory anemia; inv16, inversion 16; MDS, myelodysplastic syndrome; AML, acute myeloid leukemia; CT, chemotherapy; Ca, carcinoma; del, deletion; iso17q, isochromosome 17q.
Bcl-2-AS induces apoptosis in primary AML samples.
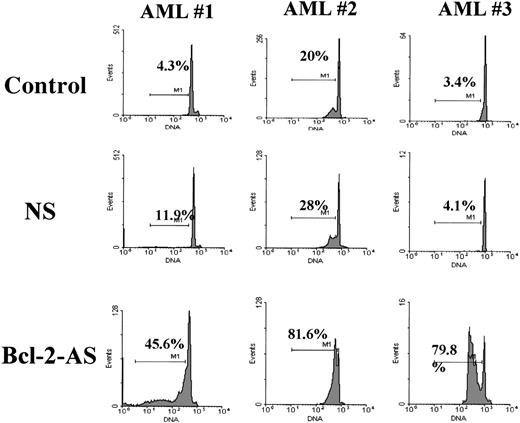
We examined the effect of Bcl-2-AS on the induction of apoptosis in leukemic cells using flow cytometry to determine the apoptotic “sub G1” cells by staining with acridine orange. Examples of flow cytometric results are represented in Figure6.
Flow cytometric determination of apoptosis induced by Bcl-2-AS in primary AML cells.
AML blasts were incubated in the presence of 8 μmol/L of Bcl-2-AS for 5 days as described in “Materials and methods.” Detection of apoptotic cells (cells in the subG1 region) was based on DNA fragmentation.
Flow cytometric determination of apoptosis induced by Bcl-2-AS in primary AML cells.
AML blasts were incubated in the presence of 8 μmol/L of Bcl-2-AS for 5 days as described in “Materials and methods.” Detection of apoptotic cells (cells in the subG1 region) was based on DNA fragmentation.
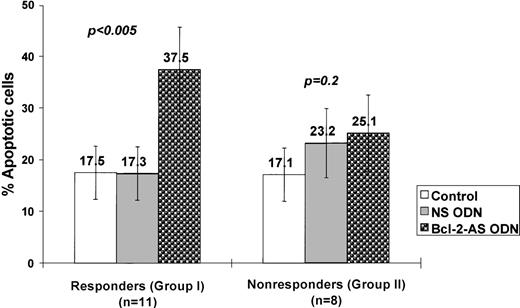
No significant increase in apoptosis was identified after treatment with NS compared with spontaneous apoptosis in control cultures (18.6% ± 4.5% vs 15.1% ± 4.3%; P = .1). Treatment of AML blasts with Bcl-2-AS caused a significant induction of apoptosis in a dose-dependent fashion in 11 of 19 patient samples (57.9%). Overall, 27.3% ± 6.3% of apoptotic cells were detected at a concentration of 4 μmol/L Bcl-2-AS, and 37.0% ± 8.6% at 8 μmol/L (P < .05). Two groups of samples could readily be separated: those that had an apoptotic response to Bcl-2-AS (group I), and those that did not (group II). In samples that responded (group I, n = 11), we detected 37.5% ± 8.2% apoptotic cells in cultures with 8 μmol/L Bcl-2-AS, compared with the percentage of apoptotic cells in cultures with 8 μmol/L NS (17.3% ± 5.2%) and control cultures (17.5% ± 5.2%; P < .005) (Figure7). In 8 of 19 patient samples (42.1%, group II), an equal percentage of apoptotic cells was observed in cultures treated with Bcl-2-AS (25.1% ± 7.4%) and NS (23.2 ± 6.7; P = .2). In group I samples, cell numbers in cultures treated with Bcl-2-AS (1.8 ± 0.3 × 10⁵) were also lower than in group II samples (2.7 ± 0.4).
Induction of apoptosis by Bcl-2-AS in primary AML cells.
AML cells were treated with 8 μmol/L of Bcl-2-AS for 5 days as described in “Materials and methods.” Results are represented as mean ± SEM of the percentage of apoptotic cells in responsive (group I) and nonresponsive (group II) AML blasts after treatment with Bcl-2-AS.
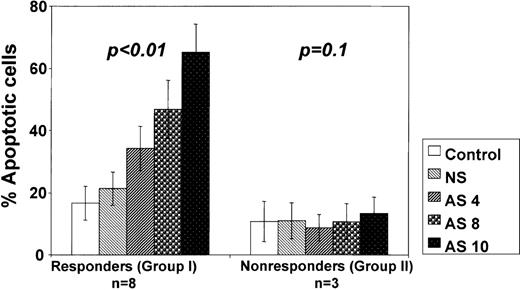
We then analyzed the relationship between the amount of Bcl-2-AS used and the ability to induce apoptosis. In 8 samples from group I, increasing concentrations of Bcl-2-AS resulted in a dose-dependent increase in the percentage of apoptotic cells, reaching 65.3% ± 9.1% at 10 μmol/L Bcl-2-AS (P < .01) (Figure 8). However, in 3 samples of group II, no apoptosis was induced even at 12 μmol/L Bcl-2-AS.
Bcl-2-AS induced dose-dependent apoptosis in primary AML in vitro.
Results are represented as mean ± SE of mean of the percentage of apoptotic cells in responsive (group I) and nonresponsive (group II) AML blasts after treatment with indicated concentrations of Bcl-2-AS.
Bcl-2-AS induced dose-dependent apoptosis in primary AML in vitro.
Results are represented as mean ± SE of mean of the percentage of apoptotic cells in responsive (group I) and nonresponsive (group II) AML blasts after treatment with indicated concentrations of Bcl-2-AS.
Bcl-2-AS increases proliferation of AML blasts.
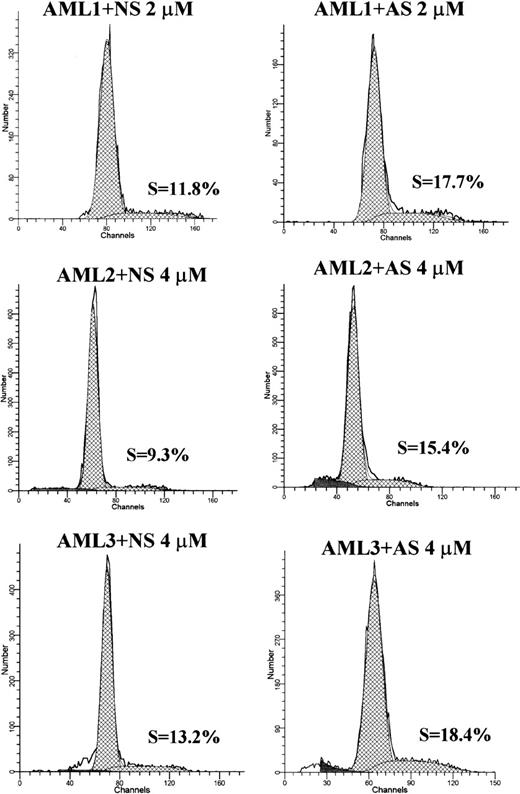
To investigate the potential effect of Bcl-2-AS on proliferation of leukemic cells, we performed cell cycle analysis of AML blasts treated with different concentrations of Bcl-2-AS. In 5 of 6 cases, we observed an increase in the percentage of S-phase cells after treatment with low concentrations of Bcl-2-AS (4 samples: 4 μmol/L; 1 sample: 2 μmol/L) (Table 2). In 5 of 6 samples, increases in cells in S-phase were observed. For the entire group, the increase was significant (P = .04). No significant change in the percentage of cells in G2M was observed. At higher concentrations of Bcl-2-AS that induced apoptotic changes in leukemic cells, no cell cycle effect was observed (data not shown). Representative examples of DNA histograms are shown in Figure9.
Effect of Bcl-2-AS on cell proliferation of primary acute myeloid leukemia in vitro
| . | S-phase cells (%) . | |
|---|---|---|
| Bcl-2-AS . | NS . | |
| AML 1 | 17.7 | 11.8 |
| AML 2 | 18.4 | 13.2 |
| AML 3 | 15.4 | 9.3 |
| AML 4 | 17.2 | 13.3 |
| AML 5 | 3.1 | 1.7 |
| AML 6 | 2.4 | 4.5 |
| P-value | 0.04 | |
| . | S-phase cells (%) . | |
|---|---|---|
| Bcl-2-AS . | NS . | |
| AML 1 | 17.7 | 11.8 |
| AML 2 | 18.4 | 13.2 |
| AML 3 | 15.4 | 9.3 |
| AML 4 | 17.2 | 13.3 |
| AML 5 | 3.1 | 1.7 |
| AML 6 | 2.4 | 4.5 |
| P-value | 0.04 | |
AML, acute myeloid leukemia; Bcl-2-AS, Bcl-2 antisense oligodeoxynucleotides; NS, nonsense oligodeozynucleotides.
The percentage of cells in S-phase of the cell cycle was analyzed using the ModFit program after acridine orange staining. In 5 of 6 samples analyzed, S-phase increased.
DNA histograms of Bcl-2-AS- or NS-treated leukemic cells from 3 AML samples.
Cellular DNA content was measured by acridine orange as described in “Materials and methods.” The curve fitting software (ModFit) allowed the determination of the percentage of cells in different phases of cell cycle. In all samples shown, S-phase increased in Bcl-2-AS–treated samples, compared with NS controls.
Bcl-2-AS inhibits colony-formation ability of AML blasts.
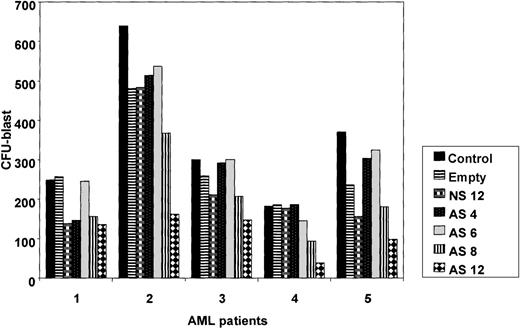
To determine the effect of Bcl-2-AS on myeloid progenitor cells, we studied the colony-forming ability of leukemic blasts from 5 patients with newly diagnosed AML in which the blast count was in excess of 80% (before density gradient separation). Results demonstrated that in 4 of the 5 patient samples, treatment with Bcl-2-AS significantly (P = .01) inhibited the growth of AML colony-forming cells at 8 and 12 μmol/L (Figure 10). NS at the highest concentration (12 μmol/L) and empty liposomes had no statistically significant effect on the colony-forming capacity of AML progenitors.
Influence of Bcl-2-AS on myeloid leukemia clonogenic progenitor growth of primary AML cells.
Data represent average results from 5 different samples. Results are expressed as mean ± SEM of the number of colonies in the presence of increasing concentrations of Bcl-2-AS (4, 6, 8, and 12 μmol/L), compared with control cells or cells treated with nonsense (12 μmol/L) or empty liposomes. Asterisk (*) indicates significance atP < .05. EL, empty liposomes.
We observed significant toxicity of empty liposomes and of 12 μmol/L NS in the CFU assays for normal CD34+ cells, with the highest concentration of Bcl-2-AS being slightly more inhibitory than NS (control 357 ± 73, empty liposomes 200 ± 88, NS 138 ± 58, Bcl-2-AS 104 ± 74 CFU-GM colonies,P > .5). Likewise, at 6 μmol/L, no significant difference was found in the number of CFU-GMs after treatment with Bcl-2-AS, compared with NS (NS 227 ± 73, Bcl-2-AS 257 ± 81 CFU-GM colonies).
Reduction of Bcl-2 expression in acute myeloid leukemia progenitor cells by Bcl-2-AS
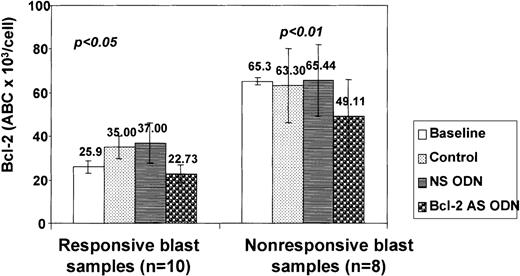
CD34+ AML blasts from 14 patients were studied using flow cytometry to determine Bcl-2 levels before and after exposure to Bcl-2-AS. Baseline Bcl-2 content showed a significant degree of variability ranging from 10.7 × 10³ to 155.1 × 10³ ABC per cell (mean, 43.4 ± 8.3 × 10³ ABC per cell). In all except 1 sample, a decrease in Bcl-2 levels was observed after 5 days of incubation with 8 μmol/L Bcl-2-AS, compared with control (untreated) and NS-treated cultures. In 4 of 18 primary AML samples, increased Bcl-2 expression was noted in control cultures, compared with baseline (preculture) levels. The calculated mean antibody-binding capacity was significantly lower in CD34+ blasts treated with Bcl-2-AS (34.9 ± 7.8 × 10³ ABC per cell) compared with control cells (47.1 ± 8.4 × 10³ ABC per cell) or those treated with NS (53.5 ± 8.6 × 10³ABC per cell) (P < .01) (Figure11). The mean decrease in Bcl-2 levels in CD34+ blasts treated with Bcl-2-AS was not different in samples in which a response in vitro was observed (11.4 ± 2.4 × 10³ ABC per cell) from that in group II samples without response (16.3 ± 3.1 × 10³ ABC per cell;P = .1). However, the baseline Bcl-2 levels in leukemic progenitors of group II samples were significantly higher than those in group I cells: 65.3 ± 15.4 × 10³ versus 25.9 ± 2.9 × 10³ ABC per CD34 cell (P = .01). Regression analysis demonstrated an inverse correlation between baseline Bcl-2 protein levels and viability after treatment with Bcl-2-AS (R2 = 0.4,P = .01).
Decrease of Bcl-2 expression in AML cells after treatment with Bcl-2-AS.
Bcl-2 expression was determined by quantitative flow cytometry as described in “Materials and methods” after gating on live cells. Results are represented as mean ± SEM of the ABC of sensitive (responsive) and resistant (nonresponsive) cells at baseline (preculture) and after treatment with Bcl-2-AS, NS, and in control cultures without ODNs. In both types of cells, 8 μmol/L of Bcl-2-AS caused a significant (P < .05) decrease in Bcl-2 expression.
Inhibition of Bcl-2 expression increases the cytotoxicity of ara-C in sensitive AML cells.
We next examined the sensitivity of AML blasts treated with Bcl-2-AS to the cytotoxic drug ara-C. AML blasts from 13 patients were simultaneously treated with 1 μmol/L ara-C and 8 μmol/L Bcl-2-AS for 72 hours and analyzed for apoptosis by DNA content (Table3). Ara-C in the presence of Bcl-2-AS significantly increased apoptosis in all samples that were responsive to treatment with Bcl-2-AS alone (P < .05). No significant difference was seen in blasts cultured with ara-C alone or cultured with ara-C and NS (P > .4). Interestingly, in these samples, Bcl-2-AS induced the same degree of apoptosis as ara-C alone (43.8% ± 8.1% vs 42.3% ± 5.8%, respectively). In Bcl-2-AS nonresponsive blasts, Bcl-2-AS sensitized leukemic cells to ara-C treatment in only 1 of 6 samples. Finally, the level of Bcl-2 expression did not change in responsive or nonresponsive blasts after the addition of ara-C (Table 3).
Bcl-2-AS increases apoptosis induced by ara-C
| Samples . | Subdiploid apoptotic cells (%) . | Bcl-2 expression (×103 ABC per cell) . | ||||
|---|---|---|---|---|---|---|
| Control . | NS . | Bcl-2-AS . | Control . | NS . | Bcl-2-AS . | |
| Responsive blasts (N = 7) | ||||||
| No ara-C | 18.5 ± 5.6 | 26.9 ± 6.6 | 43.8 ± 8.1 | 23.7 ± 7.8 | 25.7 ± 5.4 | 16.7 ± 5.5 |
| Ara-C | 42.3 ± 5.8 | 42.6 ± 5.8 | 61.7 ± 7.0 | 30.4 ± 7.1 | 29.2 ± 8.1 | 13.5 ± 3.0 |
| Nonresponsive blasts (N = 6) | ||||||
| No ara-C | 20.5 ± 5.7 | 18.9 ± 5.4 | 20.5 ± 5.7 | 49.2 ± 9.9 | 53.0 ± 6.2 | 35.3 ± 6.7 |
| Ara-C | 46.4 ± 11.2 | 42.5 ± 11.0 | 42.3 ± 11.6 | 42.8 ± 5.8 | 44.6 ± 6.3 | 36.3 ± 4.5 |
Bcl-2-AS, Bcl-2 antisense oligodeoxynucleotides; ABC, antibody-binding capacity; NS, nonsense oligodeoxynucleotides.
The percentage of apoptotic cells was determined using flow cytometry of acridine orange staining as described in “Materials and methods.” The combination of Bcl-2-AS with 1 μmol/L ara-C significantly (P < .05) enhanced ara-C induced apoptosis in responsive blast samples but not in nonresponsive blast samples after 72 hours of treatment. The level of Bcl-2 expression in AML cells treated with Bcl-2-AS or NS did not change significantly when ara-C was added. All measurements of the Bcl-2 expression were analyzed after appropriate gating on live CD34+ AML cells.
Bcl-2-AS induces apoptosis in primary AML in the presence of other antiapoptotic genes.
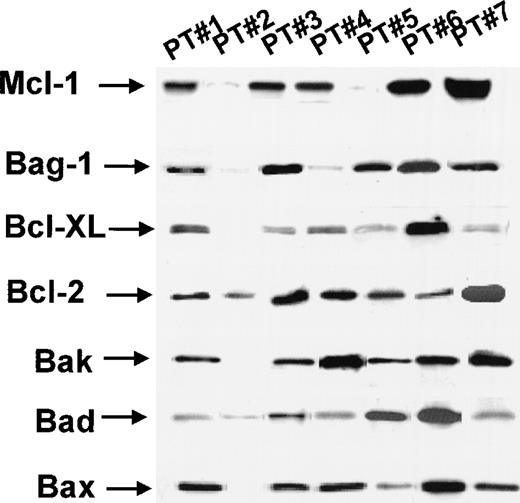
As shown in Table 4, several other proapoptotic and antiapoptotic genes were found to be expressed in the AML samples tested. Besides Bcl-2, the antiapoptotic genesBcl-XL, Bag1, A1 andMcl-1 were expressed as determined by Western blot analysis, at various levels, in 5 of 6 samples studied (Figure12). By RT-PCR, all AML samples (10 of 10) tested expressed these antiapoptotic proteins (data not shown). This was also true when the samples sensitive to the induction of apoptosis by Bcl-2-AS (group I) were analyzed separately: Antiapoptotic genes were expressed in 6 of 6 samples by RT-PCR and in 3 of 4 samples by Western blot analysis (Table 4).
Expression of Bcl-2 family members in primary acute myeloid leukemia treated with Bcl-2-AS by Western blot analysis
| . | Bcl-2-AS sensitive (group I) (N = 4) . | Bcl-2-AS resistant (group II) (N = 2) . |
|---|---|---|
| Anti | ||
| Bcl-XL | 3/4 | 2/2 |
| Bag-1 | 4/4 | 2/2 |
| A1 | 4/4 | 2/2 |
| Mcl-1 | 1/1 | 1/1 |
| Pro | ||
| Bax | 4/4 | 2/2 |
| Bad | 4/4 | 1/2 |
| Bak | 3/4 | 2/2 |
| . | Bcl-2-AS sensitive (group I) (N = 4) . | Bcl-2-AS resistant (group II) (N = 2) . |
|---|---|---|
| Anti | ||
| Bcl-XL | 3/4 | 2/2 |
| Bag-1 | 4/4 | 2/2 |
| A1 | 4/4 | 2/2 |
| Mcl-1 | 1/1 | 1/1 |
| Pro | ||
| Bax | 4/4 | 2/2 |
| Bad | 4/4 | 1/2 |
| Bak | 3/4 | 2/2 |
Bcl-2-AS, Bcl-2 antisense oligodeoxynucleotides.
Expression of anti- (Bcl-XL, Bag-1, A1, Mcl-1) and pro- (Bad, Bak, Bax) apoptotic members of Bcl-2 protein family was analyzed by Western blot analysis as described in “Materials and methods.” The results are presented as the number of positive samples.
Expression of Bcl-2 family proteins in AML by Western blot analysis.
For details, see “Results.”
Expression of Bcl-2 family proteins in AML by Western blot analysis.
For details, see “Results.”
In vitro response to Bcl-2-AS correlates with response to chemotherapy in vivo.
We then compared the ability to induce apoptosis in AML cells cultured in vitro with Bcl-2-AS with the response to induction chemotherapy in patients. All patients were treated with high-dose ara-C in combination with idarubicin or topotecan on University of Texas M. D. Anderson Cancer Center protocols. Complete remissions were achieved in 7 of 9 patients whose blasts responded in vitro to Bcl-2-AS, but only in 2 of 7 patients whose blasts did not respond to Bcl-2-AS (P = .04). No correlation with percentage of blast cells or cytogenetics was found.
Discussion
The emergence of resistance to chemotherapeutic agents remains a major problem in the treatment of AML, despite the fact that patients usually have a good initial response to chemotherapy. The Bcl-2 protein can block apoptosis by most chemotherapeutic agents,6,51and has been found to be expressed at high levels in AML blasts capable of autonomous growth in vitro.52 Our own data indicate that virtually all AML samples express Bcl-2.53 This ubiquitous expression of Bcl-2 in AML cells may be an important survival factor for those cells. Several studies, including our own, have identified Bcl-2 levels as prognostic in AML.10-14,53,54 The prognostic impact depends on the cytogenetic abnormalities of the AMLs studied.53 An earlier study by Keith et al29demonstrated induction of apoptosis by Bcl-2-AS in vitro in fresh AML samples as well as increased chemosensitivity to ara-C. However, they reported decreased levels of Bcl-2 expression after Bcl-2-AS in fewer than 50% of the samples studied. This was thought to be related to the poor bioavailability of the phosphorothioate oligonucleotides used.29 In this study, we studied the induction of apoptosis in AML by quantitating cellular Bcl-2 levels before and after Bcl-2-AS and by also determining other antiapoptotic proteins. We also investigated mechanisms of resistance of leukemic cells to Bcl-2-AS.
As a model, we used 2 myeloid leukemic cell lines with different levels of Bcl-2 expression. In both cell lines tested, Bcl-2-AS was able to decrease cell viability and to induce apoptosis after a decrease in the level of Bcl-2 expression. HL-60-DOX cells, which express high levels of Bcl-2, required higher concentrations of Bcl-2-AS to achieve toxicity equivalent to that achieved in HL-60 cells. No substantial toxicity was observed in cells treated with NS or empty liposomes. Remarkably, down-regulation of Bcl-2 resulted in decreased cell survival despite overexpression of antiapoptotic Bcl-XL(and MDR-1) in this cell line.37 Bcl-2-AS also potentiated ara-C-induced cytotoxicity in both cell lines, resulting in complete cell kill in cells resistant to ara-C alone.
In primary AML samples, liposomal Bcl-2-AS significantly reduced Bcl-2 expression in all except 1 sample studied at a concentration of 8 μmol/L, which was found to be effective in the resistant cell line HL-60-DOX. Viability decreased and apoptosis was induced in 11 of 19 patient samples (57.9%). Bcl-2-AS also inhibited the colony-forming ability of AML blasts in 4 of 5 patient samples tested when used at 8 or 12 μmol/L. None or very little nonspecific toxicity was observed after in vitro treatment with control (NS) or with empty liposomes. In the resistant samples, Bcl-2-AS led to an identical decrease in the level of Bcl-2 expression as that found in nonresistant samples (11.4 ± 2.4 × 10³ ABC per cell and 16.3 ± 3.1 × 10³ ABC per cell, respectively) (P = .1), but had no effect on cell viability. In these samples, the baseline levels of Bcl-2 were strikingly higher than in the sensitive samples. Regression analysis revealed an inverse correlation between baseline levels of Bcl-2 protein expression and viability of primary AML cells after treatment with Bcl-2-AS. Only in samples with low levels of Bcl-2 expression was Bcl-2-AS able to sensitize AML blasts to ara-C. These results suggest that there is a critical threshold for Bcl-2 above which it supports the spontaneous survival of leukemic cells, prevents apoptosis, and protects from ara-C toxicity. The finding that induction chemotherapy resulted in remissions in 7 of 9 patients whose cells were susceptible to Bcl-2-AS apoptosis but failed in 5 of 7 patients in the Bcl-2-AS– resistant group II, suggests the possibility that similar mechanisms might be operational in vitro and in vivo. In Bcl-2-AS–resistant leukemias, Bcl-2 would act as a survival factor for disease and prevent achievement of complete remission. In patients with lower baseline levels of Bcl-2, down-regulation by Bcl-2-AS–induced apoptosis. These patients would most likely benefit from the clinical use of Bcl-2-AS. Interestingly, in 2 patients who failed to respond to induction chemotherapy, Bcl-2-AS induced apoptosis in vitro, therefore overcoming other drug-resistance mechanisms such as overexpression of other antiapoptotic genes. Many other resistance factors are known in AML and in AML cell lines. HL-60-DOX cells not only express high levels of Bcl-2, but also Bcl-XL.37 Using complementary DNA (cDNA) technology, we have recently identified 29 genes that are overexpressed in HL-60-DOX, compared with HL-60 cells.55Many of these are associated with drug resistance. Analysis of the primary samples tested here by RT-PCR and Western blot demonstrated expression of several antiapoptotic genes, includingBcl-XL, A1, Bag-1, andMcl-1. We have also recently shown that antiapoptotic IAP family members are expressed in primary AML samples including IAP1, IAP2, NAIP, and in particular XIAP, which was expressed at high levels in 100% of samples examined.56 The ability of Bcl-2-AS to induce apoptosis in these cells is remarkable and points to the crucial role of this protein for their survival. Interestingly, after Bcl-2-AS, increased expression of Bcl-XL was observed in HL-DOX cells. In cases resistant to the effect of Bcl-2-AS alone, targeting multiple mechanisms of resistance might be necessary to induce cell death. Antiapoptotic protein Bcl-XL that is highly expressed in AML57 is associated with autonomous growth in vitro and with P-glycoprotein expression.34 The ratio of Bcl-XS to Bcl-XL is different in good- and poor-prognosis subsets of acute myeloid leukemia.35 Thus, down-regulation of both Bcl-2 and Bcl-XL could be beneficial for these patients. In mdr-1–expressing AML, a strategy of combining Bcl-2-AS with mdr-1 blockers might be effective.
Our data indicate that down-regulation of Bcl-2 induces apoptosis in leukemia cell lines and in primary AML samples with low baseline levels of Bcl-2 expression. Recent evidence suggests that low levels of Bcl-2 expression in AML patients with poor-prognosis cytogenetics is associated with decreased survival.53 This appears to violate the dogma that high levels of Bcl-2 protect cells from chemotherapy-induced apoptosis. Likewise, low levels of Bcl-2 were shown to be a poor prognostic factor in patients with breast, lung, and colon cancer.58-61 These findings are presumably associated with the evolving concept of an antiproliferative effect of high levels of Bcl-2 expression. In this context, high Bcl-2 expression would delay relapse or regrowth of tumor cells by virtue of their lower proliferative activity. Although proliferating cells with lower Bcl-2 expression may be more sensitive to chemotherapy or radiotherapy, those with high Bcl-2 expression would regrow at a slower rate. The down-regulation of Bcl-2 could counteract the antiproliferative function of Bcl-2, increase cell proliferation, and therefore facilitate killing by cell-cycle–dependent drugs. In a clinical trial with all-trans retinoic acid in acute promyelocytic leukemia, we noted that the proliferation of leukemic cells was indeed temporarily increased.62 This effect was presumably the result of down-regulation and/or phosphorylation of Bcl-2 by all-trans retinoic acid. In our experiments, low doses of Bcl-2-AS recruited leukemic cells into the S phase of the cell cycle in 5 of 6 AML samples tested. Perhaps down-regulation of Bcl-2 first blocks its antiproliferative effect, followed by induction of cell death. In favor of this hypothesis was the finding that in 3 of 6 AML samples in which Bcl-2-AS increased the number of S-phase cells, apoptosis was not induced. At higher concentrations of Bcl-2-AS, induction of cell death with concomitant decrease of the proliferative fraction was observed. Therefore, Bcl-2-AS could sensitize leukemic cells by both enhanced apoptosis and recruitment into the cell cycle.
In conclusion, results indicate that the administration of Bcl-2-AS in vivo in patients with AML whose blast cells express low levels of Bcl-2 could generate targets with differential sensitivity to chemotherapy. Experiments in AML NOD-SCID model are underway to test whether Bcl-2-AS affects SCID-repopulating AML cells. It is known that the earliest normal hematopoietic progenitors do not express Bcl-2 but instead express high levels of Bcl-XL.21;22 The first human clinical trial of Bcl-2 antisense phosphorothioate ODN in patients with recurrent non-Hodgkin lymphomas showed few side effects and clinical responses in some patients.25 Also, sensitization to chemotherapy previously found to be ineffective was observed in 6 of 8 patients. Hence, the elucidation of the molecular mechanisms of action of Bcl-2 may create the basis for the therapeutic correction of this disease-mediated dysfunction of cell death control.
Supported by grants from NIH CA 55164, CA 49639, CA 16672, a grant from Gabriella Rich Leukemia Fund to G.L.B. and the Stringer Professorship for Cancer Treatment and Research to M.A.
Reprints:Michael Andreeff, Section of Molecular Hematology and Therapy, The University of Texas M. D. Anderson Cancer Center, 1515 Holcombe Blvd, Box 81, Houston, TX 77030; e-mail:mandreef@notes.mdacc.tmc.edu.
The publication costs of this article were defrayed in part by page charge payment. Therefore, and solely to indicate this fact, this article is hereby marked “advertisement” in accordance with 18 U.S.C. section 1734.


This feature is available to Subscribers Only
Sign In or Create an Account Close Modal