We have identified a novel regulatory erythroid kinase (REDK) that is homologous to a family of dual-specificity kinases. The yeast homolog of REDK negatively regulates cell division, suggesting a similar function for REDK, which is primarily localized in the nucleus. REDK is present in hematopoietic tissues, such as bone marrow and fetal liver, but the RNA is expressed at significant levels only in erythroid or erythropoietin (EPO)-responsive cells. Two novel forms of cDNA (long and short) for REDK have been isolated that appear to be alternative splice products and imply the presence of polypeptides with differing amino termini. The ratio of short-to-long forms of REDK increases dramatically in CD34+ cells cultured with EPO, suggesting differing regulation and function for each form. REDK is predominantly found in nuclear, rather than cytoplasmic, protein extracts, and immunoprecipitated REDK is active in phosphorylating histones H2b, H3, myelin basic protein, and other coimmunoprecipitated proteins. Antisense REDK oligonucleotides promote erythroid colony formation by human bone marrow cells, without affecting colony-forming unit (CFU)-GM, CFU-G, or CFU-GEMM numbers. Maximal numbers of CFU-E and burst-forming unit–erythroid were increased, and CFU-E displayed increased sensitivity to suboptimal EPO concentrations. The data indicate that REDK acts as a brake to retard erythropoiesis.
Hematopoietic cells develop continuously from primitive multipotential stem cells to committed progenitor cells of various lineages. Through rounds of multiplication, progenitor cells generate amplified numbers of immature cells that can then develop into mature, differentiated cells required for hematopoietic and immune functions. This continual developmental process depends on balances between proliferation, differentiation, and apoptosis to maintain the proper numbers of functional cells in each lineage. Numerous lineage-restricted factors have been identified, such as GATA-1,1 FOG1,2,3 GATA-2,4tal-1,5-7 PU.1,8,9 and NF-E2,10that mediate decision points for proliferation, survival, or differentiation. The nature of other controlling factors, however, remains largely undefined.
For erythropoiesis, subsets of transcription factors and hematopoietic growth factors have been defined as important mediators. Critical transcription factors include GATA-1, FOG1, tal-1, and EKLF, the function of which can be modulated by interactions with other proteins2,11-14 and by phosphorylation15-17or other posttranslational modifications.18 GATA-1 has been shown to be an essential regulator of progenitor determination,1 and it contributes to the survival and continuing development of erythroid cells.19-21 In fact, there is evidence that the relative levels of GATA-1 and GATA-2 are important.22,23 Other regulators of erythroid determination remain to be discovered. Important hematopoietic growth factors include erythropoietin (EPO), interleukin (IL)-3, granulocyte macrophage–colony-stimulating factor (GM-CSF), and SCF. Blast-forming unit–erythroid (BFU-E) is the earliest erythroid lineage-specific progenitor, though it is not responsive to EPO.24,25 EPO responsiveness is gained only on further maturation to colony-forming unit (CFU)–erythroid (E) stage.25,26 However, EPO is not required for final maturation of red blood cells,27 even though it is necessary for the terminal differentiation and survival of erythroid cells.26 28
In this report we describe a novel human nuclear kinase that is predominantly expressed in erythroid cells and that functions in erythroid growth, differentiation, or both. Regulatory erythroid kinase (REDK) is related to a recently recognized subfamily of dual-specificity protein kinases consisting of homologs from yeast (Yak1p), slime mold (YakA), insects (mnb), and mammals (DYRK paralogs).29-33 The ability of genetically related kinases in other species to negatively regulate cell growth and the data reported here suggest that REDK may have a role in the erythroid cell's decision to exit the cell cycle and to commit to terminal differentiation.
Materials and methods
Cloning of human REDK
The SmithKline Beecham cDNA database was searched for expressed sequence tags with homology to Yak1 (accession no. A32582) using the FASTA algorithm of the University of Wisconsin GCG software package. A partial cDNA clone (HTEGA28) sharing homology with Yak1p from yeast was identified and sequenced. To obtain the full-length cDNA, the insert of this partial clone was used as a probe to screen 106 plaques from a human testis and a skeletal muscle cDNA library (Clontech, Palo Alto, CA) as described elsewhere.34 The probe was α-32P labeled using a random primed labeling kit (Boehringer Mannheim, Indianapolis, IN) and was purified using Sephadex G-50 columns (Pharmacia Biotech, Piscataway, NJ). Several positive clones were isolated from each library by plaque purification and sequenced. The longest insert obtained from the skeletal muscle and testis libraries measured 2.1 kb and 2.3 kb, respectively. Each cDNA was subject to double-strand sequencing using an ABI sequencer (Perkin Elmer, Foster City, CA).
Plasmid construction
Short and long forms of REDK cDNA were amplified with gene-specific primers and cloned into a shuttle vector to generate an N-terminal tag containing the T7 epitope (Novagen, Madison, WI), 6 histidines, and a Factor Xa cleavage site. Each form was then subcloned with the T7-(his)6-FactorX tag as aBamH1–Bgl2 fragment into the BamH1 site of pCDNxab.35 A kinase-dead mutant of REDK-L was made by changing lysine 228 to an arginine using the QuikChange site-directed mutagenesis kit (Stratagene, La Jolla, CA). All amplified products were sequence confirmed.
Coupled in vitro transcription/translation was performed with commercial components (TnT; Promega, Madison, WI) according to the manufacturer's instructions. The REDK cDNA was cloned into pBluescript that had been engineered with an N-terminal T7-(his)6 tag for T7 RNA polymerase expression.
Cell culture
Human bone marrow cells from normal donors (obtained by informed consent) were washed with phosphate-buffered saline (PBS), overlaid on 1-Step 1.077 g/mL density medium (Accurate Scientific, Westbury, NY), and separated by density-gradient centrifugation at 4°C. Low-density cells were collected at the interface after centrifugation and were washed extensively in PBS. Low-density marrow cells were adjusted to 3.3 × 10⁶ cells/mL in PBS after lysis of red blood cells in 0.9% NH4Cl, pH 7.0. Cells were seeded at 5 to 8 × 10⁵/mL in Iscove's modified essential medium (IMEM) containing 20% heat-inactivated fetal bovine serum and cultured at 37°C, 5% CO2. Recombinant human growth factors used were stem cell factor, thrombopoietin, GM-CSF, IL-3 (R&D Systems, Minneapolis, MN); Epogen (EPO) and Neupogen (G-CSF) (Amgen, Thousand Oaks, CA); and flt3 ligand (Genzyme, Cambridge, MA). UT7-EPO and TF1 cells were maintained in IMEM/10% fetal bovine serum (FBS) with 0.4 U/mL EPO and RPMI 1640/10% FBS with 2 ng/mL GM-CSF (Hanna Pharmaceutical Supply, Wilmington, DE), respectively. CD34+ cells were isolated by immunomagnetic separation according to the manufacturer's directions (Miltenyi, Auburn, CA). Two rounds of purification resulted in greater than 95% CD34+cells as determined by flow cytometry.
UT7-EPO cells36 were maintained in IMEM/10%FBS containing 0.4 U/mL EPO. Constructs encoding both REDK-long (REDK-L) and REDK-short (REDK-S) and the K228R kinase-dead mutant (KD-REDK) forms were transfected by electroporation, stable cell lines were selected in G418 (Gibco Life Technologies, Gaithersburg, MD), and clones were isolated by limiting dilution.
Antisense oligonucleotides and colony-forming assays
Bone marrow cells were incubated for 6 hours at 37°C in PBS containing 50 ng/mL stem cell factor (SCF) and 10 μmol/L phosphorothioate oligonucleotides, which were synthesized with 2 terminal phosphorothioate linkages (lowercase) purified by high-performance liquid chromatography and gel filtration (Synthegen, Houston, TX) and were resuspended in sterile distilled water before use. The oligonucleotides tested were REDK sense (S223 5′-gtT GGG GGA TGG TGT CTA Tga C), REDK antisense (AS244 5′-caT AGA CAC CAT CCC CCa aC), and sequences specific for REDK-L (AS155 5′-tgC CTC CCA TCT CCT AGc tC) and REDK-S (AS480 5′-ccA CTT CAT TTT CTG GTG GAt gG). Mutant oligonucleotides contained 1 (AS480M1 5′-ccA CTT CAT TTT CTG GTG GAt gG) or 2 (AS480M2 5′-ccA CTT CAT TTT CTG GTG GAt gG) point mutations. After incubation with oligonucleotides and SCF, cells were diluted into MethoCult medium (StemCell Technologies, Vancouver, Canada) containing either a mixture of hematopoietic growth factors (SCF, IL-3, IL-6, EPO, GM-CSF, G-CSF) or a medium supplemented with EPO, G-CSF, or GM-CSF (R&D Systems) alone and dispensed onto 12-well plates. Colonies were scored after 7 days (CFU-E, CFU-G) and 14 days (CFU-GM, BFU-E, CFU-GEMM) of incubation in lowered O2 (5%) and 7.5% CO2 in a humidified environment. Erythroid colonies were identified on the basis of size and color (distinctively red). Three plates were scored per determinant. Statistical differences in colony growth were determined by t test (P < .05).
Blots and hybridizations
RNA was extracted using the RNeasy kit (Qiagen, Chatsworth, CA) and affinity chromatography over oligo-dT cellulose (Pharmacia Biotech) for isolation of polyA + RNA, or it was purchased (Clontech). Northern blots were prepared by electrophoresing total RNA (10 μg/lane) in denaturing formaldehyde/agarose gels, vacuum blotting to nylon, and ultraviolet light cross-linking, or they were purchased from Clontech (multiple-tissue Northern blots). Slot blots were prepared with a vacuum manifold and diluted polyA + RNA obtained from cell lines or tissues. Northern and slot blot hybridizations were carried out in 6× SSC, 1% sodium dodecyl sulfate (SDS), and 10% dextran sulfate at 65°C. A 0.8-kb REDK cDNA fragment (allowing equivalent detection of long and short REDK mRNA) and a 1.2-kb DYRK2 cDNA fragment were labeled using random hexamers and α-32P-dATP as probes. Blots were exposed to phosphor storage screens and scanned for analysis.
Reverse transcription–polymerase chain reaction
Reverse transcription (RT) of 1 μg denatured RNA was performed using 25 μmol/L random hexamers (Boehringer Mannheim) and 200 U superscript II (Gibco) in 20 μL 1× buffer supplied by the manufacturer at 42°C, and then it was diluted 5- to 10-fold. Polymerase chain reaction (PCR) was performed in a Perkin Elmer 9600 thermal cycler using a common 3′-primer (5′-CGA TAA GCT AGA TGG TCT CGA GGT) and a specific 5′-primer (REDK-L–specific, 5′-CCG AGC TAG GAG ATG GGA GGC ACA, 634-bp product; REDK-S–specific, 5′-ATT TTG CCT CCA CCA TCC ACC AGA, 628-bp product; REDK, 5′-CCT TCT GAA CCA CCT CCA CCC AGA, 466-bp product). Reactions contained 1 μL cDNA and 1× Advantage Polymerase Mix (Clontech) in the supplied buffer. Amplification began after 2 minutes of preamplification denaturation at 94°C, with cycling at 94°C for 20 seconds, 68°C for 20 seconds, and 72°C for 4 minutes for up to 34 cycles. Quantitation was performed at points during exponential amplification. Products were visualized by ethidium-bromide staining, and gels were scanned by fluorometry for quantitation and were analyzed using ImageQuant software (Molecular Dynamics, Sunnyvale, CA). The PCR product for G3PDH was analyzed to allow for the normalization of data for quantitation.
Preparation of protein extracts and analysis
Whole-cell lysates were prepared using 50 mmol/L Tris-HCl, pH 7.5, 50 mmol/L NaCl, 1 mmol/L EDTA, 1 mmol/L EGTA, 1% NP-40, 50 mmol/L NaF, 5% glycerol, 0.5% sodium orthovanadate, and a protease inhibitor cocktail (1 μg/mL aprotinin, bestatin, and leupeptin and 1 mmol/L phenylmethylsulfonyl fluoride). Nuclear protein extracts were obtained by lysing the plasma membrane with 0.2% NP-40 in a hypotonic buffer consisting of 20 mmol/L HEPES, pH 8.0, 20 mmol/L NaF, 1 mmol/L each sodium orthovanadate, sodium pyrophosphate, EDTA, EGTA, and dithiothreitol, and protease inhibitors. After this the nuclei were pelleted at 16,000g and eluted with high-salt buffer (hypotonic buffer above containing 420 mmol/L NaCl and 20% glycerol). Protein concentrations were determined by Bradford assay (Bio-Rad, Hercules, CA) using bovine serum albumin as a standard. Extracts were subjected to SDS-PAGE or to immunoprecipitation. SDS-PAGE was performed using Tris–glycine–SDS gels (7.5% or 15%) and were subsequently transferred to nitrocellulose for Western blotting and development by ECL (Amersham, Arlington Heights, IL) or for drying followed by autoradiography for kinase activity assays.
REDK-reactive serum (Y3-52) was prepared by inoculating rabbits with an antigenic peptide conjugated to KLH (H-CNPSEPPPPRRLNMTTEQFTGD-OH), and the IgG fraction was used. Blots were blocked using 5% nonfat milk in 0.5% Tween-20/PBS. For Western blotting, sera were diluted 1:100 and were developed using horseradish peroxidase–conjugated antirabbit antibody (Amersham) and ECL.
Cellular kinase activity was assessed after immunoprecipitation with the T7-tag (Invitrogen, Carlsbad, CA) or Y3-52 sera and capture with protein A-Sepharose beads (Pharmacia Biotech). Immunoprecipitates were incubated at 37°C in kinase buffer containing 50 mmol/L HEPES, pH 7.0, 5 mmol/L MgCl2, 10 mmol/L β-glycerophosphate, 1 mmol/L sodium pyrophosphate, 0.2 mmol/L sodium orthovanadate, 100 μmol/L adenosine triphosphate (ATP), and 10 μCi γ-33P-ATP, with or without substrate, and then electrophoresed.
Results
The cloning of different REDK cDNA isoforms
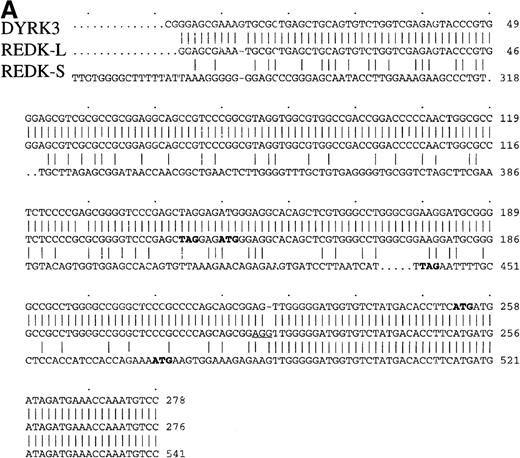
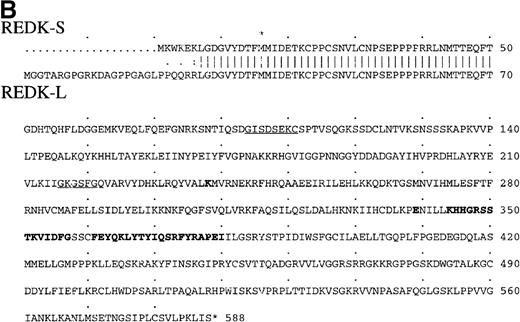
A search of the SmithKline Beecham cDNA database identified a partial human cDNA clone with homology to a dual-specificity kinase termed Yak1p from Saccharomyces cerevisiae. Using conventional cDNA cloning methods, 2 full-length cDNA strands were identified: a 2.3-kb strand from a human testis cDNA library and a 2.1-kb strand from a skeletal muscle cDNA library. Comparison of these 2 cDNA strands indicated that the 3′-most 1844 nucleotides were identical (Figure 1A). The cDNA from the skeletal muscle library was 266 nucleotides shorter than the testis cDNA, but it encoded a protein 20 amino acids longer at the amino terminus than that obtained from the testis library. We have termed these cDNA strands REDK-L (longer protein) (GenBank accession number AF1865773) and REDK-S (shorter protein) (GenBank accession number AF186,774) (Figure 1B). The presence of the splice site acceptor consensus sequence, AGG, in REDK-L suggested that the differences between these 2 forms of cDNA might have resulted from alternative splicing.37 The presence of an in-frame stop codon immediately 5′ of the initiation codon indicated that both cDNA strands were full length. They were nearly identical to a sequence reported previously29; however, DYRK3 differed at the 5′ end and encoded the shortest translation product. Analysis of the 5′-nucleotide sequence indicated that the DYRK3 cDNA was identical to REDK-L, except that DYRK3 lacked a single G residue present in REDK-L and that DYRK3 did not contain an upstream termination codon.
Nucleotide alignment of the REDK-L and REDK-S cDNA.
(A) The 5′-ends of the cDNA are shown, with nucleotides numbered according to the longest clone obtained. Initiation codons for REDK-L, REDK-S, and DYRK3 are in bold, as are upstream in-frame stop codons for REDK-L and REDK-S. Downstream sequences for REDK-L, REDK-S, and DYRK3 are identical and are not shown. (B) Translated amino acid sequences for REDK-L and REDK-S. Residues predicted to contribute to ATP binding are underlined. Active site catalytic residues are bold. The start of the DYRK3 product coincides with Met36 in REDK-L (designated by an asterisk).
Expression of REDK is restricted primarily to hematopoietic tissues
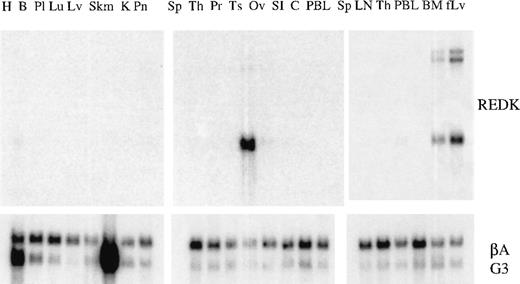
A REDK cDNA fragment common to both the long and the short forms of cDNA was hybridized to Northern blots containing polyA + RNA from a variety of human tissues to evaluate the distribution and abundance of the REDK message (Figure 2). The highest levels of expression were in testis, fetal liver, and bone marrow. The hybridization to β-actin and G3PDH probes was shown to provide an indication of relative loading of RNA kinase. Although there was some variation across the panel of tissues, the expression of REDK was clearly high in the 3 tissues compared to others surveyed. In most other tissues, levels were below the detection limit, but low levels were discerned for heart, pancreas, lymph node, and thymus. REDK was found predominantly as a 2.5-kb message, but in fetal liver and bone marrow, 8- and 10-kb species were substantial components, suggestive of tissue-specific alternative splicing. Volume integration of the PhosphorImager counts indicated that levels of REDK message in testis was approximately 10-fold higher than that in fetal liver and bone marrow.
Tissue distribution of REDK message.
PolyA + RNA multiple-tissue Northern blots were hybridized to the REDK cDNA probe fragment. Hybridizations to probes for β-actin and G3PDH are shown to illustrate loading consistency. H, heart; B, brain; Pl, placenta; Lu, lung; Lv, liver; Skm, skeletal muscle; K, kidney; Pn, pancreas; Sp, spleen; Th, thymus; Pr, prostate; Ts, testis; Ov, ovary; SI, small intestine; C, colon; PBL, peripheral blood leukocytes; LN, lymph node; BM, bone marrow; fLv, fetal liver.
Erythroid cell lines express the highest level of REDK message
To characterize further the expression of REDK, pA + RNA from a panel of hematopoietic cells and from several hematopoietic tissues was blotted and hybridized to the cDNA probe for REDK (Table1). Most samples, including myeloid, monocytic, and lymphoid cell lines, and the megakaryoblastic cell lines Mo7e and CMK86, produced only background signals. In contrast, erythroid cell lines and the EPO-responsive cell lines UT7-EPO, TF1, K562 and HEL showed substantially increased levels of REDK, suggesting that REDK might function specifically in erythroid cells. This possibility is corroborated by the very low expression levels of REDK in peripheral blood leukocytes and myeloid cells compared with the REDK message present in bone marrow. The pattern obtained with a probe for DYRK2, the closest known mammalian homolog to REDK, was dissimilar, showing that these homologous kinases are present in different cell types. Neither REDK nor DYRK2 was expressed in a selection of transformed cell lines (A549, HeLa, MRC5). Northern blot analysis with total RNA confirmed the elevated expression in cells with erythroid character. As in bone marrow and fetal liver tissues, 3 REDK-hybridizing species were present, and at similar sizes (data not shown).
Expression of DYRK2 and REDK in hematopoietic tissues and cell lines
| Tissue/Cells . | DYRK2 . | REDK . |
|---|---|---|
| Bone marrow | − | ++ |
| Fetal liver | − | +++ |
| PBLs | − | − |
| Stroma | − | − |
| TF274 | +++ | − |
| Myeloid | − | − |
| KG1a, HL60 | ||
| Monocytic U937, THP-1 | − | − |
| Erythroleukemic K562, HEL | − | ++ |
| EPO-responsive UT7-EPO, TF1 | − | +++ |
| Megakaryoblastic Mo7e, CMK | − | − |
| Lymphocytic Bjab, Supt-1, Jurkat | ± | − |
| Cancer lines | − | − |
| A549, HeLa, MRC5 |
cDNA probes for DYRK2 and REDK were hybridized to dot blots containing equivalent amounts of pAK + RNA from the human tissues and cells shown. Signals above background were ranked as ±, +, ++, or +++.
REDK message is up-regulated and maintained in human primary bone marrow treated with EPO
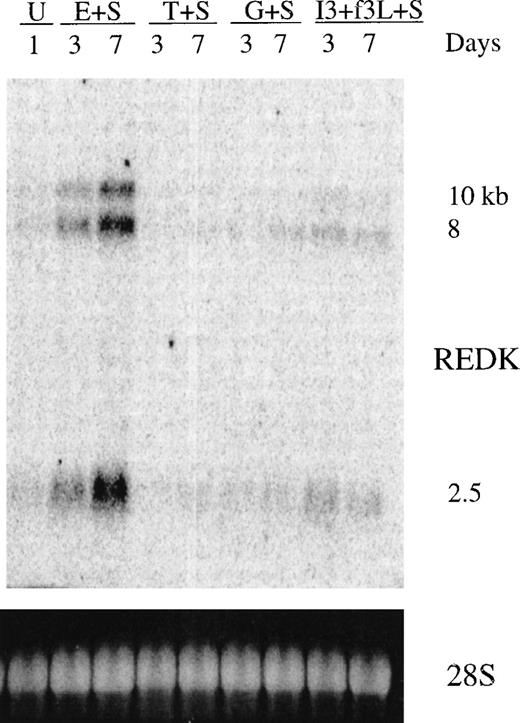
To investigate the expression of REDK in normal hematopoietic cells, we prepared total RNA Northern blots from primary human bone marrow cells exposed to factors for 3 or 7 days before harvesting and isolation of RNA (Figure 3). The photograph of ethidium bromide staining of the 28S rRNA bands indicates the relative loading. A low level of the 3 REDK species can be detected in the untreated cells. Cultures stimulated with EPO + SCF display up-regulation and sustained expression of REDK. This can be clearly seen at the 3-day point and is more pronounced by 7 days. It is not possible to determine whether the increase in steady-state RNA level resulted from a greater number of expressing cells or higher levels in the cells expressing REDK. Conversely, cultures with SCF, G-CSF, or TPO, but without EPO, showed a loss of REDK expression, even though there was proliferation under all conditions (data not shown). A low level of REDK message was obtained when cells were cultured with IL-3, which supports the growth and differentiation of multiple lineages, including early erythroid progenitors. REDK was also present when cells were treated with EPO alone for 3 and 7 days, though the up-regulation was more modest (data not shown).
Expression of REDK message in bone marrow.
Total RNA from untreated (U) human bone marrow or from cells treated with stem cell factor (S), erythropoietin (E), thrombopoietin (T), granulocyte-colony stimulating factor (G), interleukin-3 (I3), or flt3 ligand (f3L) for 3 or 7 days was blotted and hybridized to the REDK cDNA probe. Hybridization to a DNA oligonucleotide probe for 28S RNA is shown to display relative loading of the RNA.
Alternative splicing of the REDK message is tissue dependent
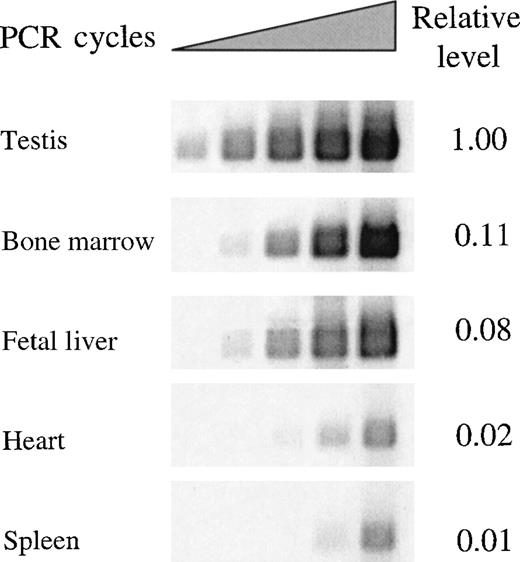
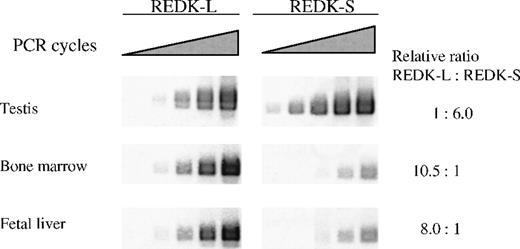
To profile expression of the REDK-L and REDK-S messages independently, we performed semiquantitative RT-PCR with primers detecting either total REDK species (Figure4) or specific products from REDK-L or REDK-S (Figure 5). Selected tissues (testis, bone marrow, fetal liver, heart, and spleen) were evaluated based on evidence of REDK expression from multiple tissue Northern blots. Amplification cycles were chosen so that the initial detection of products could be monitored to estimate relative expression levels and to allow meaningful quantitation. The REDK message is most abundant in testis, with the short form predominating approximately 6:1. Substantial product was also obtained in bone marrow and fetal liver, with approximately 11% and 8% as much as testis, respectively. In these tissues, the pattern was reversed, with the long form more prevalent. Semiquantitative RT-PCR determinations yielded long-to-short proportions of 10.5:1 for bone marrow and 8:1 for fetal liver. In all 3 tissues, the product from the common primer pair was approximately equal to the sum of the long and the short forms. Much lower levels of REDK were detected in heart and spleen. Amplification of heart and spleen with the REDK-L and REDK-S primer sets indicated that the REDK-L and REDK-S products constituted only approximately 10% of the REDK detected, suggesting the presence of other splice variants. Analysis of RNA from UT7-EPO and TF1 cells showed that both long and short forms were expressed and that they were present at approximately equal levels (data not shown).
Semiquantitative RT-PCR determination of REDK mRNA expression in different tissues.
Total REDK PCR primer set was used to amplify a RED-specific product of 466 nucleotides after first-strand cDNA synthesis from pA + RNA. Bands produced during exponential amplification were volume quantified and normalized to a G3PDH-specific product.
Semiquantitative RT-PCR determination of the REDK-L and REDK-S messages.
PCR amplification was performed on first-strand cDNA using sense primers specific for the long form or the short form, and a common antisense primer. Bands produced from exponential amplification were volume quantitated and normalized to G3PDH for comparison.
Hematopoietic progenitor cells express REDK and display increased REDK-S during erythroid differentiation
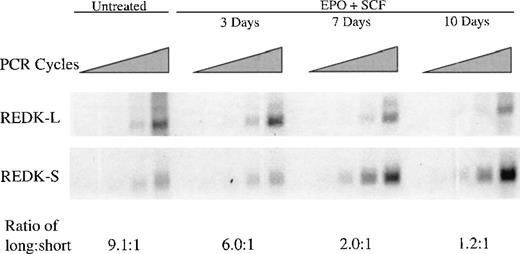
CD34+ cells isolated by magnetic affinity separation were cultured with EPO and SCF up to 10 days, followed by RNA extraction and semiquantitative RT-PCR analysis (Figure6). Both REDK-L and REDK-S were present in the CD34+ cells at day 0, consistent with a role in progenitor cells. During the culture period, the abundance of the REDK-L message decreased slightly (approximately 2-fold), whereas the REDK-S form increased 5-fold after day 3 and remained elevated through 10 days. By day 10 the 2 species were present at approximately equal levels, though the REDK-L RNA began at an approximately 10-fold higher relative level at day 0. This 10-fold change in the relative expression of REDK-L and REDK-S points to a significant, specific role for the REDK-S form.
Expression of REDK in CD34+ cells during erythroid differentiation.
Purified CD34+ cells were seeded in medium (20% FBS) containing 4 U/mL EPO and 50 ng/mL SCF. Cells were harvested for RNA extraction at the days indicated, and RT-PCR analysis was performed with REDK-L– and REDK-S–specific primers. Quantitation of the relative expression of the REDK-L and REDK-S messages was determined based on normalization to G3PDH.
REDK is a nuclear protein whose expression correlates with erythroid differentiation
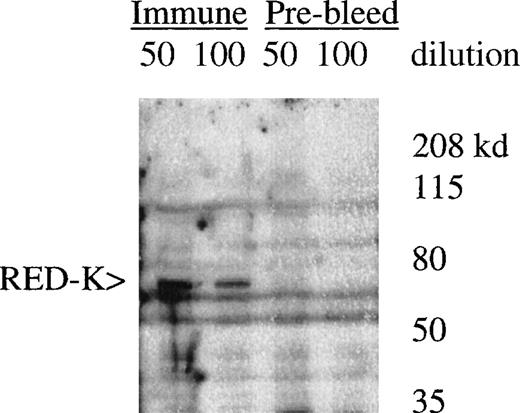
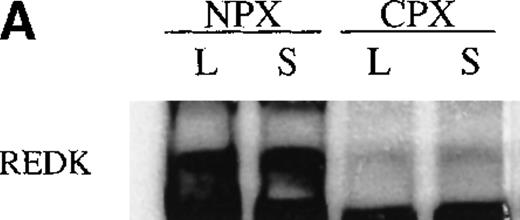
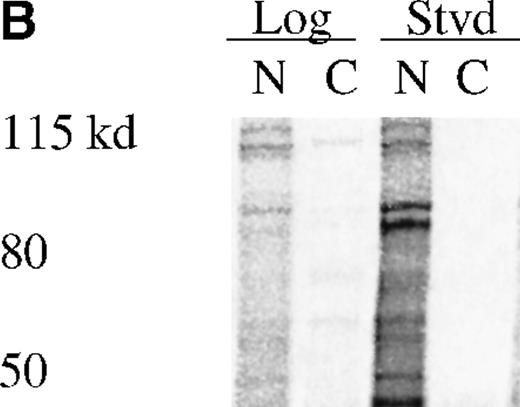
UT7-EPO and TF1 cells are human EPO-responsive cell lines that can be induced to differentiate and become hemoglobin-positive when stimulated with hemin or with EPO (data not shown). Using polyclonal antisera raised to a RED-specific peptide (see “Materials and methods”), a protein of 65 to 70 kd was detected on Western blots from whole-cell lysates; this band was not detected by the preimmune sera (Figure7). Western blotting of whole-cell lysates with the Y3-52 sera indicated a modest accumulation of REDK protein in UT7-EPO cells after hemin treatment. REDK protein was also present in TF1 cells, but EPO-stimulated hemoglobination did not alter the amount detected (data not shown). Crude fractionation of cells through the preparation of cytoplasmic and nuclear protein extracts further showed that REDK protein was predominantly a nuclear protein (Figure 8). This preference appeared to remain constant whether the cells were in log phase, deprived of growth factor, or induced to differentiate with hemin (UT7-EPO) or EPO (TF1). Y3-52-IP/activity assays of the cytoplasmic and nuclear protein extracts indicated that most of the REDK activity was nuclear. The identification of these proteins is under investigation.
Detection of REDK protein by peptide antisera.
Whole-cell lysate from UT7-EPO cells was blotted with rabbit preimmune and immune sera after immunization with the Y3-52 peptide. The predicted molecular mass for REDK is 67 kd.
Detection of REDK protein by peptide antisera.
Whole-cell lysate from UT7-EPO cells was blotted with rabbit preimmune and immune sera after immunization with the Y3-52 peptide. The predicted molecular mass for REDK is 67 kd.
REDK is predominantly a nuclear protein.
(A) UT7-EPO cells were in log phase (L) or starved for EPO (S) for 2 days. Crude cytoplasmic (CPX) and nuclear protein (NPX) extracts were prepared, and proportionate amounts of cytoplasmic and nuclear protein were transferred to nitrocellulose. The Western was probed with REDK-specific sera and detected by ECL. (B) REDK was immunoprecipitated from companion cytoplasmic and nuclear protein extracts with affinity-purified antisera for REDK and reacted after the addition of 33P-ATP. Products were denatured, electrophoresed, and exposed for imaging. Normalized volumes of protein extracts were loaded so that each lane contained immunoprecipitates from the same number of cells.
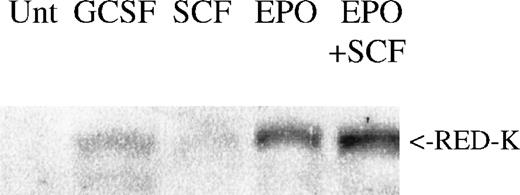
In primary bone marrow, REDK protein expression is up-regulated in cells stimulated with EPO or EPO + SCF, but not with G-CSF or SCF alone (Figure 9). Although the magnitude of REDK protein expression varied from donor to donor, the highest levels of REDK protein were consistently present in cells treated with EPO rather than because of other factors or combinations.
REDK protein correlates with erythroid differentiation.
Low-density mononuclear cells from a normal human donor were untreated (Unt) or treated for 7 days as shown. Whole-cell protein lysates were analyzed for REDK protein by Western blotting. Comparable results were obtained from multiple donors.
REDK protein correlates with erythroid differentiation.
Low-density mononuclear cells from a normal human donor were untreated (Unt) or treated for 7 days as shown. Whole-cell protein lysates were analyzed for REDK protein by Western blotting. Comparable results were obtained from multiple donors.
REDK phosphorylates myelin basic protein and histones H2b and H3
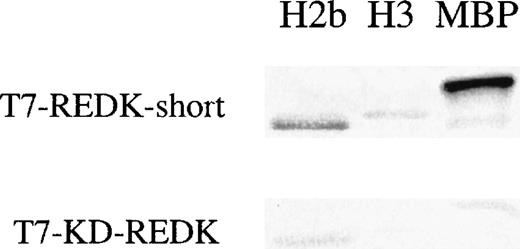
To characterize the functional and enzymatic activities of REDK, we constructed UT7-EPO cell lines expressing T7-(his)6-tagged recombinant REDK. Although the inability to maintain expression of the recombinant REDK in these lines precluded definitive demonstration of a functional role for REDK, enzymatic activity of the recombinant protein could be demonstrated in early passages. The activity of the recombinant REDK was demonstrated by comparing the kinase activity of the T7-tag-immunoprecipitates from the wild-type transfected cells to those expressing the kinase-dead protein (data not shown). Myelin basic protein and histone H2b were phosphorylated by the T7-tag-immunoprecipitates from wild-type transfected cells to a greater extent than histone H3 (Figure10). No phosphorylation on tyrosine could be detected on endogenously or exogenously expressed REDK by blotting with an antiphosphotyrosine antibody, even after incubation of T7-tag-immunoprecipitates with ATP (data not shown).
Recombinant REDK can phosphorylate myelin basic protein and histones.
Nuclear protein extracts from log cells stably transfected with a tagged, recombinant REDK-S (clone S9) were immunoprecipitated by the T7-tag-specific sera. Immunoprecipitates were incubated with P-33-ATP and substrates to assess activity. Samples were collected in the linear range and analyzed as previously.
Treatment of human bone marrow with REDK antisense oligonucleotides increases the number of erythroid colonies and increases the sensitivity to erythropoietin
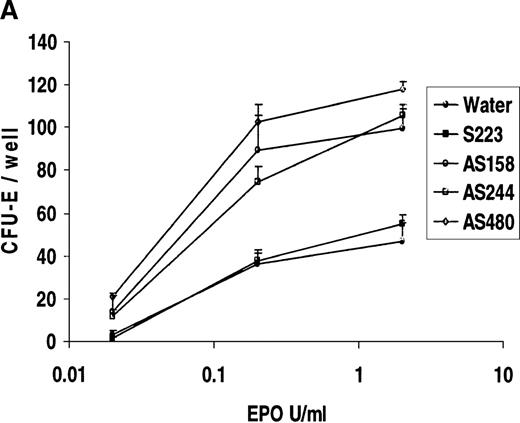
To determine whether REDK is involved in regulating EPO-driven proliferation or differentiation, low-density human bone marrow cells were preincubated for 6 hours with sense or antisense phosphorothioate oligonucleotides before the addition of medium and growth factors. Four different oligonucleotide probes were tested: a sense probe (S223) and 3 antisense probes (AS155, specific for the REDK-L message; AS480, specific for the REDK-S message; and AS244, which interacts with REDK-L and REDK-S RNA). Colony growth was compared simultaneously with marrow cells preincubated with an equal volume of water. CFU-E was evaluated after 7 days of incubation in methylcellulose-based medium supplemented with recombinant EPO. Addition of 2 U/mL EPO results in maximal CFU-E growth, whereas minimal CFU-E was obtained at 0.02 U/mL (Figure11A). Incubation with REDK sense oligonucleotide (S223) did not alter the EPO dose-response curve. However, there were significant increases in EPO-induced CFU-E growth with each REDK antisense oligonucleotides (AS155, AS244, AS480) tested. The AS480 probe (specific for REDK-S) resulted in the most significant increases in CFU-E, reaching 240%, 236%, and 524% of control for 2, 0.2, and 0.02 U/mL EPO, respectively. Colony formation, however, was strictly dependent on the presence of EPO. In the absence of EPO, no erythroid colonies were obtained with any oligonucleotide treatment (data not shown).
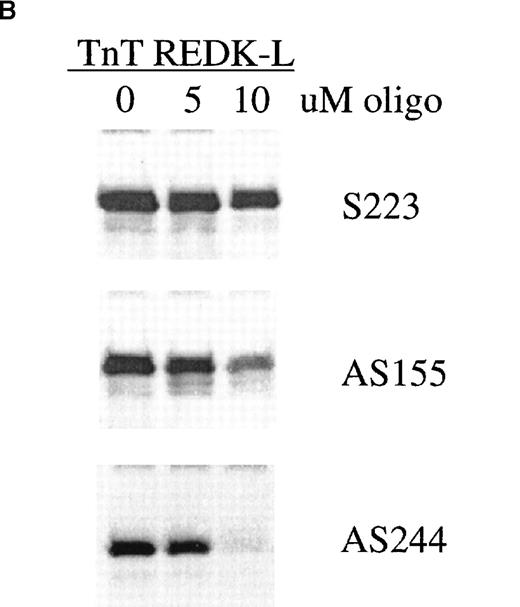
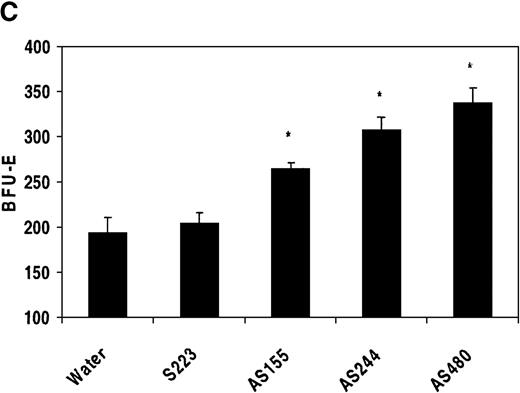
Antisense phosphorothioate DNA oligonucleotides to REDK promote erythroid colony formation.
(A) Low-density mononuclear bone marrow cells were plated in semisolid medium with EPO after incubation with sense (S223) or antisense (AS155, AS244, AS480) phosphorothioate DNA oligonucleotides. CFU-E were scored at 7 days in multiple wells. (B) Antisense oligonucleotides inhibit in vitro transcription/translation. TnT reactions containing the REDK-L cDNA were incubated with no oligo or with 5 or 10 μmol/L S223, AS155, or AS244. Products were determined by Western blot analysis. (C) Antisense phosphorothioate DNA oligonucleotides to REDK stimulate early erythroid progenitors. Low-density mononuclear bone marrow cells were plated in semisolid medium with saturating, synergistic factors (methycellulose-based medium) after incubation with sense (S223) or antisense (AS155, AS244, AS480) phosphorothioate DNA oligonucleotides. BFU-E was scored at 12 days in multiple wells.
REDK antisense oligonucleotides were capable of blocking the synthesis of REDK protein in coupled in vitro transcription/translation reactions, indicating that they act by an antisense mechanism to inhibit the production of REDK protein (Figure 11B). The effectiveness of inhibition paralleled the activity of the antisense oligonucleotides in the CFU-E assay. In addition, semiquantitative RT-PCR analysis of RNA from bone marrow cells incubated with the AS480 oligonucleotide exhibited 35% to 50% decreases in the amount of REDK-S message compared to the S223 oligonucleotide or the no oligonucleotide control (data not shown).
Marrow cells cultured with an optimized, commercially available methycellulose-based medium containing a mixture of hematopoietic growth factors (EPO, G-CSF, GM-CSF, IL-6, IL-1, and SCF) grew progenitor colonies including BFU-E, CFU-GM, and CFU-GEMM in the same well. Bone marrow cells incubated with REDK antisense oligonucleotides resulted in significant expansion in BFU-E growth over control (Figure11C), with increases of 35% to 75% over the maximal expected numbers. Incubation with a sense oligonucleotide (S223) did not modify BFU-E growth compared to controls. None of the REDK oligonucleotide probes had a significant effect on the number of CFU-GM or CFU-GEMM in these cultures (data not shown). Moreover, preincubation of human marrow cells with REDK oligonucleotides had no effect on myeloid CFU growth at optimal or suboptimal concentrations of G-CSF or GM-CSF (data not shown). In addition, oligonucleotide treatment produced no significant effects on the number of cells per colony.
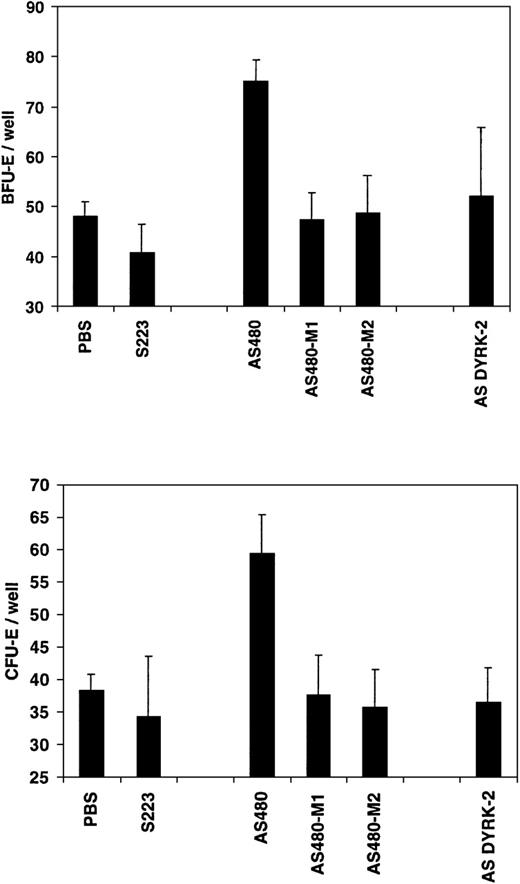
The specificity of the REDK AS480 antisense oligonucleotide probe (RED-S specific) was tested by phosphorothioate oligonucleotide probes with either 1 (AS480-M1) or 2 (AS480-M2) point mutations. A DYRK2 antisense probe (AS DYRK2) was used as an additional control to confirm the functional specificity of REDK in CFU formation. As shown in Figure12, preincubation of human marrow cells with the AS480 REDK antisense probe resulted in significant increases in both CFU-E and BFU-E formation over controls. Incubation with REDK sense, point-mutated AS480 probes, or DYRK2 antisense probes resulted in colony growth equivalent to that of the control. No effects were observed on the numbers of CFU-GM or CFU-GEMM in these same wells.
The effect of antisense phosphorothioate DNA oligonucleotides to REDK is sequence-specific.
Low-density bone marrow cells were incubated with REDK sense (S223), antisense (AS480), mutant antisense (AS480M1, AS480M2), or DYRK2 antisense (AS DYRK2) and were plated in methylcellulose-based medium with synergistic factors, as described. BFU-E (upper panel) and CFU-E (lower panel) were scored at 12 and 7 days, respectively.
Discussion
We have identified a human serine/threonine kinase we call REDK that is regulated in its expression and isoform profile during hematopoietic development. REDK was identified and cloned based on its homology to the yeast kinase, Yak1p, which acts negatively to regulate the cell cycle.38 The sequence for REDK is also highly related to another recently published human sequence, DYRK3.29However, the sequences for REDK and DYRK3 differ at their 5′-ends. A survey of hematopoietic tissues and cell lines shows that REDK is predominantly found in cells with erythroid characteristics. Its presence in the EPO-responsive UT7-EPO and TF1 cell lines and in the expression patterns suggests that REDK may have an erythroid-specific role in development. Furthermore, Northern blots of hematopoietic tissues and cells consistently display 3 RNA species related to REDK at 2.5, 8, and 10 kb, and we have cloned 2 different variants of REDK message that are predicted to yield proteins with differing amino termini. The difference in expression patterns of the REDK messages is consistent with tissue-specific regulation, and the encoded REDK-S and REDK-L may fulfill distinct roles.
In normal tissues, REDK also displays a restricted expression profile. Although the highest expression is in testis, expression is also substantial in tissues important in hematopoietic development, bone marrow, and fetal liver. RT-PCR analysis with primer pairs specific for the long and short REDK variants demonstrate their presence in different amounts in testis, bone marrow, and fetal liver. Testing of other low-expressing tissues suggests that additional forms, different from the variants identified in this report, may also exist. It is therefore expected that REDK may have tissue or developmentally defined roles that depend on differential splicing, expression levels, or both.
Further support for a developmentally specific role for REDK is provided by experiments with primary bone marrow cells. REDK expression was up-regulated and sustained only when cells were stimulated with EPO, indicating that REDK expression is associated with EPO-driven cellular responses. The decline of REDK under other treatments could be attributed to the loss of erythroid cells, and the higher levels of REDK message attained at 7 days compared to 3 days of culture may reflect an enrichment of erythroid-lineage cells. The presence of REDK in earlier erythroid cells propagated in IL-3, however, suggests that its expression is linked to early erythroid commitment and is not induced by EPO treatment. In addition, we did not observe any up-regulation of REDK RNA or protein expression caused by EPO stimulation in UT7-EPO or TF1 cells. These observations indicate that REDK is not an EPO response gene, and they suggest that any relationship between EPO signal transduction and REDK is indirect. Nonetheless, REDK may be regulated by catalytic or allosteric activation, or by substrate availability.
Immunoprecipitation/activity studies indicate that several proteins associate with REDK and may be substrates for phosphorylation, and that the kinase is competent to phosphorylate myelin basic proteins H2b and H3. A potential complication in these experiments is the coimmunoprecipitation of other kinase activities. For example, the Y3-52 sera immunoprecipitated the kinase activity against myelin basic protein from cytoplasmic extracts, but no REDK could be detected in these samples by Western blot analysis. However, immunoprecipitation with the Y3-52 sera from the kinase-dead cell lines showed decreased phosphorylation of the coimmunoprecipitated proteins compared with the recombinant REDK-expressing and parental cell lines. These data indicate that the phosphorylation of the coimmunoprecipitated proteins is primarily caused by REDK. Specific substrates or inhibitors for REDK will be required for more conclusive evaluations. Identification of the coimmunoprecipitated and phosphorylated proteins is in progress. Although Becker et al29 present evidence of autophosphorylation by DYRK3 on tyrosine, we did not observe any indication of tyrosine kinase activity from REDK expressed in hematopoietic cell lines or primary cells. Thus, our activity assays may have lacked some essential regulator of this activity, or it may not have been operative in hematopoietic cells.
Experiments using antisense phosphorothioate oligonucleotides in colony formation assays, which demonstrate augmentation of erythroid colony formation in the presence of EPO alone or in a mixture of hematopoietic growth factors, provide insight into the functional significance of REDK in erythropoiesis. The effectiveness of the AS480 oligonucleotide in enhancing the erythroid colony numbers and the RT-PCR results from developing CD34+ cells, in which there is a 10-fold shift in the relative expression of REDK-S and REDK-L, suggests that the REDK-S protein may have a more significant role in late erythroid development. Antisense oligonucleotide effects were obtained on both CFU-E and on BFU-E formation, suggesting that the expression of REDK is an integral part of erythroid commitment and differentiation of EPO-responsive cells. In addition, the lack of effect with control oligonucleotides demonstrates that the stimulatory effects clearly result from the specific REDK antisense sequences and that they are not a general effect of oligonucleotide treatment. Analyses of steady-state RNA levels by RT-PCR and production of REDK protein in vitro indicate that the oligonucleotides affect message levels and appear competent to decrease REDK protein levels.
Assays for GM-CSF– and G-CSF–dependent colony formation indicate that REDK does not play an important role in the development of these myeloid cells, which is consistent with the lack of expression of REDK in bone marrow cell cultures treated with myeloid growth factors. Multipotential CFU-GEMM cells were also unaffected by REDK antisense oligonucleotides. Cumulatively the results show that REDK is involved in the proliferation, differentiation, or both of cells committed to the erythroid lineage only.
The Yak family of protein kinases includes members from a variety of organisms. Where function has been assigned, these kinases appear to be negative regulators of cell growth, differentiation, or both. Absence of Yak1p from S. cerevisiae causes cells to arrest at G1 in PKA-deficient strains. In Dictyostelium, YakA is required for starvation-induced development and growth arrest.33 In addition, the overexpression of yeast Yak1p can suppress late mitotic defects, suggesting an involvement at the G0 to G1 boundary.38 REDK is one of the human kinases to which Yak1p and YakA are most closely related, implying a similar role may exist for REDK in erythropoiesis. Further understanding of the functions exerted by REDK will require knowledge of target substrates and associated regulatory proteins. REDK may function by interacting with the common cellular machinery, and, if so, the erythroid-specific expression of REDK might be a means of obtaining developmental control over the erythroid lineage. The nuclear localization of REDK is also consistent with a role in the control of growth and differentiation. REDK may act as a brake on CSF-stimulated proliferation in erythroid cells, thereby promoting, either directly or indirectly, EPO-stimulated differentiation. Inhibition of REDK function, like that achieved by the antisense oligonucleotides as surrogate inhibitors, could be expected to amplify EPO-stimulated proliferation and red blood cell production.
Acknowledgment
We thank Dr Don Wojchowski (Pennsylvania State University, State College, PA) for many helpful discussions and for critical reading of the manuscript.
Reprints:Kenneth A. Lord, SmithKline Beecham Pharmaceuticals, UP1455, 1250 S. Collegeville Road, Collegeville, PA 19426; e-mail:kenneth_a_lord@sbphrd.com.
The publication costs of this article were defrayed in part by page charge payment. Therefore, and solely to indicate this fact, this article is hereby marked “advertisement” in accordance with 18 U.S.C. section 1734.

This feature is available to Subscribers Only
Sign In or Create an Account Close Modal