Abstract
The transcription factor E2F-1 has been postulated to play a crucial role in the control of cell cycle progression because of its ability to be bound and regulated by the retinoblastoma gene product (pRb). Exogenous expression of E2F-1, under growth restrictive conditions, was shown to result in p53-dependent programmed cell death. The consequences of deregulated expression of E2F-1 on terminal differentiation of hematopoietic cells in the absence of E2F-1–mediated apoptosis, as well as mechanistic insights into how deregulated E2F-1 may affect terminal differentiation, have not been established. The autonomously proliferating M1 myeloblastic leukemia cell line, which is null for p53 expression and can be induced by interleukin-6 (IL-6) to undergo terminal macrophage differentiation with concomitant loss of leukemogenicity, provides a particularly attractive model system to address these issues. Deregulated and continued expression of E2F-1 blocked the IL-6–induced terminal differentiation program at an early blast stage, giving rise to immature cells, which continued to proliferate without undergoing apoptosis and retained their leukemogenic phenotype. Although E2F-1 blocked IL-6–mediated terminal differentiation and its associated growth arrest, it did not prevent the rapid induction of both p15INK4B and p16INK4A, inhibition of cdk4 kinase activity, and subsequent hypophosphorylation of pRb. The results obtained imply that genetic alterations that both impair p53 function and deregulate E2F-1 expression may render hematopoietic cells refractory to the induction of differentiation and are, thereby, likely to play a major role in the progression of leukemias.
In recent years, transcription factors of the E2F family have emerged as key regulators of cell cycle progression, which function by activating the transcription of genes necessary for S-phase entry and progression.1-7 The functional E2F transcription factor is a heterodimer composed of 1 E2F and 1 DP subunit.8-14 The transcriptional activity of E2F factors is negatively regulated by their physical association with products of the retinoblastoma gene family (pRb, p107, p130) in the G0/G1phases of the cell cycle.15-21 The ability of Rb family members to sequester and repress the activity of E2F factors is, in turn, regulated by cyclin/cdk kinases, including cyclin D/cdk4 and cyclin E/cdk2. Phosphorylation of pRb by these kinases leads to the dissociation of E2F from the inhibitory pRb-E2F complex, which results in transcriptionally active E2F.22-25 The activity of the cyclin/cdk complexes is itself negatively regulated by specific cyclin-dependent kinase inhibitors such as p15INK4B and p16INK4A.26-28
Among the different E2F factors that have been characterized, ample evidence has accumulated that E2F-1 plays a central role in G1 to S-phase cell cycle progression.4,29-33 Deregulated expression of E2F-1 under growth restrictive conditions was observed to result in programmed cell death.30,31,34-36 Using an in vivo transgenic mouse model, deregulated expression of E2F-1 from a megakaryocyte-specific promoter was found to impair maturation of megakaryocytes and to increase their apoptosis, leading to reduced platelet formation.37 In addition, deregulated E2F-1, in conjunction with ectopic expression of Bcl-2 to delay apoptosis, was observed to prevent granulocytic differentiation of IL-3–dependent 32Dcl3 hematopoietic progenitor cells, after IL-3 deprivation and treatment with granulocyte colony-stimulating factor (G-CSF).38 However, the consequence of deregulated expression of E2F-1 on terminal differentiation in the sustained absence of E2F-1–induced apoptosis has not been established. In this study, we have addressed this issue using M1 cells in which the deregulated expression of E2F-1 does not result in cell death and therefore does not require ectopic Bcl-2. This allows for an examination of E2F-1 function in the absence of any possible contribution from the Bcl-2 transgene.
Autonomously proliferating M1 myeloblastic leukemia cells, which are null for p53 expression, can be induced by interleukin-6 (IL-6) to undergo terminal macrophage differentiation and concomitant loss of leukemogenicity.39 40 Thus, these cells provide a particularly attractive model system to gain insights into how deregulated expression of E2F-1 may affect the terminal differentiation program and loss of the leukemic phenotype, in the absence of apoptosis. Toward this end, expression of endogenous E2F-1 in M1 cells induced for terminal differentiation has been analyzed, and M1E2F-1 cell lines, expressing an E2F-1 transgene, have been generated and subjected to IL-6 treatment.
It is shown that, in contrast to the parental cells in which treatment with IL-6 resulted in suppression of endogenous E2F-1 and induction of terminal differentiation, deregulated, and continued expression of ectopic E2F-1 blocked the M1 terminal differentiation program at an early blast stage. In the presence of IL-6, the immature cells continued to proliferate, without undergoing apoptosis or losing their leukemic phenotype. Furthermore, it is shown that although E2F-1 blocked IL-6–mediated terminal differentiation and prevented growth arrest, it did not prevent the rapid induction of both p15INK4B and p16INK4A, inhibition of cdk4 kinase activity, and subsequent pRb hypophosphorylation. These data suggest that E2F-1 may block terminal differentiation by overriding the p15/p16-Rb-E2F checkpoint in the G1 phase of the cell cycle.
Materials and methods
Cells, cell culture, cytokines, and mice
The M1 myeloblastic leukemia cell line, derived from the SL mouse strain known for spontaneous myeloid leukemia41 used in this study, is competent for induction of terminal differentiation when stimulated with physiologic factors such as IL-6.42-44 The cells were cultured in Dulbecco's modified Eagle's medium (DMEM; Gibco BRL, Gaithersburg, MD) as previously described.42-44Cells were induced for differentiation with IL-6 (50 ng/mL; purified recombinant human IL-6 [rhuIL-6] was a generous gift from L. Souza, Amgen Inc, Thousand Oaks, CA), after being seeded at a concentration of 0.15 × 10⁶ cells/mL. The mice used in the leukemogenicity assays were 4- to 6-week-old CD-1 nu/nu mice obtained from Charles River Laboratories (Wilmington, MA).
Assays for differentiation-associated properties
Cytospins of cells collected at the indicated times were subjected to May-Grünwald-Giemsa staining, and morphologic differentiation was determined by counting at least 300 cells to score the proportion of immature blast cells, cells at intermediate stages of differentiation, and mature macrophages.42-44 Fc and C3 receptor assays and cell adherence were determined as previously described.42-44 Viable cells numbers were determined using the trypan blue dye exclusion method. Results of all experiments represent the mean of at least 3 independent determinations, with standard deviations up to ± 15% (ie, 20% = 20% ± 3%).
RNA extraction, Northern blotting, and hybridization
Total RNA was prepared from 3 to 5 × 10⁶ cells using TRIzol reagent (Gibco BRL) as described in the manufacturer's specifications. RNA gel electrophoresis, Northern blotting, hybridization, and stripping of blots were performed as previously described.42-44,48,49 Equal loading of RNA in each lane was confirmed both by visualizing equal intensity of ethidium bromide staining of ribosomal RNA bands and by hybridization of the Northern blots with radiolabeled β-actin probe.
Protein extraction and immunoblotting (Western blots)
Extracts of total proteins were prepared by resuspending cell pellets at a final concentration of 107 per milliliter in lysis buffer (2 × phosphate buffered saline [PBS], 1% sodium deoxycholate, 0.1% sodium dodecyl sulfate [SDS], 1 mmol/L EDTA,10 μg/mL leupeptin, 10 μg/mL chymostatin, 100 μg/mL phenyl-methylsulfonyl fluoride [PMSF]). After incubation for 15 minutes on ice, DNAse I (50 μg/mL) was added and samples were kept on ice for an additional 30 minutes. Four volumes of cold acetone were added and samples were placed at −20°C. The protein precipitate was pelleted and dissolved in SDS-polyacrylamide gel electrophoresis (SDS-PAGE) sample buffer. Total protein concentration was determined using the micro-BCA protein quantitation kit (Pierce, Rockford, IL). Fifty micrograms of each protein extract sample was fractionated on SDS-PAGE gels. Resolved proteins were transferred to Immobilon-P membrane (Millipore, Bedford, MA) using a Trans-blot apparatus (Bio-Rad, Hercules, CA) at 50 V for 18 hours. Equal loading of protein in each lane was verified by staining the Western blots with 0.1% Ponceau S solution (Sigma, St Louis, MO) before incubation with antibody. Blots were probed with the appropriate primary antibody for 2 hours at room temperature in PBS (pH 7.2), 0.5% bovine serum albumin (BSA), and 0.5% Tween-20. After rinsing in PBS containing 0.5% Tween-20, the blots were incubated for 30 minutes at room temperature in a solution containing secondary antibody conjugated to horseradish peroxidase (Amersham, Arlington Heights, IL). Signals were developed using the enhanced chemiluminescence (ECL) Western blotting system (Amersham). Primary antibody against the retinoblastoma gene product was obtained from Pharmingen, San Diego, CA (clone G3-245, cat no. 14001A). Antibodies against murine actin (cat no. sc-1616), E2F-1(cat no. sc-193), cdk-2 (cat no. sc-163), cdk-4 (cat no. sc-260), cyclin E (cat no. sc-481, p15 (cat no. sc-1429), p16 (cat no. sc-1661), p21 (cat no. sc-6246), and p27 (cat no. sc-1641), were all from Santa Cruz Biotechnology (Santa Cruz, CA).
General recombinant DNA techniques, expression vectors, and DNA probes
Plasmid preparations, restriction enzyme digestions, DNA fragment preparations, and agarose gel electrophoresis were performed as previously described.45,46 The retroviral plasmid expression vector, MSCV-puromycin, was a gift from Dr Robert G. Hawley.47 To construct the vector, MSCV-puro-E2F1, purifiedEcoR1 fragment of full-length murine E2F-1 was cloned into theEcoR1 site of the 6.3-kilobase (kb) MSCV-puromycin plasmid. The source of the 2.0-kb murine E2F-1 complementary DNA (cDNA) was the pBS-E2F1 plasmid (P. Farnham, McArdle Laboratory for Cancer Research, University of Wisconsin, Madison, WI).
DNA probes for murine MyD88, MyD118, IRF-1, and β-actin have been previously described.46,48,49 The ODC probe was obtained by excision from the pMV7-ODC vector.50 The murine p15INK4B and p16INK4A cDNA fragments were isolated from pBS-p15 and pBS-p16 vectors, respectively (obtained from C. Sherr, HHMI, St. Jude Children's Research Hospital, Memphis, TN). The murine thymidine kinase cDNA was from K. Hatton, Fels Institute, Temple University, Philadelphia, PA; cdc25A and cdc25B cDNAs were obtained from D. Beach, Cold Spring Harbor Labs, Cold Spring Harbor, NY. All probes were labeled by random priming (RadPrime DNA labeling kit, cat no. 18428-011, Gibco BRL) to a specific activity equal to or greater than 109 cpm/mg.
Establishment of M1E2F-1 cell lines that ectopically express an E2F1 transgene
Virus was generated from the plasmid forms of the retroviral vectors, MSCV-puro (as a control) and MSCV-puro-E2F1 and M1 cells were infected as previously descsribed.51 For puromycin-resistant colony selection, infected cells were seeded at 100 cells/mL in growth medium (DMEM + 10% horse serum), containing puromycin at 4 μg/mL and 1 mL aliquots, were dispensed into 24-well trays. After 10 to 15 days, cultures containing surviving cells were expanded. The infectants were continuously maintained in growth media containing 4 μg/mL of puromycin. Several independent M1E2F-1 clones were isolated and characterized as to the level of expression of their transgene. At least 5 independent clones were examined for their response to IL-6; in each case, the results were similar. Moreover, the response of 5 M1/MSCV-puro clones (empty vector controls) to IL-6 was indistinguishable from that of the parental M1 cells.
Transient transfection and luciferase assay
M1 and M1E2F-1 cells were seeded at a density of 0.5 × 10⁶ cells/mL 1 day before transfection, and 24 hours later, were transfected with the appropriate plasmids using the DEAE/dextran method as described elsewhere.52 Briefly, equimolar ratios of either wt-E2F-Luc or mut-E2F-Luc (luciferase reporter plasmids containing 3 tandem copies of wild-type or mutant E2F-1 binding sites, respectively11; a kind gift of D. M. Livingston, Harvard University, Boston MA) plasmids together with a β-gal control vector (pMLV-β-gal; used to determine transfection efficiency) were transfected together. pMLV-β-gal was constructed by R. T. T. Sjin in our laboratory. The total amount of DNA was adjusted to 20 μg with pBS-KS plasmid (Stratagene, La Jolla, CA). The cells were then incubated in the absence or presence of 50 ng/mL IL-6 and were harvested at 1-day intervals (day 0 to day 3) by centrifugation. After being washed with PBS, they were lysed with 120 μL reporter lysis buffer (Promega, Madison, WI). Forty microliters of cell extract was used to quantitate β-gal expression to enable normalizing for transfection efficiency. Lysate amounts were then adjusted for equal levels of β-gal activity and luciferase activity was measured in a Lumat LB 9501 luminometer.
Flow cytometric analysis
Cells were harvested at different time points by centrifugation, and washed 3 times in PBS containing 1% fetal bovine serum (FBS). Cells were fixed in 70% ice-cold ethanol, spun down, and washed once with PBS/1% FBS, and then treated for 30 minutes with RNase A (180 μg/mL RNase A in PBS). The cells were subsequently stained with propidium iodide (100 μg/mL in 7.6 mmol/L sodium citrate; Sigma) and analyzed using a Coulter Epics Elite system (Coulter, Miami, FL). Cell cycle analysis was performed at least 3 times with similar results.
Immunoprecipitation and in vitro kinase assays
For cdk2 kinase assay, 2 × 10⁷ cells were lysed in 1 mL of lysis buffer (50 mmol/L Tris-Cl pH 7.4, 5 mmol/L EDTA, 250 mmol/L NaCl, 50 mmol/L NaF, 0.1% Triton X-100, 0.1 mmol/L sodium vanadate), supplemented with the protease inhibitors 1 mmol/L PMSF and 10 μg/mL leupeptin. Clarified supernatants were collected and the protein concentration was determined by using the micro-BCA protein quantitation kit (Pierce). One hundred micrograms of total protein was incubated with 10 μg of anti–cdk-2 antibody (cat no. 163; Santa Cruz Biotech Inc, Santa Cruz, CA) for 2 hours at 4°C. Thirty microliters of Protein A-Sepharose (cat no. 20334; Pierce) was added to each sample and incubated at 4°C for 1 hour. After centrifugation, the samples were washed extensively in lysis buffer, followed by 2 washes in kinase buffer (20 mmol/L HEPES pH 7.4, 10 mmol/L Mg acetate). The pellets were then incubated in 30 μL of kinase reaction buffer (kinase buffer containing 0.5 μg histone H1, 20 mmol/L cold ATP, and 0.185 MBq [5 μCi]] 32P-gamma-ATP [11 100 × 1010 Bq (3000 Ci/mmol) DuPont, Wilmington, DE]) for 30 minutes at 30°C. The reaction was stopped by the addition of Laemmli's buffer, boiled 5 minutes, and the kinase products were resolved by 10% SDS-PAGE, dried, and exposed for autoradiography.
The cdk4 kinase assays were performed similarly, except that the cells were lysed by sonication in 1 mL of lysis buffer (50 mmol/L HEPES pH 7.5, 150 mmol/L NaCl, 2.5 mmol/L EGTA, 1 mmol/L EDTA, 10 mmol/L β-glycerophosphate, 0.1 mmol/L sodium vanadate, 1 mmol/L NaF, 0.1% Tween 20, 10% glycerol, 1 mmol/L DTT, 1 mmol/L PMSF, and 10 μg/mL leupeptin). Four hundred micrograms of lysate was used to immunoprecipitate cdk4 complexes using 10 μg of anti–cdk4 antibody (cat no. sc-260; Santa Cruz Biotech), and the substrate in the kinase reaction was 0.5 μg GST-pRb (C-terminal of the retinoblastoma protein fused to glutathione-S-transferase). The histone H1 and GST-pRb substrates were kind gifts of X. Grana, Fels Institute, Temple University, Philadelphia, PA.
Results
Analysis of endogenous E2F-1 expression in M1 cells and establishment of M1E2F-1 cell lines
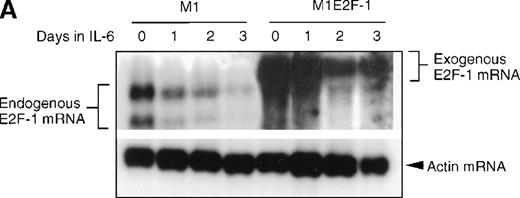
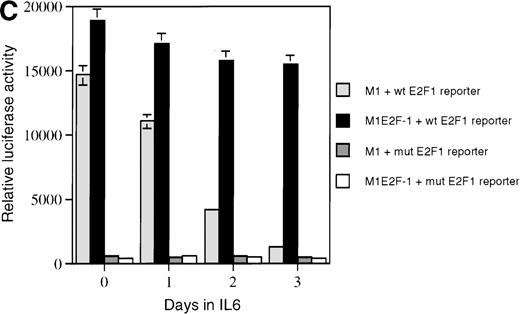
As a first step toward understanding the contribution of E2F-1 to myeloid cell growth and differentiation, we analyzed the expression of E2F-1 transcripts in M1 leukemic cells in the absence or presence of IL-6. Northern blot analysis (Figure 1A) revealed that the relatively high level of E2F-1 messenger RNA (mRNA) present in proliferating cells was down-regulated in response to growth arrest and differentiation induced by IL-6. Moreover, the down-regulation of the E2F-1 message was mirrored by both a down-regulation of the E2F-1 protein (Figure 1B) and a loss of E2F-1 transcriptional activity (Figure 1C).
E2F-1 expression and activity in M1 and M1E2F-1 cells untreated and treated with IL-6.
(A) E2F-1 mRNA expression in IL-6–treated M1 and M1E2F-1 cells. Cells were collected at the indicated times after IL-6 treatment and total RNA was extracted. The RNA (10 μg per lane) was resolved on a 1% agarose gel and transferred to a nylon membrane. The RNA blot was then hybridized to a 32P-labeled murine E2F-1 probe. Equal loading of RNA in each lane was confirmed both by visualizing equal intensity of ethidium bromide staining of ribosomal RNA bands and by hybridization of the Northern blot with radiolabeled β-actin probe. (B) E2F-1 protein expression in M1 and M1E2F-1 cells after IL-6 treatment. Cell lysates were prepared at the indicated time points after addition of IL-6 as described in “Materials and methods.” Fifty micrograms of protein per sample were electrophoretically fractionated on a 10% polyacrylamide gel and transferred to a PVDF membrane. The blot was then probed with an antimurine E2F-1 polyclonal antibody (Santa Cruz Biotech Inc, diluted 1:1000). Signals were developed by using the enhanced chemiluminescence (ECL) Western blotting system (Amersham). (C) E2F transcriptional activity in untreated and IL-6–treated M1 and M1E2F-1 cell lines. Cells were seeded at a density of 0.5 × 10⁶ cells/mL and 24 hours later were transfected with wt-E2F-Luc or mut-E2F-Luc luciferase reporter plasmids containing 3 tandem copies of wild-type or mutant E2F-1 binding sites, respectively; described in Krek et al.11 The cells were then incubated in the absence or presence of 50 ng/mL IL-6 and were harvested at 1-day intervals (day 0 to day 3). They were lysed in reporter lysis buffer and the resulting cell extract was used to measure luciferase activity in a Lumat LB 9501 luminometer after normalizing for transfection efficiency (described in “Materials and methods”).
To address the role of E2F-1 in terminal myeloid differentiation, we examined the consequences of deregulation of E2F-1 expression in M1 cells. M1E2F-1 clones were obtained as described in the “Materials and methods.” While endogenous E2F-1 expression was turned off, expression of the exogenous E2F-1 transgene remained elevated (Figure1A). Consistent with this finding, Figure 1B shows that in IL-6–treated M1E2F-1 cells, the amount of E2F-1 protein was comparable to that in untreated M1 cells. This was further supported by the assay for transcriptional activity of E2F-1 (Figure 1C). Most of the decreases in E2F-1 RNA, protein, and transcriptional activity in IL-6–treated M1E2F-1 cells can be accounted for by down-regulation of endogenous E2F-1. Four additional independent M1E2F-1 clones responded similarly, whereas control clones of M1 cells transfected with the empty MSCV-puromycin vector behaved indistinguishably from the parental M1 cells (data not shown).
Effect of deregulated expression of E2F-1 on terminal differentiation, growth arrest and apoptosis of myeloid cells
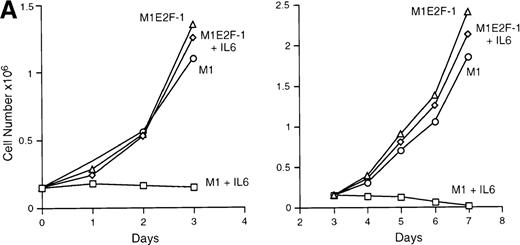
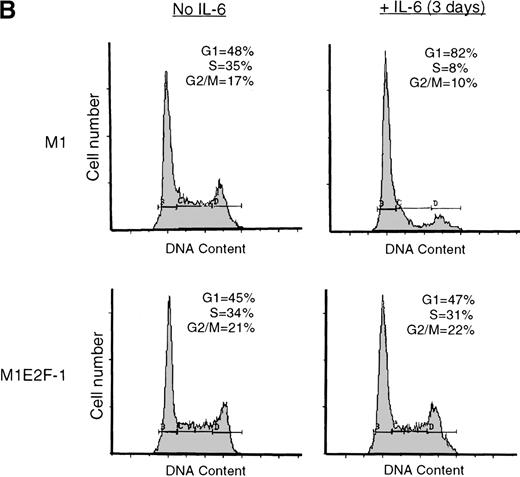
IL-6 treatment of M1 cells leads to growth arrest within 24 hours, associated with induction of terminal differentiation. Analysis of the growth kinetics of IL-6–treated M1E2F-1 cells showed that they continued to proliferate at the same rate as untreated M1E2F-1 and parental M1 cells (Figure 2A). These data were corroborated by cytofluorometric analysis (Figure 2B), which indicated that IL-6–treated M1E2F-1 cells, unlike similarly treated M1 cells, did not undergo growth arrest in the G0/G1 phase of the cell cycle. Furthermore, in agreement with the unaltered growth kinetics of IL-6–treated M1E2F-1 cells, there was no evidence for apoptosis, determined by cytofluorometric analysis (Figure 2B), and absence of both apoptotic morphology and genomic DNA ladders (data not shown). Taken together, these results indicate that the deregulated expression of E2F-1 prevents the growth inhibition induced by IL-6, without the associated cell death reported for other cell types.30,31,34,35 53-56
Growth properties of M1 and M1E2F-1 cells untreated and treated with IL-6.
(A) Growth kinetics of M1 and M1E2F-1 cells treated with IL-6. Cells were seeded at 0.15 × 10⁶/mL in the presence or absence of IL-6 (50 ng/mL) and the number of viable cells was determined at the indicated times by trypan blue dye exclusion and counting in a hemocytometer. On day 3 untreated M1 and M1E2F-1 cells and IL-6–treated M1E2F-1 cells were diluted and reseeded at 0.15 × 10⁶/mL. Each time point is the average of at least 3 experiments, with a standard deviation of up to 15%. Four other independent M1E2F-1 clones gave similar results and M1-puromycin control clones behaved indistinguishably from parental M1 cells. (B) Flow cytometric analysis (FACS) of IL-6–treated M1 and M1E2F-1 cells. FACS analysis was carried out as described in “Materials and methods.” Note the lack of a sub-G0/G1 peak in the IL-6–treated M1E2F-1 sample, indicating an absence of apoptotic cells.
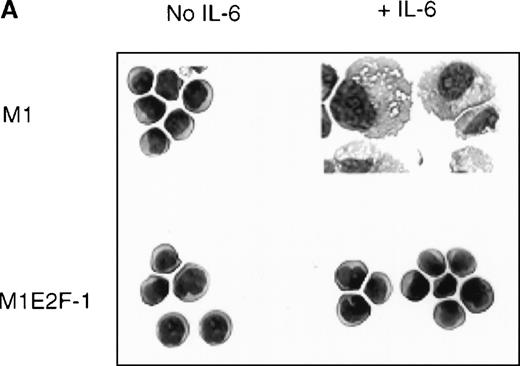
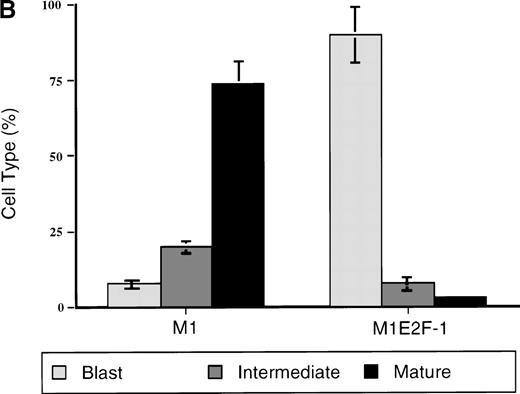
To ascertain the effect of deregulated E2F-1 on IL-6–induced macrophage differentiation in M1 cells, May-Grünwald-Giemsa– stained cytospin smears of M1 and M1E2F-1 cells, untreated or treated with IL-6 for 3 days, were prepared and scored for the percentage of cells at different stages of macrophage differentiation. As shown in Figure 3 , unlike the parental M1 cells in which the majority of the cells displayed a mature macrophage morphology, the M1E2F-1 cells had morphologic characteristics of immature blasts, which were indistinguishable from the morphology of undifferentiated M1 cells. Quantitative analysis of the number of M1E2F-1 cells that had accumulated at different stages of macrophage differentiation, after 3 days in the presence of IL-6 (Figure 3B), revealed that more than 85% of these cells had a blast-like morphology and up to 10% were at an intermediate stage of differentiation, whereas only 5% showed a mature macrophage-like morphology. These results were in sharp contrast to the results for parental M1 cells, in which, after 3 days of IL-6 treatment, about 75% of the cells displayed a mature macrophage morphology, and less than 10% were at the blast stage.
Analysis of the morphologic characteristics of M1 and M1E2F-1 cells before and after treatment with IL-6.
(A) Representative photomicrographs of May-Grünwald-Giemsa–stained cytospin smears of cells are shown (magnification, ×400). Cells were seeded at 0.1 × 10⁶/mL and treated with IL-6 (50 ng/mL) for 3 days before they were collected for analysis. (B) Cell-type distribution of M1 and M1E2F-1 cells at 3 days after IL-6 stimulation. Morphologic differentiation was determined by counting at least 300 cells on stained cytospin smears, and scoring the proportion of immature blast cells, cells at intermediate stages of differentiation, and mature macrophages. For each cell type, analysis was performed several times with similar results. The data represent a mean value obtained from at least 3 independent determinations and have a standard deviation of ± 15%. Furthermore, there was no difference in the response of the parental M1 cells and the control M1-puromycin cells transfected with the empty puromycin vector.
To further examine the effect of deregulated E2F-1 on the progression of the M1 differentiation program, the expression of Fc and C3 receptors, which are early markers of M1 differentiation,42 was analyzed. Of parental M1 cells, 82% and 91% treated with IL-6 scored positive for Fc and C3 receptors, respectively. In contrast, less than 10% of similarly treated M1E2F-1 cells were positive for Fc and C3 receptors, comparable to their expression in untreated cells.
Taken together, these data clearly show that deregulated expression of E2F-1 blocked terminal differentiation of M1 cells at an early blast stage, thereby indicating that E2F-1 down-regulation is required for the differentiation program to proceed.
Deregulated E2F-1 and the p15/p16-Rb-E2F checkpoint
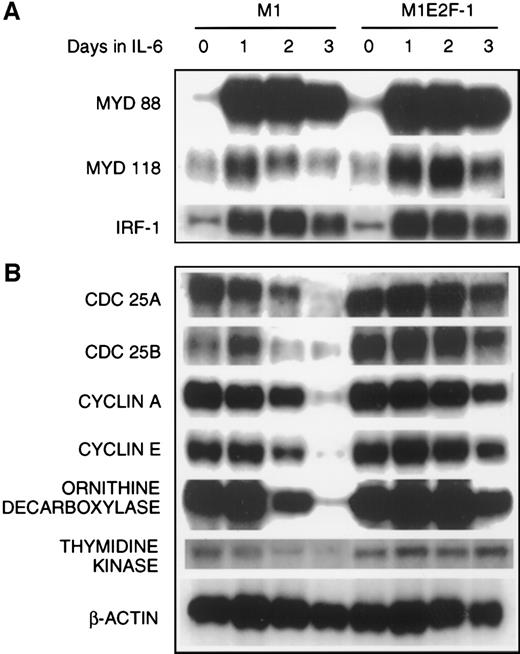
The preceding results established that deregulated expression of transcriptionally active E2F-1 blocked terminal differentiation and maintained M1 myeloid leukemic cells in a continuously proliferative state. To address the question of how E2F-1 might exert these effects, expression analysis of several known marker genes was carried out. The first set of genes whose expression was examined are members of the differentiation primary response gene family (MyD88,MyD118, and IRF-1), rapidly induced in M1 cells by IL-6 treatment in the absence of de novo protein synthesis.39,57 58 Figure 4A shows that these genes were also induced with similarly rapid kinetics in the M1E2F-1 cells after IL-6 stimulation. The continuous, elevated expression of MyD118, which is down-regulated in IL-6–treated M1 cells after 1 day (Figure 4A) is consistent with a block in progression of the differentiation program. These data indicate that the IL-6–induced differentiation program is initiated, but unable to progress in the M1E2F-1 cells. The induction of MyD genes rules out the possibility that deregulated E2F-1 blocks differentiation by interfering with the IL-6 signaling pathway.
Northern blot analysis of gene expression in untreated and IL-6–treated M1 and M1E2F-1 cell lines.
Cells were collected at the indicated times and total RNA was extracted as described in “Materials and methods.” The RNA (10 μg per lane) was resolved on a 1% agarose gel and transferred to a nylon membrane. The RNA blot was then hybridized to the appropriate32P-labeled probe, washed, and subjected to autoradiography for 24 to 48 hours at −80°C. After stripping, the Northern blot was reprobed.
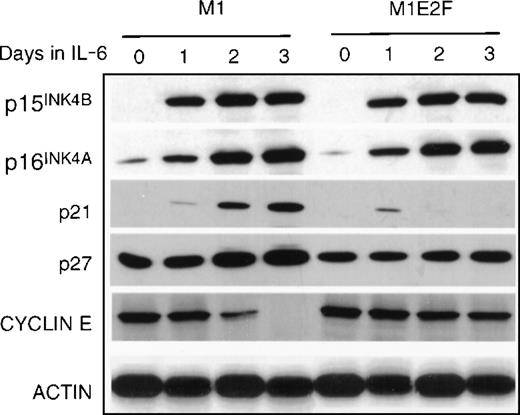
The next set of genes whose response was studied were those that are known to be positive regulators of proliferation (cdc25A,cdc25B, cyclin A, cyclin E, ODC, andthymidine kinase). The results (Figure 4B; Figure5 , cyclin E protein expression) show that the expression of all these genes was shut off in M1 cells in response to IL-6, but their down-regulation was prevented in M1E2F-1 cells.
Protein expression in M1 and M1E2F-1 cells.
Protein extraction and immunoblotting were as described in “Materials and methods,” and Figure 1.
Protein expression in M1 and M1E2F-1 cells.
Protein extraction and immunoblotting were as described in “Materials and methods,” and Figure 1.
Finally, the expression of genes that have been shown to negatively regulate cellular proliferation was analyzed. These were the cyclin-dependent kinase inhibitors p15INK4B, p16INK4A, p21, and p27 (Figure 5) and the retinoblastoma susceptibility gene product, pRb (Figure6B). In M1 cells, growth arrest in response to IL-6, p15INK4B, p16INK4A, and p21 was induced. The p27 was constitutively expressed in M1 cells, and not regulated by IL-6 treatment. Because the kinetics of induction of p15INK4B and p16INK4A protein (up by day 1) more closely paralleled the timing of growth arrest (1 day) in these cells, it is possible that p15INK4B and/or p16INK4A, rather than p21, plays a role in the initiation of growth inhibition. This does not rule out, of course, a role for p21 (which is induced at day 2) in the continued maintenance of growth arrest during differentiation. Both p15INK4B and p16INK4A were also induced in M1E2F-1 cells on addition of IL-6.This was unexpected because, as shown previously, these cells did not undergo growth arrest in response to IL-6 and continued to proliferate with kinetics that were similar to those of untreated parental M1 cells.
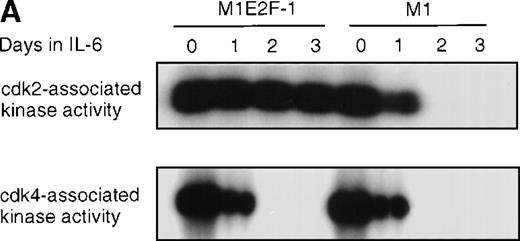
Cdk2-and cdk4-associated kinase activities, and expression and phosphorylation status of the retinoblastoma gene product (pRb) in M1 and M1E2F-1 cells, untreated and treated with IL-6.
(A) Cdk2- and cdk4-associated kinase activities in M1 and M1E2F-1 after treatment with IL-6. Cell lysates were prepared at the indicated times after addition of IL-6 and kinase reactions were carried out as described in “Materials and methods.” One hundred micrograms protein per sample and histone H1 substrate were used in the cdk2 kinase assay. For the cdk4 kinase assays, 400 μg protein per sample and GST-Rb substrate were used. After completion of the reactions, samples were fractionated on a 10% gel, dried, and subjected to autoradiography for 2 hours. (B) Western blot analysis of the expression and phosphorylation status of the pRb in IL-6–treated M1 and M1E2F-1 cells. Protein extracts were prepared before and after induction for differentiation with IL-6 at the indicated time points as described in “Materials and methods.” Fifty micrograms per lane of total protein extract were fractionated on a 6% SDS-PAGE gel, transferred to a PVDF membrane, and probed with an anti-Rb monoclonal antibody (diluted 1:1000). Signals were developed by using the enhanced chemiluminescence (ECL) Western blotting system (Amersham). ppRb indicates the hyperphosphorylated state and Rb is the hypophosphorylated form.
To determine whether the induced p15INK4B and p16INK4Ain IL-6–treated M1 and M1E2F-1 cells were functional, the activity of cdk4 kinase was assayed. The complete abrogation of detectable cdk4 kinase activity in both IL-6–treated cell lines (Figure 6A) indicated that the cdk inhibitors were indeed functional. A consequence of inhibition of cdk4 activity is hypophosphorylation of pRb. However, although in IL-6–treated M1 cells pRb was both down-regulated and completely hypophosphorylated, in IL-6–treated M1E2F-1 cells, pRb was not down-regulated and, surprisingly, only 54% (as determined by densitometer scanning of the autoradiogram) became hypophosphorylated (Figure 6B). This partial hypophosphorylation of pRb might be explained by the continued presence of normal levels of cdk2 kinase activity (Figure 6A).
Taken together, these findings indicate that deregulated E2F-1 blocked terminal differentiation of M1 cells by overriding the p15/p16-Rb-E2F checkpoint in the G1 phase of the cell cycle.
Effect of deregulated E2F-1 on IL-6–mediated suppression of M1 leukemogenicity
It has been shown that intravenous injection of untreated M1 cells into nude CD-1 nu/nu mice results in the rapid development of a leukemic phenotype that is similar to acute myelogenous leukemia (AML) in human patients.45 59 All the mice die within 6 weeks as a direct result of the unregulated proliferation of M1 cells. If M1 cells were treated with IL-6 and induced for terminal differentiation before injection into the mice, then there was a complete absence of leukemia. Thus, IL-6 is able to suppress the leukemogenic potential of M1 cells in vivo. To better understand the relationship between blocks in differentiation and leukemogenicity, we examined the effects of deregulated E2F-1 on the ability of IL-6 to suppress the leukemic phenotype of these cells in nude mice.
M1 and M1E2F-1 cells, either untreated or 5 days after treatment with IL-6, were intravenously injected into CD-1 nu/nu mice. As shown in Table 1 , whereas IL-6–treated M1 cells lost their leukemogenic potential, IL-6–treated M1E2F-1 cells retained their leukemogenicity and were as lethal as the untreated M1 and M1E2F-1 cells. Furthermore, examination of the bone marrow from a single mouse from each group 3 weeks after injection revealed the presence of myeloid leukemic cells, as determined by growth and differentiation characteristics, in mice that had been injected with untreated M1 or M1E2F-1 cells or with IL-6–treated M1E2F-1 cells. In contrast, leukemic cells were undetectable in the bone marrow of mice that had been injected with IL-6–treated M1 cells. Thus, deregulated expression of E2F-1 not only blocked M1 differentiation, but also prevented the loss of their leukemogenic phenotype.
Effect of deregulated E2F-1 on leukemogenicity of M1 cells
| Cells* . | IL-6 . | Mice dead (%) . | Myeloid leukemic cells recovered from bone marrow† . | |
|---|---|---|---|---|
| 3 wk . | 6 wk . | |||
| None | − | 0 | 0 | − |
| M1 | − | 60 | 100 | + |
| M1 | + | 0 | 0 | − |
| M1E2F-1 | − | 40 | 100 | + |
| M1E2F-1 | + | 50 | 100 | + |
| Cells* . | IL-6 . | Mice dead (%) . | Myeloid leukemic cells recovered from bone marrow† . | |
|---|---|---|---|---|
| 3 wk . | 6 wk . | |||
| None | − | 0 | 0 | − |
| M1 | − | 60 | 100 | + |
| M1 | + | 0 | 0 | − |
| M1E2F-1 | − | 40 | 100 | + |
| M1E2F-1 | + | 50 | 100 | + |
For each cell type, 10 nude mice were intravenously (tail) injected with 2 × 10⁶ cells. Cells were treated for 5 days with or without IL-6 (50 ng/mL) prior to inoculation of the mice.
Three weeks following inoculation, one mouse injected with each cell type was sacrificed, and the bone marrow was analyzed for the presence of myeloid leukemic cells.
Discussion
To investigate the role of E2F-1 in myeloid differentiation, M1E2F-1 cell lines were established, which expressed the E2F-1 transgene in a deregulated mode. When these cells were subjected to IL-6 treatment, exogenously expressed E2F-1 blocked the normal program of differentiation at a very early stage. M1E2F-1 cells stimulated with IL-6 have the same blast-like morphology as untreated controls, and there is no elevated expression of the differentiation-associated cell surface Fc and C3 receptors. Moreover, E2F-1 expression also inhibited the growth arrest that is normally associated with terminal differentiation; the IL-6–treated M1E2F-1 cells continued to proliferate at the same rate as their untreated counterparts. These results demonstrate, therefore, that the down-regulation of E2F-1 expression by IL-6 in M1 cells is a necessary event for differentiation to proceed.
Previous attempts to study the effects of E2F-1 on hematopoietic cell differentiation include the work of Guy et al,37 who used an in vivo transgenic mouse model to study the effects of deregulated E2F-1 (under control of a megakaryocyte-specific promoter) on megakaryocytic differentiation. In this work, it was observed that deregulated E2F-1 impaired megakaryocyte maturation at the postmitotic phase, resulting in massive accumulation of abnormal megakaryocytes and reduced platelet formation. Because the rate of apoptosis of the transgenic megakaryocytes was increased as well, it was concluded that deregulated E2F-1 may have impaired megakaryocyte maturation via its cell cycle-stimulatory activity. In a second study, the effects of deregulated E2F-1 on cell cycle progression and granulocytic differentiation was analyzed using IL-3–dependent 32Dcl3 hematopoietic progenitor cells that, after IL-3 removal, are induced by G-CSF for proliferation and differentiation along the granulocytic pathway.38 In this cell system, overexpression of E2F-1 overrode the survival functions of G-CSF, resulting in 32Dcl3 apoptotic cell death; deregulated expression of E2F-1 in conjunction with ectopic expression of Bcl-2 delayed apoptosis and prevented granulocytic differentiation.
Although both of these studies suggest that deregulated E2F-1 impairs hematopoietic differentiation, interpretation has been complicated by the fact that the effects of deregulated E2F-1 have been examined in experimental systems where hematokine-induced cell proliferation was coupled to cell differentiation, and where perturbing E2F-1 expression also induced cell death. The findings reported in this work provide the first direct evidence for the ability of deregulated E2F-1 to block terminal differentiation of myeloid progenitor cells segregated from hematokine-induced cell proliferation and in the absence of E2F-1–induced apoptosis. Because M1 cells are null for p53,60,61 the absence of apoptosis may reflect E2F-1 dependence on p53 for this activity, which is consistent with previous reports.30,31,34-36 62
Mechanistic insights into how deregulated E2F-1 may function to block terminal differentiation and its associated growth arrest have been provided by the surprising findings that deregulated E2F-1 expression did not prevent the rapid IL-6–induced expression of both p15INK4B and p16INK4A. These gene products are most probably responsible for the inhibition of cdk4 kinase activity and subsequent hypophosphorylation of pRb in cycling M1E2F-1 cells. This was unexpected because these features are generally associated with growth inhibition. Yet, despite this, IL-6–treated M1E2F-1 cells continued to proliferate at the same rate as untreated cells. These data indicate that deregulated E2F-1 expression blocks terminal differentiation by uncoupling the induction of p15INK4B and p16INK4A and the concomitant hypophosphorylation of pRb from growth arrest. In IL-6–treated M1E2F-1 cells, in addition to the E2F-1 sequestered by hypophosphorylated pRb, there is still sufficient E2F-1 to promote cell cycle progression.
Recent work63,64 has suggested a positive role for the p21 cdk inhibitor in myeloid differentiation. In agreement with these studies, our results show that p21 was induced in response to IL-6 in the parental M1 cells; however, its induction was abrogated in IL-6–treated M1E2F-1 cells. Because p21 can inhibit the activity of the cyclin E/cdk2 complex, the impaired induction of p21 in these cells may result in higher cyclin E activity. Indeed, our data show that the deregulated expression of E2F-1 maintains both cyclin E expression and cdk2 kinase activity at relatively high levels in IL-6–treated M1E2F-1 cells. The conclusions of some recent studies65-67 indicate that cyclin E is able to promote cell cycle progression, bypassing the p15/p16-Rb growth inhibitory pathway, downstream of pRb activation. It is possible therefore that the uncoupling of p15INK4B and p16INK4A induction and pRb hypophosphorylation from growth inhibition, observed in IL-6–treated M1E2F-1 cells, might be mediated via cyclin E. Further investigation to test this hypothesis is underway.
The disappearance of pRb protein in differentiated M1 cells was somewhat surprising. The regulation of pRb during myeloid differentiation, including transcriptional, translational, and posttranslational controls, will be further investigated.
Despite in vitro demonstrations of the oncogenic potential of E2F-1,68-70 2 recent studies71,72 have unexpectedly implicated E2F-1 as a tumor suppressor gene; transgenic mice nullizygous for E2F-1 displayed hyperplasia in some tissues and developed several types of tumors, including lymphomas and sarcomas. In contrast to a tumor-suppressing function, our study demonstrated that deregulated E2F-1 not only blocks differentiation, but, consequently, also prevents the IL-6–mediated loss of leukemogenicity of M1 cells. Consistent with this oncogenic capability, it has recently been shown that deregulated E2F-1 in transgenic mice can induce skin tumors in cooperation with a v-H-rastransgene.73 Therefore, it appears that in vivo, E2F-1 is, so far, unique in displaying properties of both an oncogene and a tumor suppressor.
In M1 cells, the p53 growth-regulatory pathway, which may normally protect against the inappropriate expression of genes such as E2F-1 by inducing apoptosis, is nonfunctional.60 74 The findings of this study imply that in a p53-null background, secondary genetic defects such as E2F-1 dysregulation can effectively neutralize another major growth-regulatory pathway, namely, the pRb pathway. The ability of E2F-1 to inhibit growth arrest and block differentiation can therefore critically contribute to the progression and aggressiveness of hematopoietic tumors. Taken together, these results further emphasize the paradigm that abnormalities in both growth and differentiation appear to be required for leukemogenesis.
Another important implication of the work presented here is that, although defects of the p15/p16-Rb checkpoint are among the most common genetic alterations in tumorigenesis,75 any potential therapeutic approach that aims to restore function to the components of this checkpoint will have to be evaluated carefully. Such an approach probably would not work in the subset of tumors that have accumulated additional genetic lesions in cell cycle regulators that function downstream of the p15/p16-Rb checkpoint. Therefore, the fact that E2F-1 can block differentiation, promote cell proliferation, and prevent the loss of leukemogenicity by bypassing the growth-inhibitory actions of p15INK4B, p16INK4A, and pRb, suggests that the downstream targets of E2F-1, such as the cyclin E/cdk2 complex, may be important candidates for therapeutic intervention in a wide variety of tumors, including those of the hematopoietic lineage.
Supported by National Institutes of Health Grants No. lROlCA51162 (B.H.), lROlCA43618 (D.A.L.), Amgen (B.H. and D.A.L.), and the core program on carcinogenesis (5P30CA12227).
Reprints:Dan A. Liebermann, Temple University School of Medicine, 3307 N Broad St, Philadelphia, PA 19140; e-mail:lieberma@unix.temple.edu.
The publication costs of this article were defrayed in part by page charge payment. Therefore, and solely to indicate this fact, this article is hereby marked “advertisement” in accordance with 18 U.S.C. section 1734.



This feature is available to Subscribers Only
Sign In or Create an Account Close Modal